

Getting ready for the next market crash.
It may be months or years away, but now is the perfect time to get ready.

In January, 2022, I wrote my first article on substack, “Are you ready for the next market crash?”. In December, 2021, I wrote several blog posts on Seeking Alpha, so I had indeed managed to sound the alarm in advance. Regardless, it was likely very, very difficult for anyone reading that article to take action and follow my advice. After all, I had no track record to review, and, even if I did, change is generally difficult and takes time.
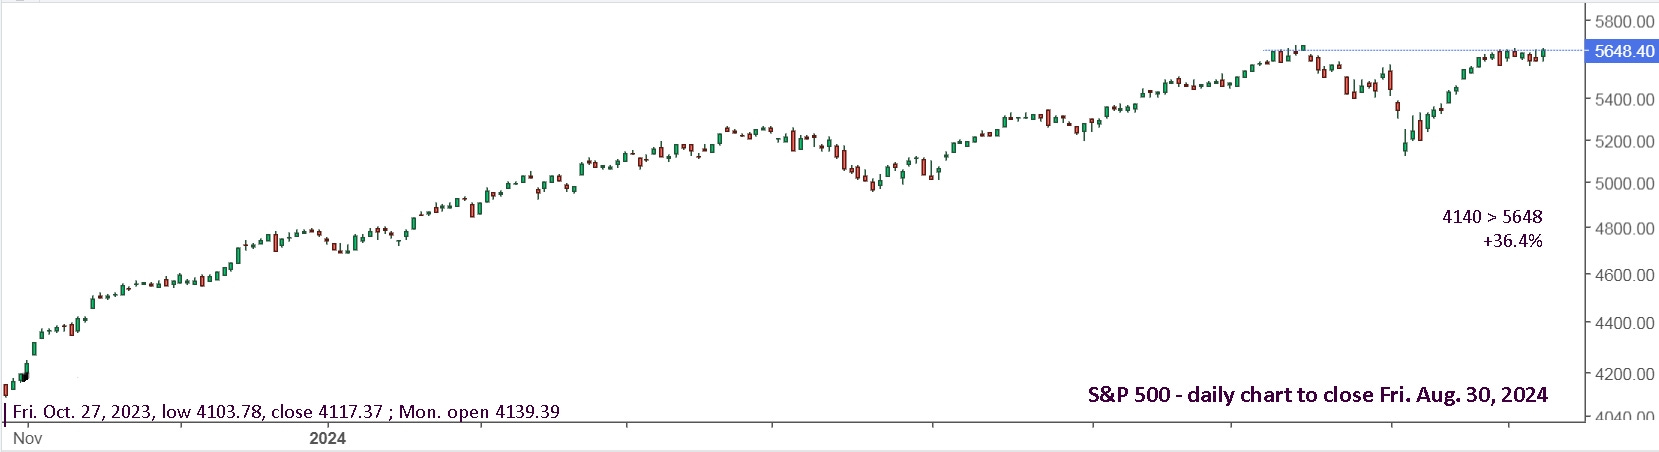
Since then, I have written many more articles to help describe my ideas and strategies, and those same ideas and strategies have continued to become more refined and certain. Simple trendlines remain a key aspect. Here’s a look at the S&P 500.
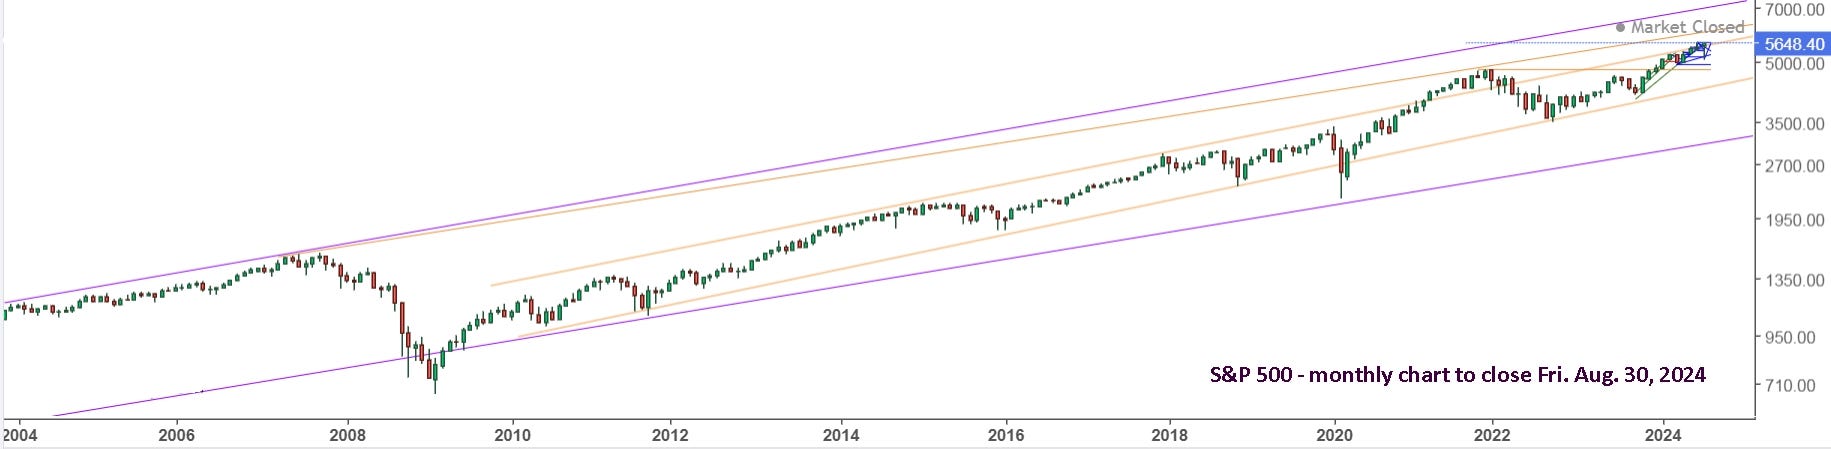
Clearly, it’s at a long standing resistance line and the upper region of its range. At the beginning of 2024, the potential for a repeat of 2021 was clear. It didn’t manage to push into the upper range, like in 2021, and it could now continue to hug the upper trendline, like in 2014-2015, for nearly 1.5 years. You might have that much time to get ready for the next market crash, but I wouldn’t bet on it. Better to get ready now, then simply wait for it to happen.
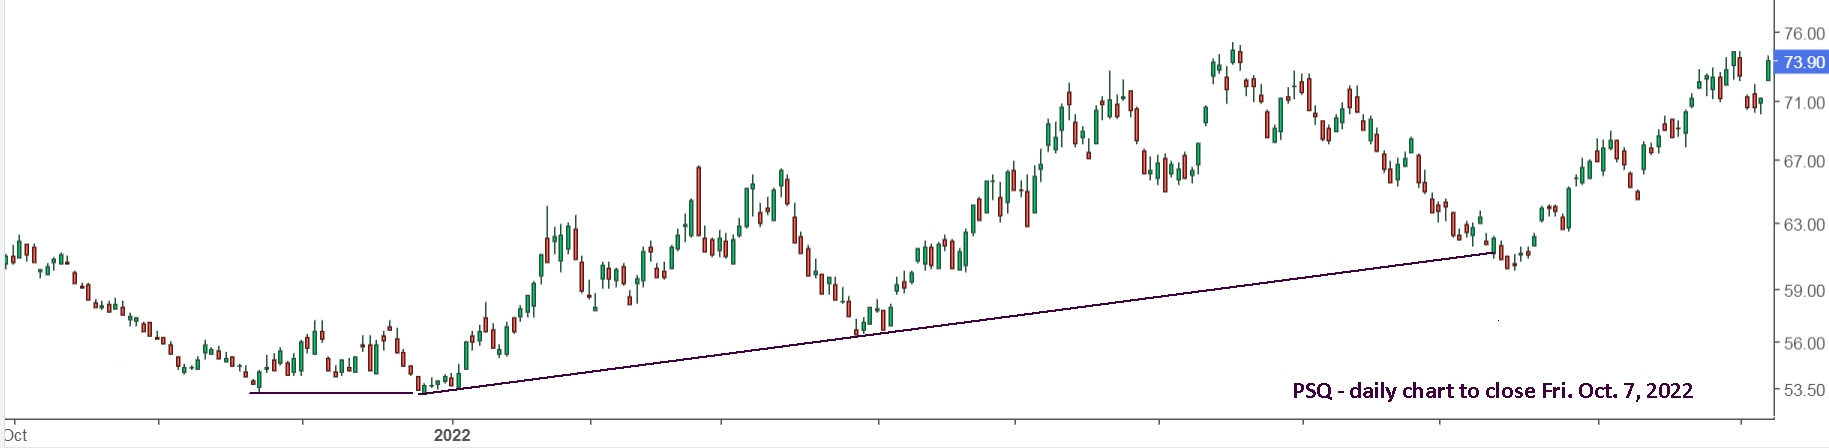
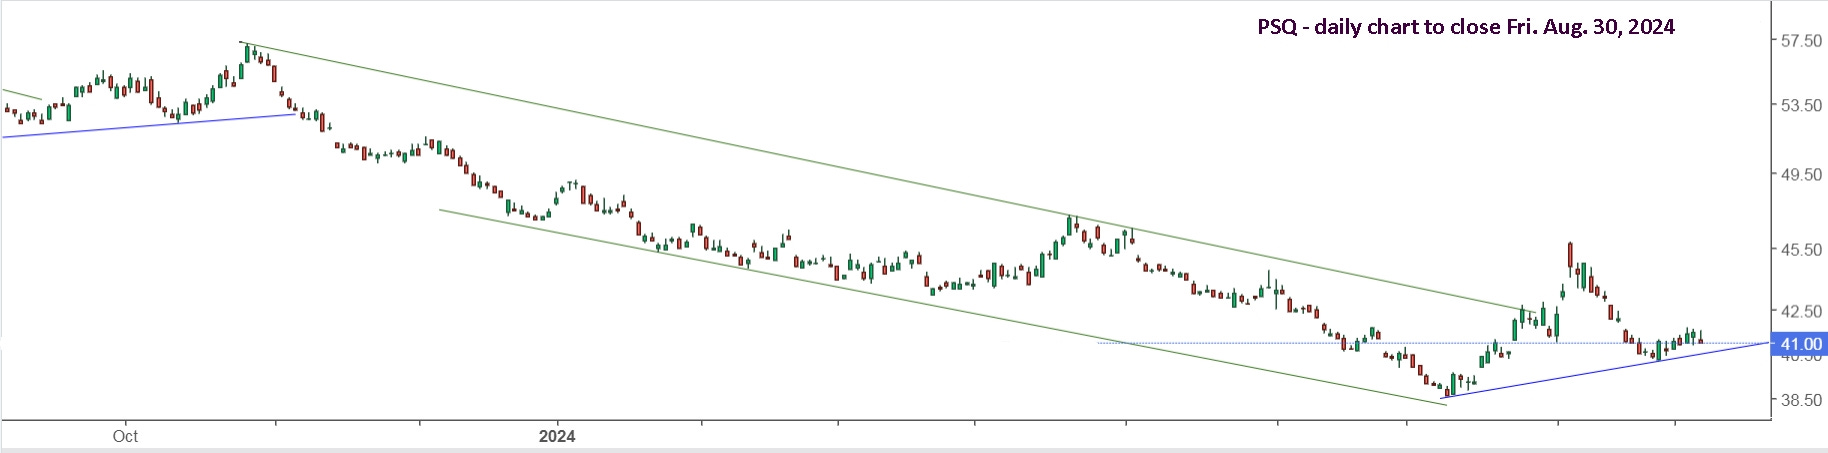
Here’s a look at the short Nasdaq ETF, PSQ, in late 2021 and 2022, and you can compare it to the current chart. To be clear, I don’t recommend buying PSQ, but it can provide a good perspective for where things might be headed.
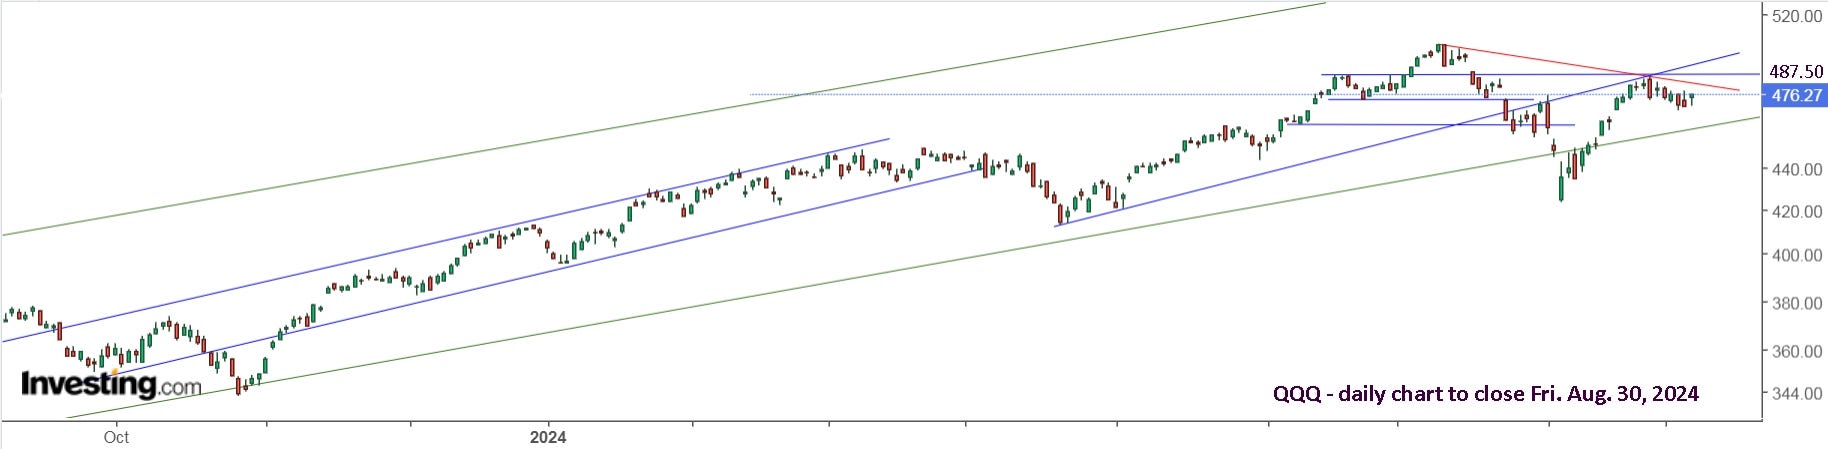
Going short is a completely different ball game from holding long. The markets tend to go up over time, so holding long generally works out positively over time. That doesn’t imply it’s okay or wise to just hold a long position indefinitely. Hopefully, you can see in the chart below where you would have sold (or did sell) QQQ. Until there’s more certainty, there’s no reason to buy back in.
The first step to being ready for a crash is to sell your long positions and be sitting in cash, ready to take advantage of opportunity when it knocks. The second step is to have a clear plan for where to look for the best opportunities and how to catch them. In 2022, my focus was trading volatility with UVXY. My first article was in February, “UVXY - Volatility can be fun and profitable.” Big market drops can be as fun as surfing huge waves and very profitable, like +1174% during the covid drop. This year’s 12.4% drop in the S&P 500 came with a 150% gain with UVXY if you dropped in and took a ride. And best of all, the risk of loss is very low, unlike surfing huge waves which can pummel you senseless.
Some key thoughts: The key is to buy early in the day when it moves up sharply. If you’re up 5% or more by the end of the day, then it’s a very safe hold overnight. If you buy and it reverses, sell for breakeven or a small loss. NEVER hold this ETF on a drop.
I also wrote: You’ve often seen the markets gap lower on Monday, hit the low point of the multi-day drop and reverse hard. So, go with that. Hold all your UVXY for Monday. This was extremely useful advice for recent events. Here’s UVIX, the 2x version of UVXY, for Friday, August 2.

Monday, July 15 was the ‘wake up’ call to get ready, much like Monday, April 1. If you look at past moves, you’d confidently hold most of your shares over the weekend. Sure, it may open lower, giving up some of your 120% gain, or more, or less, but the potential additional gain is worth that risk. We’ll review more examples later. Here’s the move on Monday, August 5, and since.
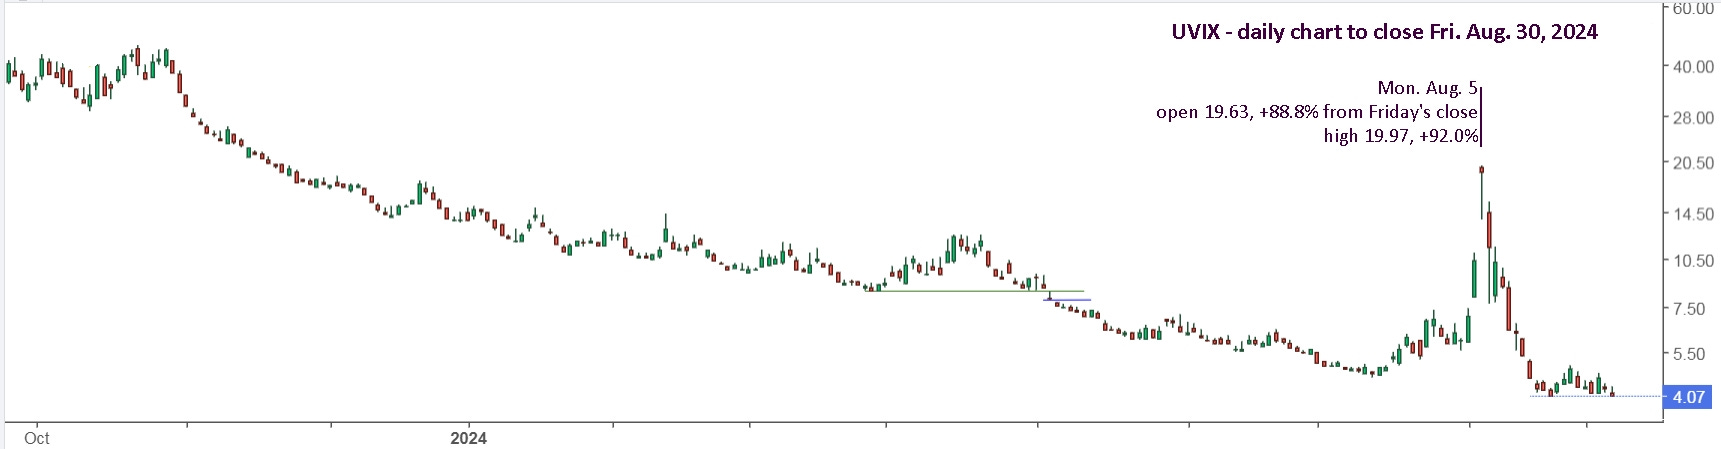
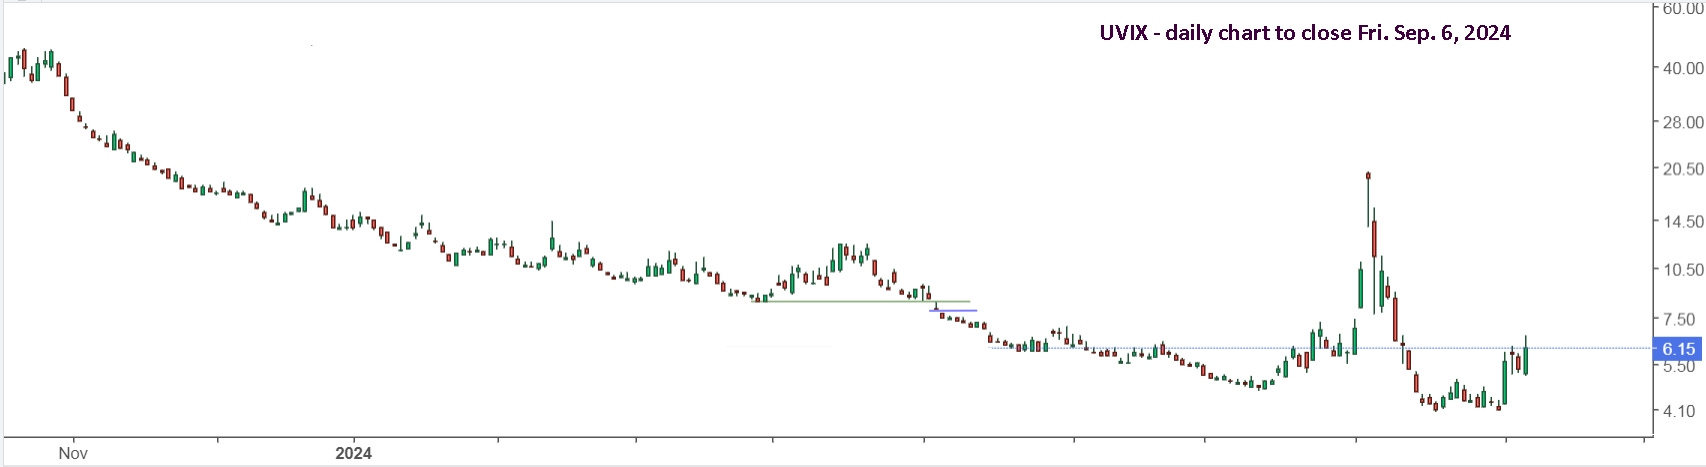
An extra 90% holding from Friday! This move in UVIX is indeed extreme, especially since the market drop was rather innocuous. It’s also shows that you don’t trade it once the ‘panic’ has passed. Here’s the daily chart in 2020, when UVXY went up 1174% in a month.
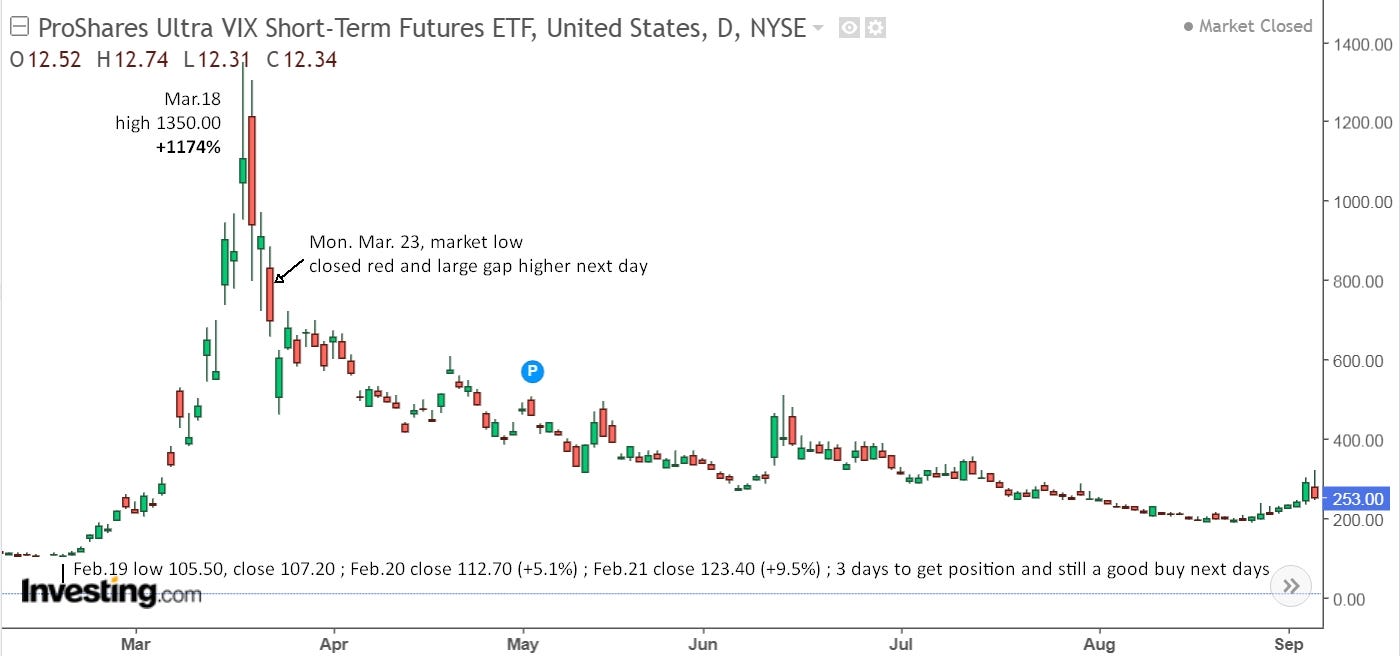
As you can see, when volatility is low, like early February, it’s impossible to suddenly drop further, so buying UVXY is ‘safe’. I mean, you can’t go from not afraid to really not afraid, but you can easily go from not afraid to a bit afraid to really afraid.
The fact that UVIX is already lower than it was in July shows just how unusual the move was, and it also allows us to be ready and waiting for the next move.
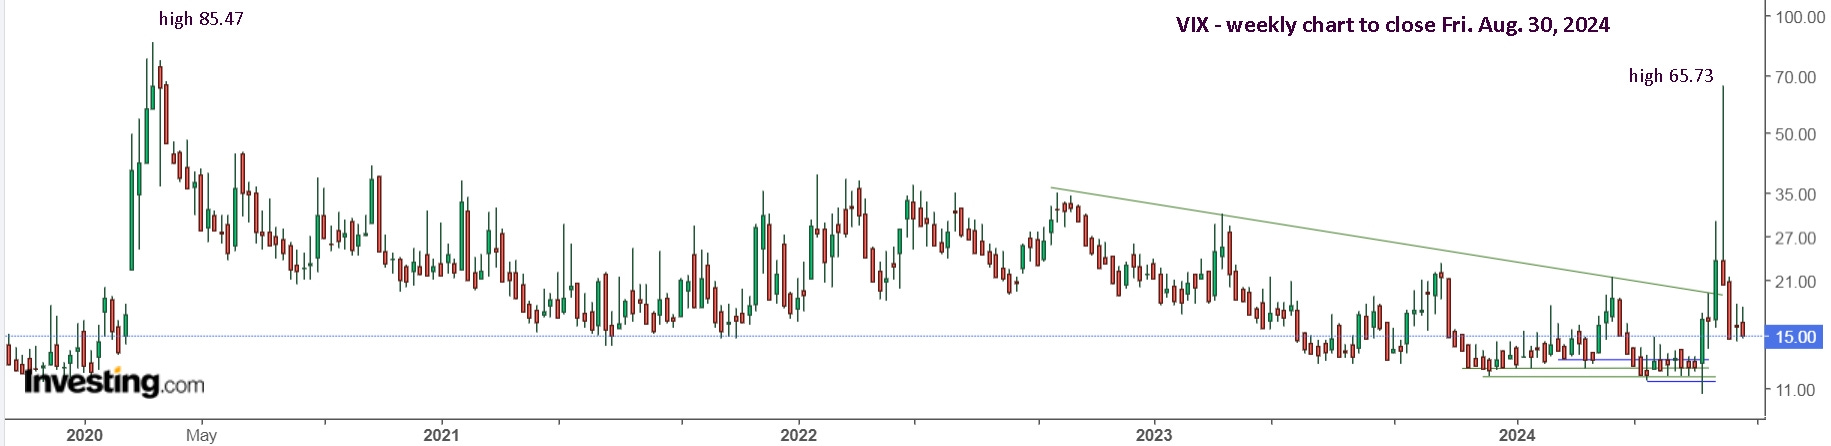
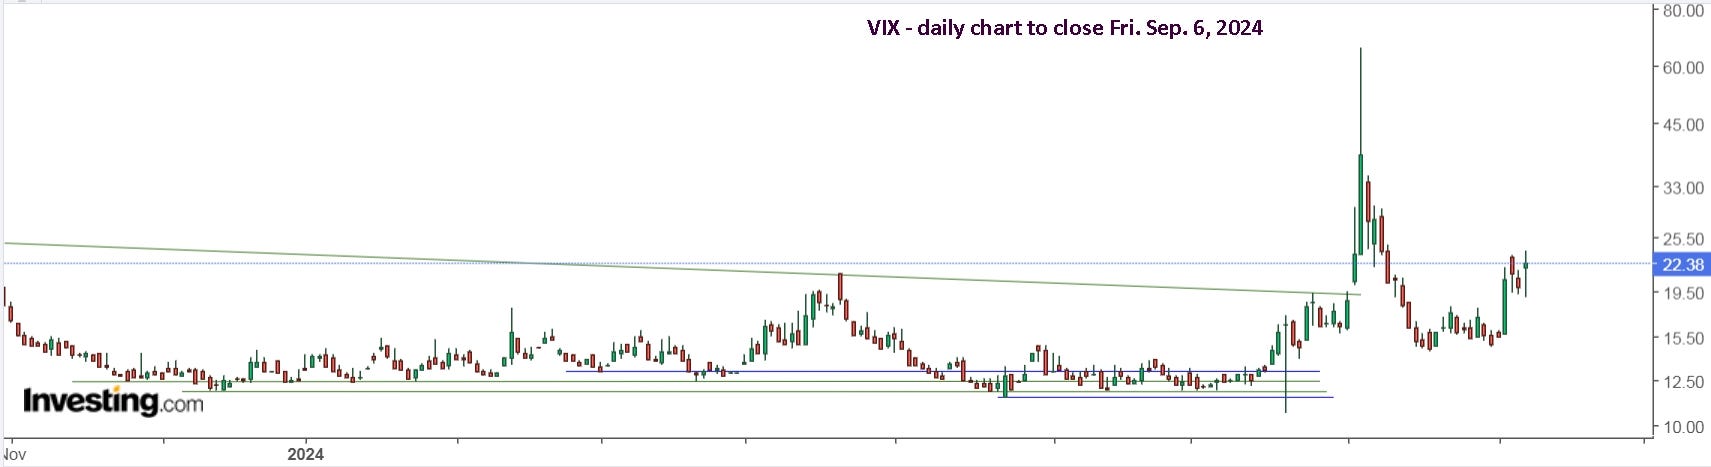
Here’s a weekly look at VIX, which is the underlying reference for UVXY and UVIX.
And here’s a monthly view. As you can see, 2018 is the closest likeness to the current move, basically 2 months with a long spike. Still, it was nothing like the recent move.
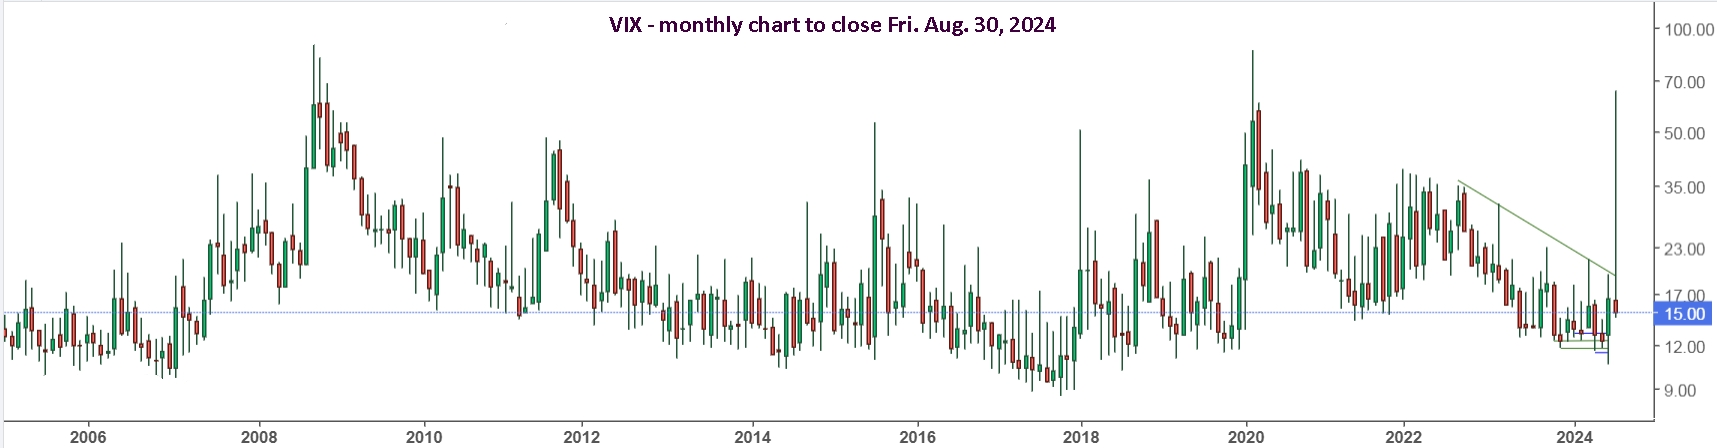
What I see is that VIX maintained higher lows from late 2017, all the way to 2020. I can certainly see that potentially happening going forward to the next major crash, which may also be 2 years away.
The main strategy has been to buy early in the day if it’s moving up and stick with it to the end of its run. Although that strategy has been effective, it’s not particularly easy to follow, and it essentially entails checking every morning, which is tiresome, and can make one ‘trigger happy’ versus patiently waiting for the setup to come.
Another tip was to wait for a ‘wake up call’. Basically a single day making a substantial move after an extended period of dropping lower. You can see such days in the chart below.
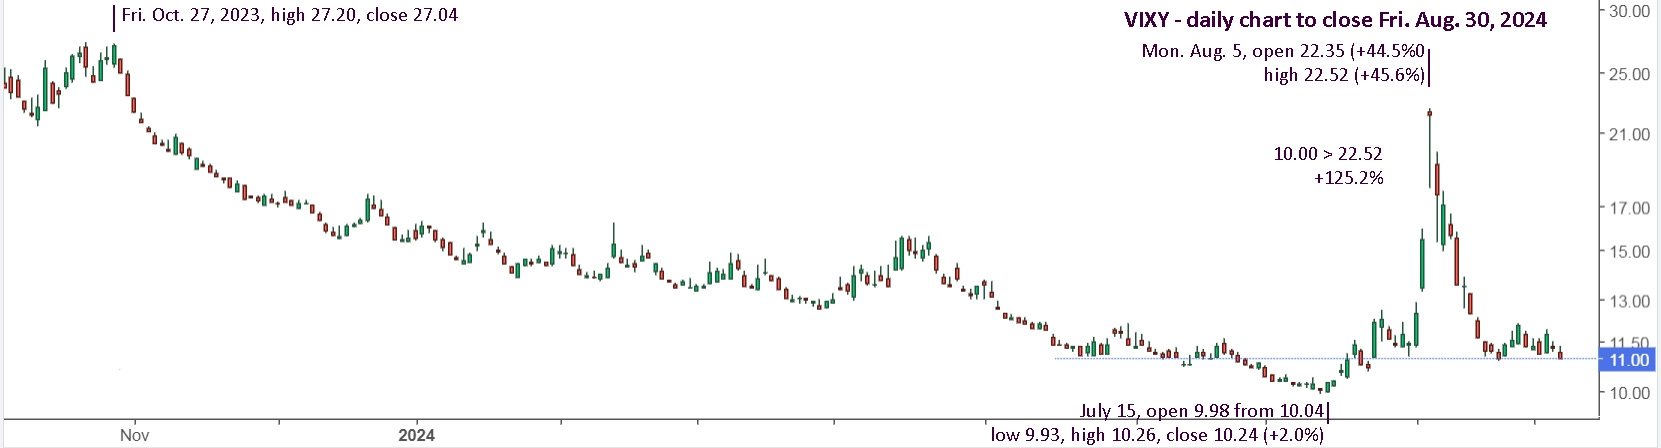
A new adjustment is to look at the daily chart for VIXY, instead of UVXY or UVIX, since it’s decay is less severe. Above, you can see that VIXY is still well above the July 15 low, while UVIX is significantly lower.
Another adjustment that I plan to make is to set GTC stop buys higher so that if the move happens when I’m not able to trade, like the August move, then I will be swept along and won’t miss it. Doing that for all positions would be wise, especially selling.
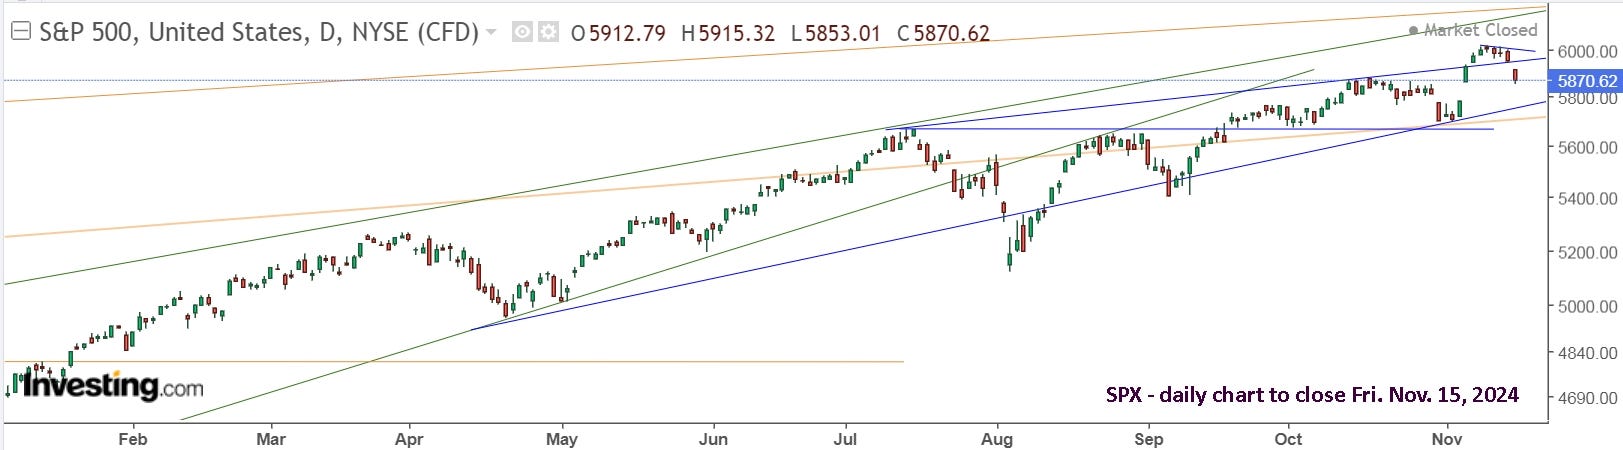
Now let’s look at the daily SPX chart since that’s what the VIX is based on.

Clearly, gains in brief VIXY, UVXY or UVIX trades will easily offset any missed gains from selling long positions early. And one can easily go long again when the ‘caution signs’ have passed. That may indeed happen this coming week.
In my August 13, 2023 article, “Make UVXY your winning lottery ticket that keeps on winning.”, I commented on a Seeking Alpha article “VIXY: Time To Pounce On The VIX” (June 6, 2023). “We target buying the VIXY when the VIX is below 15 points. Based on our proprietary research, this level provides the optimal reward-to-risk for taking a long position on the VIX. We upgrade our rating on VIXY from "Hold" to "Buy".” I commented several times saying that was a really bad strategy, but it fell on deaf ears. A quick look at the VIX chart shows that VIX can remain below 15 for a long period of time.

The author commented on Aug. 5, more than a year after starting the trade. “This is a quick update for those who are still tracking us on VIXY. We took advantage of the spike in the VIX to cut losses on our VIXY position at the close. Unfortunately, this bout of volatility took way too long to materialize, and we held onto VIXY for too long, resulting in losses accumulating over time.”
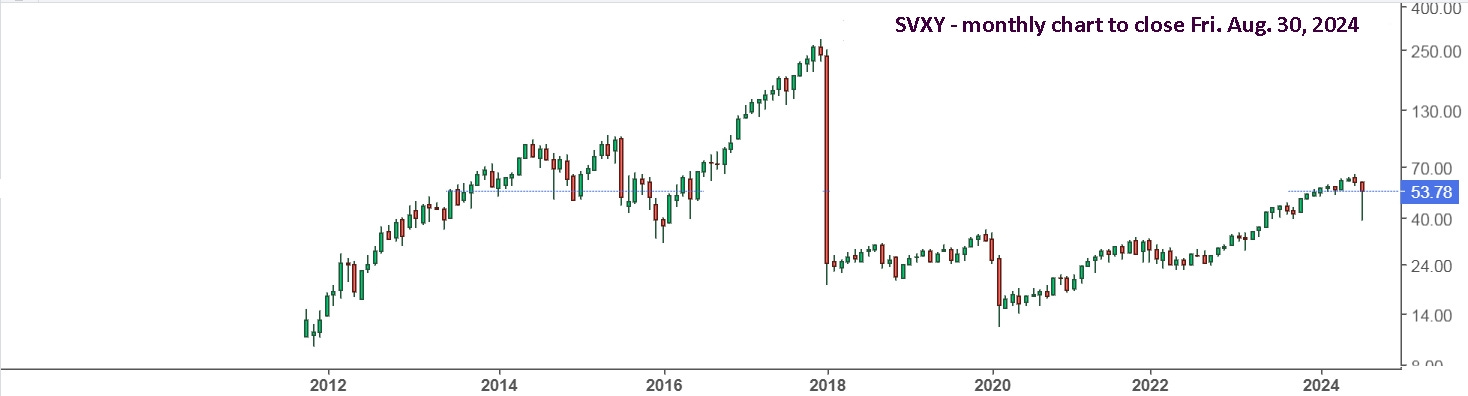
And added, “We are now looking for opportunities to short volatility and may publish an article on SVXY soon.” This is also a really bad idea. Many investors pilled into that ‘easy’ trade in 2016 and 2017. In the chart below, the big red candle in February, 2018 happened overnight from a Monday drop. It was an obvious sell on Monday during trading hours and it opened Tuesday over -90% from Monday’s closing price. Once the markets bottom, you can do much better buying TQQQ and SOXL than SVXY.
So, I’ll make weekly updates going forward and we’ll see if we can catch the next move while keeping losing trades to a minimum.
One further idea might be worthwhile, but probably isn’t. If you want to hold a position overnight, or over the weekend, then VIXY makes sense since it moves less than UVXY and much less than UVIX. If it drops, you simply sell and can make the loss back easily with UVIX when the setup presents itself. If it pops, hold it and buy UVXY or UVIX, then set stop sells for both below the early low. The gain on VIXY will then offset the small loss in the other.
Here’s a list of my other UVXY articles if you’d like to go back in time to get a closer view of what happened then and will likely happen again in the future.
April, 2022, “UVXY - Fear is still the best trade”. +417% YTD following a very simple strategy
May, 2022, “UVXY - Just stick to the game plan” Remember, the main strategy is to buy early in the day if it’s moving up and stick with it as long as possible.
June, 2022, “UVXY - Still Giving Trade Gains” Play by play of recent moves.
July, 2022, “UVXY - Simple doesn't mean it's easy.” Since June, SQQQ became the easier and more profitable trade.
September, 2022, “A Once in a Lifetime Opportunity, again!” The strategy / rules have been working effectively all year. The execution, for myself and probably for you, still needs some practice. I was trading HUV for the first 5 months and it’s terrible because stops are nearly always jumped over. Since switching to UVXY I’ve done much better but I’m still trading too much. Year to date, following the strategy, UVXY is up a potential 12,256% which is unbelievable until you sit down and do the math.
August 13, 2023, “Make UVXY your winning lottery ticket that keeps on winning.” trade details, play by play
September 4, 2023, “Volatility can be super safe and life changing.” background and introduction to the trade ; weekly updates to market bottom end of October and up with UVXY falling steadily. UVXY daily charts from 2013 forward.
As a final reminder, it’s important to continue watching both directions, up and down. Since I’ve focused on TQQQ so far this year, let’s now watch SOXX and its leveraged version, SOXL. Basically watch for a move early in the day, take a swing, set a stop sell and let it ride, just like you would with UVXY or UVIX.

You could also set alerts for 240 and 220 and wait for a direction to be established. Good luck!
Update to Fri. Sep. 6: Tuesday may have caught you by surprise, as it did me, even though I said, be ready. SOXX gapped lower and down it went.
The gap lower needs to have you buying SOXS and UVIX, then setting stop sells. I’ll emphasize again, you really need to be prepared and committed in advance, with cash sitting and waiting to be deployed. If you try and decide how much, etc. at the moment, on the morning, the moment can easily pass and leave you watching it run higher every minute.
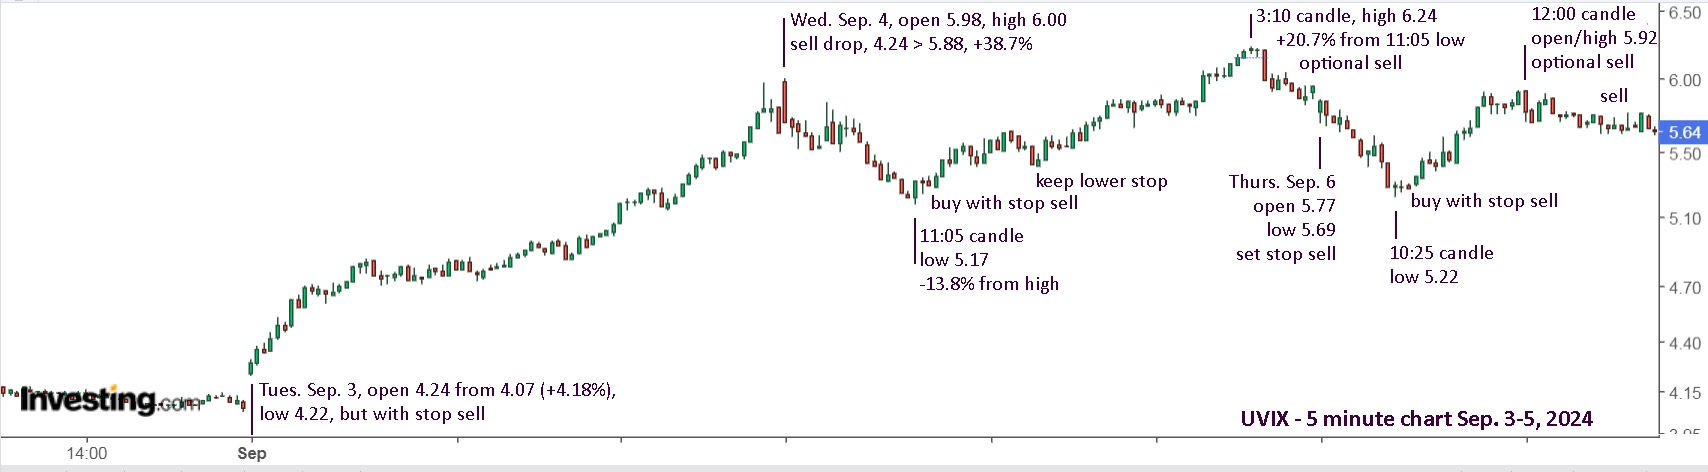
Tuesday was just about as easy as it gets. It opened at 4.24 (+4.18%), hit 4.22 in the first minute and went up to 4.30 in the first 5 minutes. That’s only +1.4%. Buy and set your stop sell at 4.19. If you’re stopped out, be ready to quickly re-buy. It hit 4.38 in the first 10 minutes, +3.3% from the open and a drop of 4.34% if you’re stopped out at 4.19. That’s more than I want to lose in 5 or 10 minutes. Delaying the buy by minutes can put you in a difficult situation. It then held 4.30s for 5 minutes, giving you some extra time to get off the fence. It hit 4.53 in less than 10 minutes after that. If you bought at the open, you’re up 6.8% and can move your stop sell to breakeven. Within 25 minutes, you’re set and comfortably watching the day unfold.
You can see the possible additional trades on Wednesday and Thursday. These require you to actively watch on the day, which is generally worthwhile. These ‘game on’ periods only happen every few months or longer, so you might as well play when the time comes.
Friday was a more difficult early setup, but a stop buy, just above the open/high, got you in and a stop sell then had you safe if it dropped hard after buying. It’s really as simple as that. Then, you let the day play out.
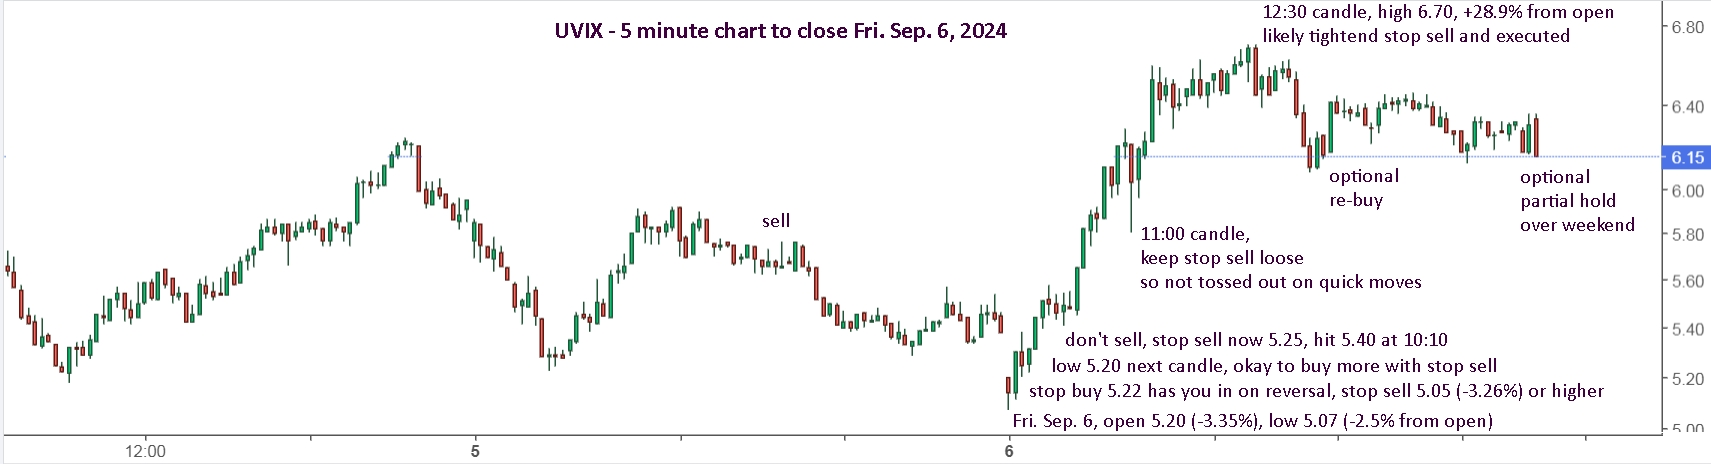
Once you’re in, keep your stop sell loose once it’s above breakeven. It’s better to give up 5% and be stopped out for breakeven, than sell for 5% and then have it go up 20%. If you are stopped out, like on the 11:00 spike down at 5.95 for +14.0% (hit 5.80), you can easily set a stop buy for 6.05 (+1.7% from sell). Setting a stop buy at 6.35, just above the prior high of 6.28 is generally a bad idea. It’s +6.7% from your sell price and could easily trigger in and then plunge. It’s best to keep a close eye on the game when the action heats up. Once it calms down again, you can set your stops and go to the concession for hot dogs and beer.
Holding UVIX over the weekend is completely optional. It’s entirely up to you. Greg is holding his full position and I re-bought half of mine.
Here's a look at SOXS which is up 32.6% from buying Tuesday, which is great, but far less than UVIX, which gave 38% on Tuesday, 20% on Wednesday and 29% on Friday.

So, will you take a shot on Monday? Remember, Monday’s have a history of gapping lower and rallying hard, like August 5, so be ready for that as well.
Update to Fri. Sep. 13: This week pretty much reversed all of last week, which is great, since you should have been ready to take advantage of it. Here’s a look at SOXL, which wasn’t particularly easy, as the Monday move came at 11 o’clock after a gap up and drop. It also didn’t make a strong follow through. That said, you had a second chance Wednesday and a third chance Thursday.

The higher low on Monday was a green light to go long. The higher low on Wednesday was a second green light and provided the lower support line, which then made the buy on Thursday easier. There was no way of knowing Thursday would have a strong rally all day, and Monday wouldn’t, and it doesn’t matter. You simply need to get in safely for both potentials and then see what happens.
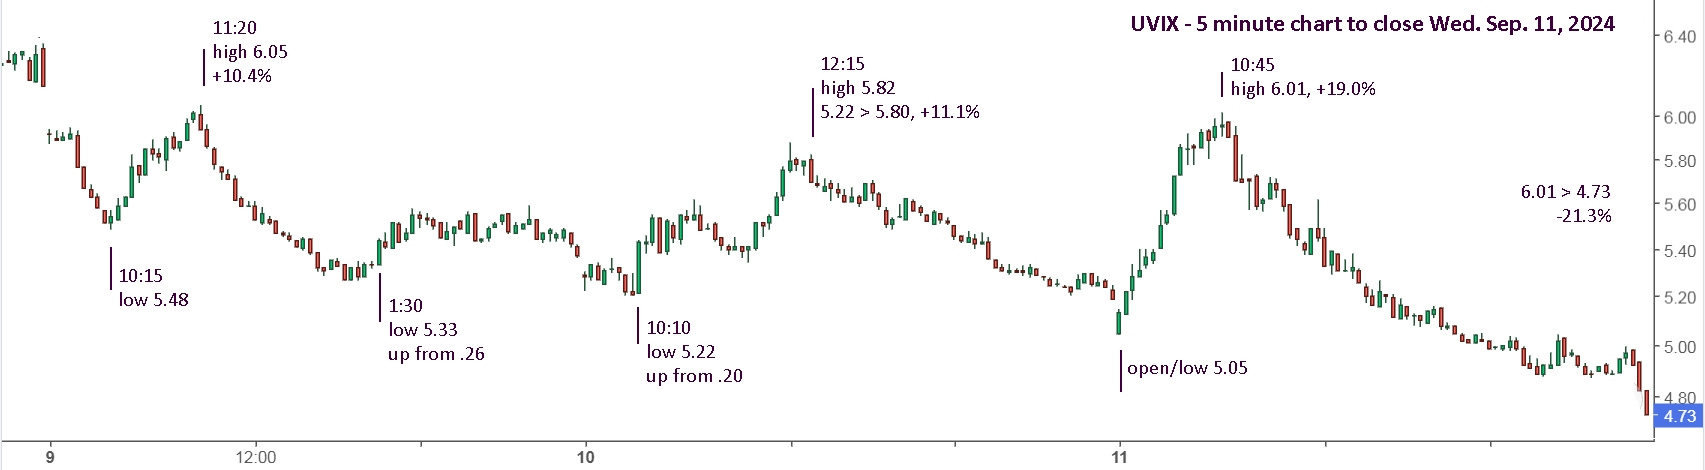
Here’s a closer look at UVIX. Monday gapped lower, held, then fell sharply and reversed at 10:15. If you were nimble, it gave a gain of 10% in an hour. I wouldn’t recommend buying the afternoon reversal. Tuesday and Wednesday also gave good gains on the day from early buys.
The late drop on Wednesday, along with the all day drop, suggests a possible gap lower. If you had bought the 4.88 ‘floor’ for a possible move up, you needed to have a stop sell, as always.
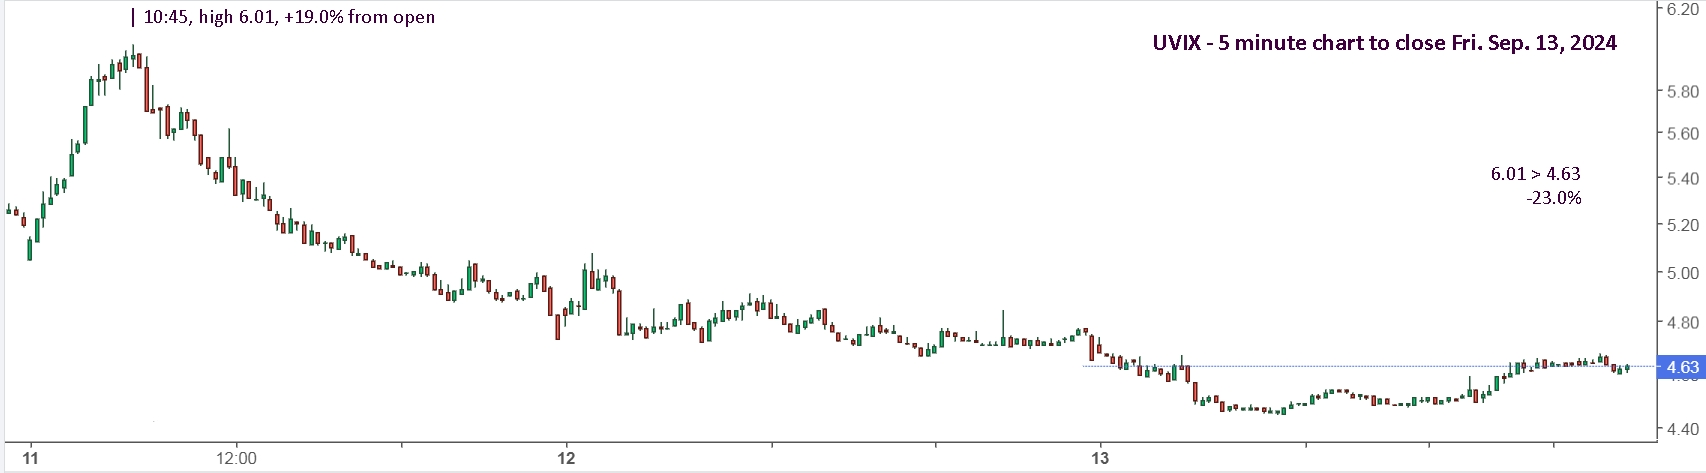
Greg didn’t sell on Wednesday for a possible gain of $50k, +9.0%, then bought 20k shares at 4.90 late in the day. On Friday, he bought 20k shares at 4.50. He now has 140k shares on 5 buys, down $108k, -14.7% at his last buy. His breakeven price is now 5.28, which will likely get hit on a market drop, but there’s no guarantee the markets will drop before UVIX slides under $4. Then he’ll need over 20% to breakeven.
It may have been tempting to buy the 4.45 floor on Friday, but that’s not the recommended strategy. Monday could gap higher, and then it will look like a good call, but it could just as easily gap lower. The key is to be safe and in control. That’s why buying early in the day is best.
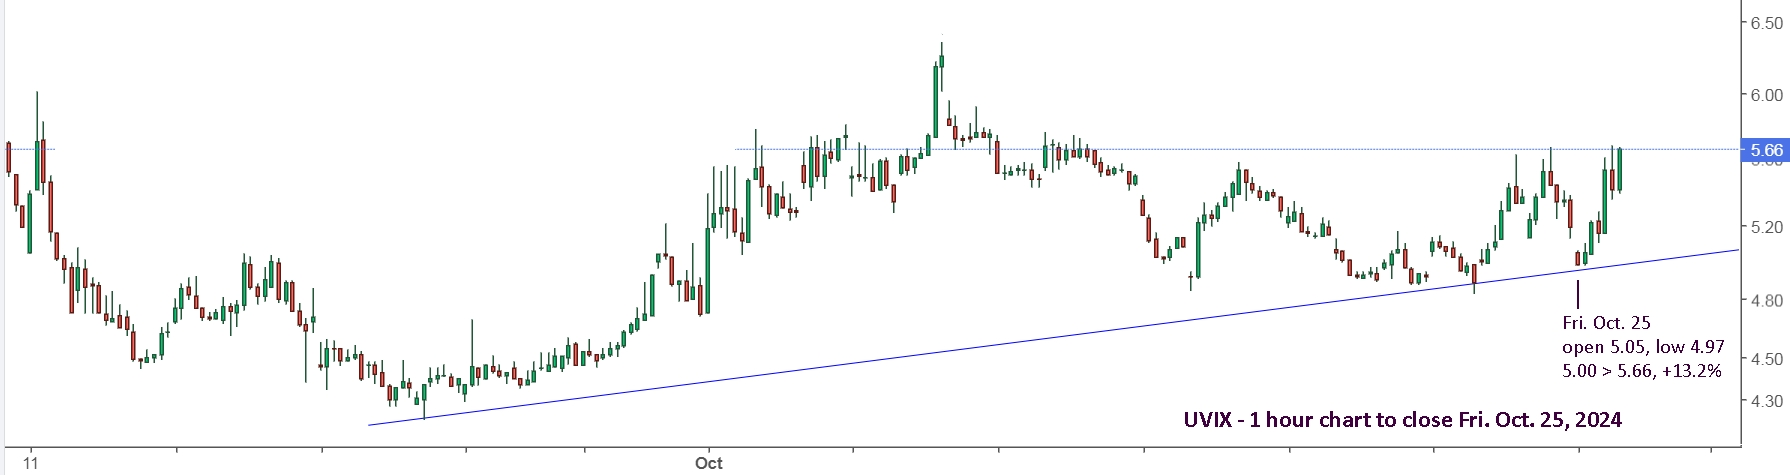
Update to Fri. Oct. 25: Monday, Sep. 16 opened up slightly, so buy and put in stop sell. Either decision made on Friday, Sep. 13 worked out okay, but the key is to remain safe. Buying the dip after the FOMC announcement on Wednesday, Sep. 18, yielded a fast gain and it’s again a decision to sell or hold. This time, it was clearly better to sell.
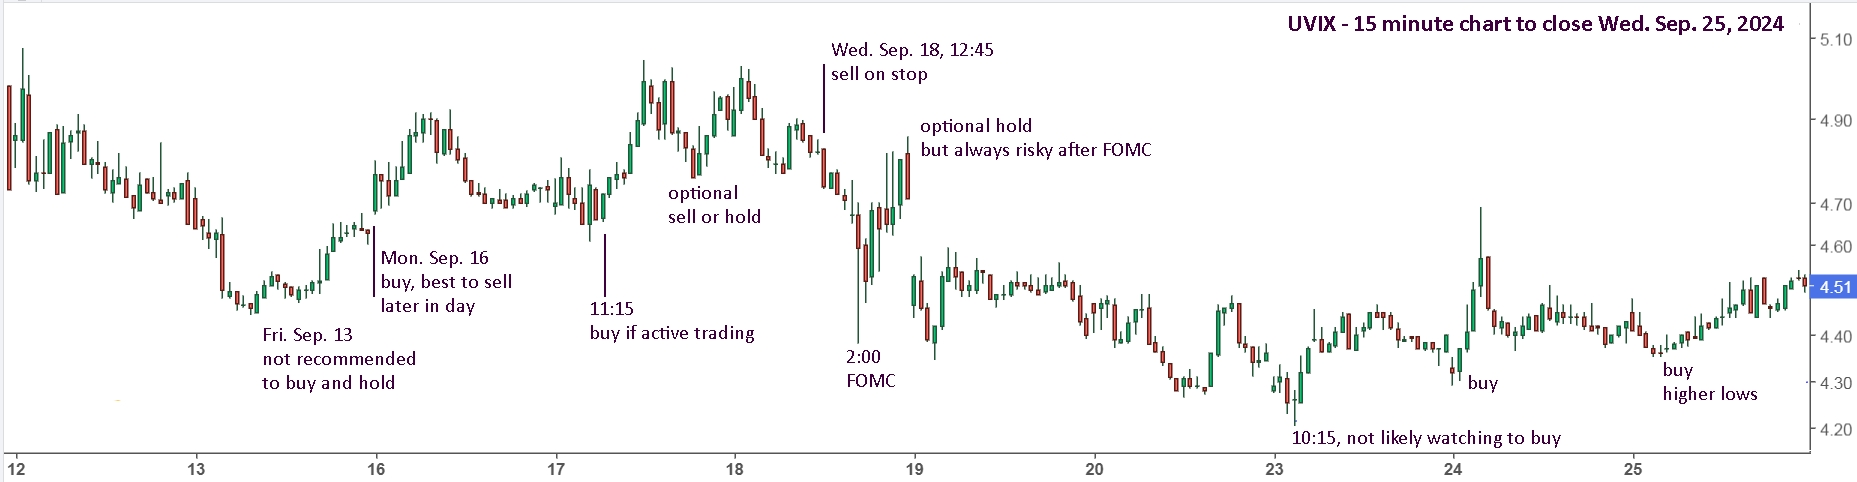
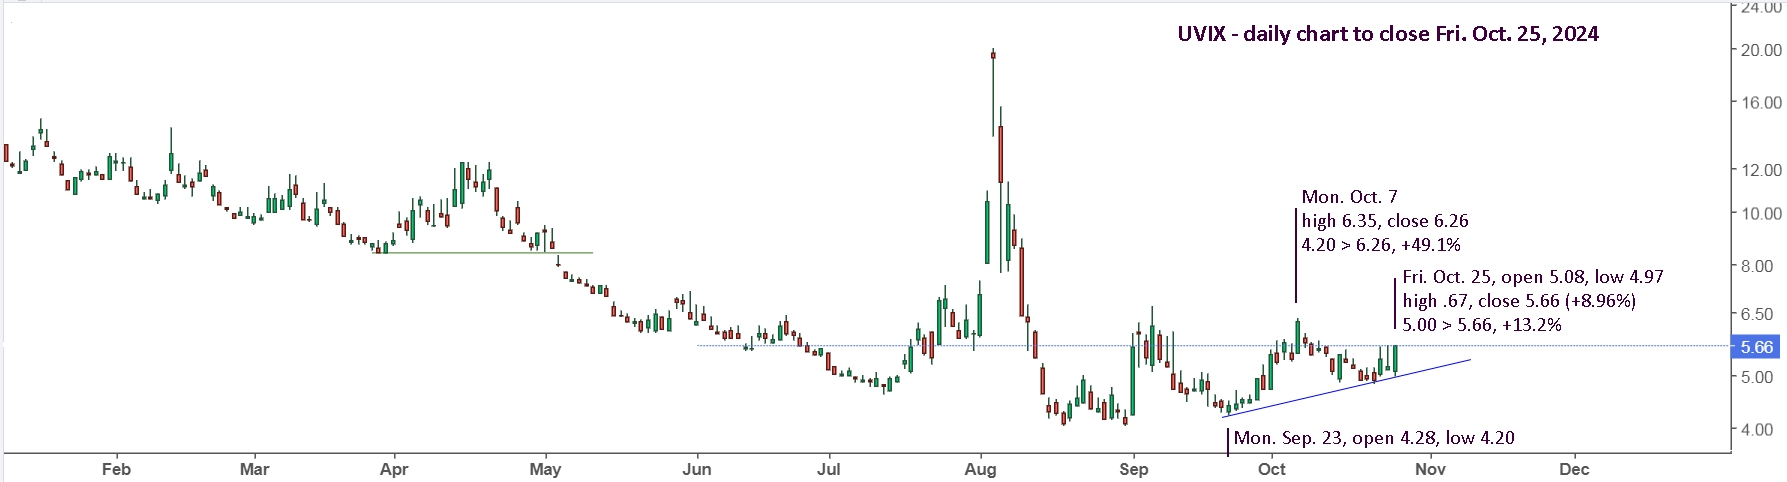
On Monday, Sep. 23, you wouldn’t normally be watching to buy, except Monday’s often provide direction changes in the markets, so watching and taking the opportunity to buy UVIX was smart and a good bet. Everyone should have then been watching and ready to buy on Tuesday. You may have sold the sharp reversal, or held. Buying back in on Wednesday was reasonable given the higher lows. It’s safe since you bought early and have a stop sell. You can see in the VIXY chart below, that it has maintained higher lows since July 15. That is very unusual, but fortunate as it provides a clear reference now to buy.
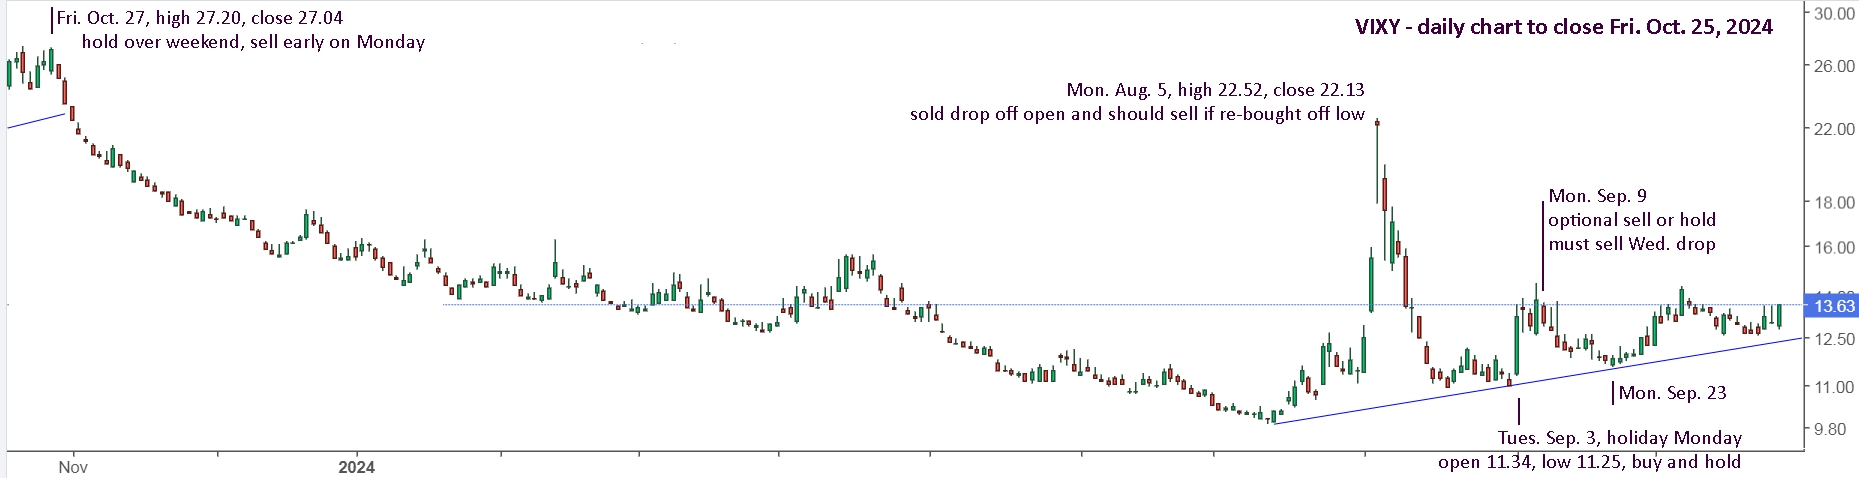
Even UVIX has made higher lows since Sep. 23. I bought early on Friday, Oct. 25, sold some and am holding the rest for Monday. If it opens lower on Monday, then I will watch to buy more and sell if support is broken.
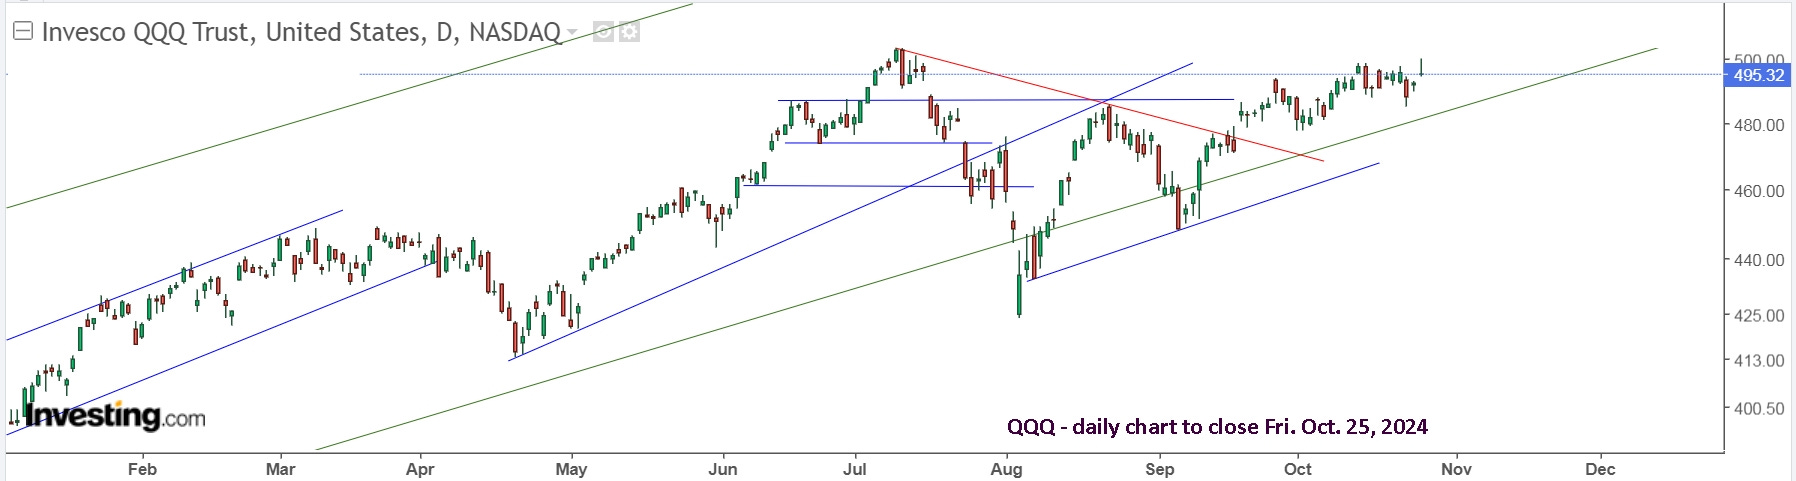
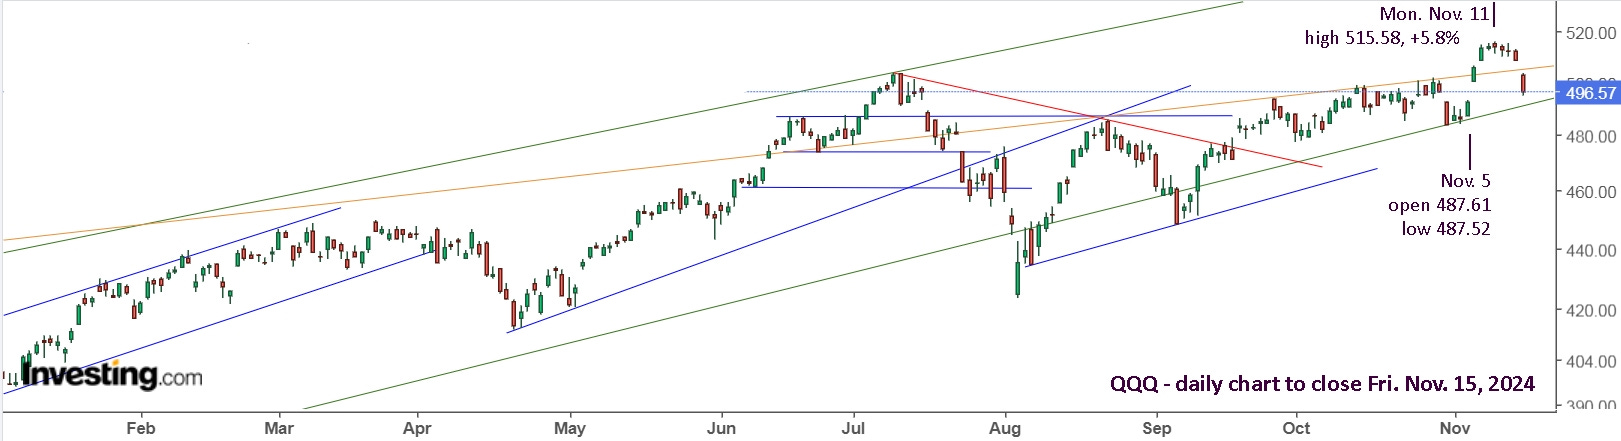
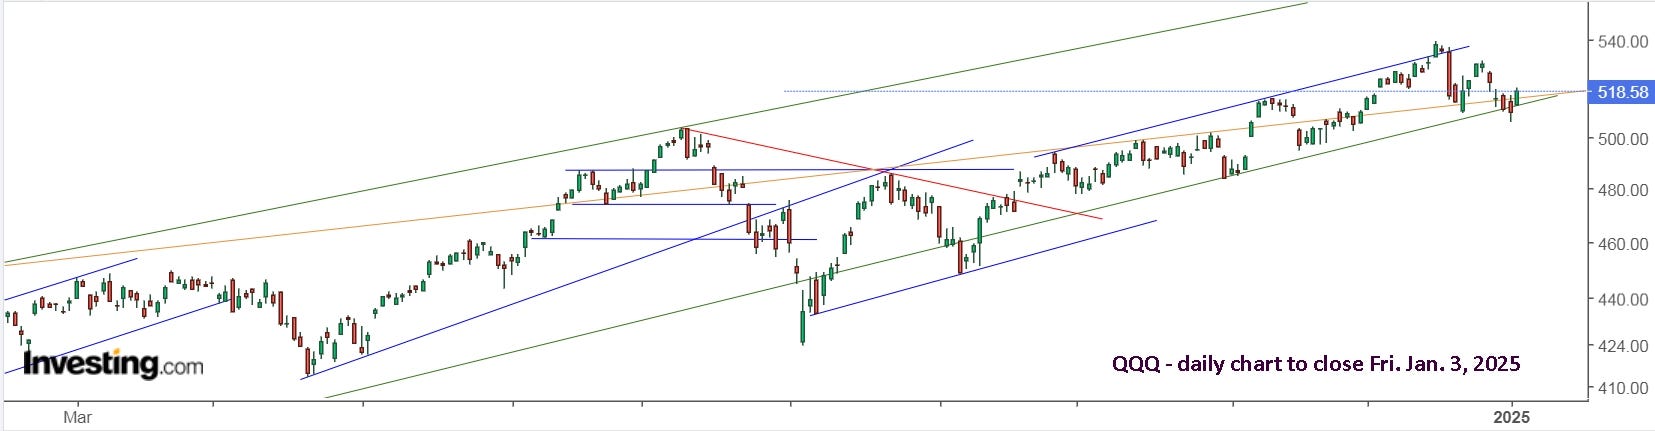
The markets, depending on your perspective and bias (which you’re not supposed to have), could be bullish or bearish. The weekly view of QQQ shows a pretty hard ceiling, but it’s also following the weekly support line higher.

The daily view turned down sharply on Wednesday, then gapped higher on Thursday and Friday. For me, I prefer to wait on the sidelines while it’s going sideways.
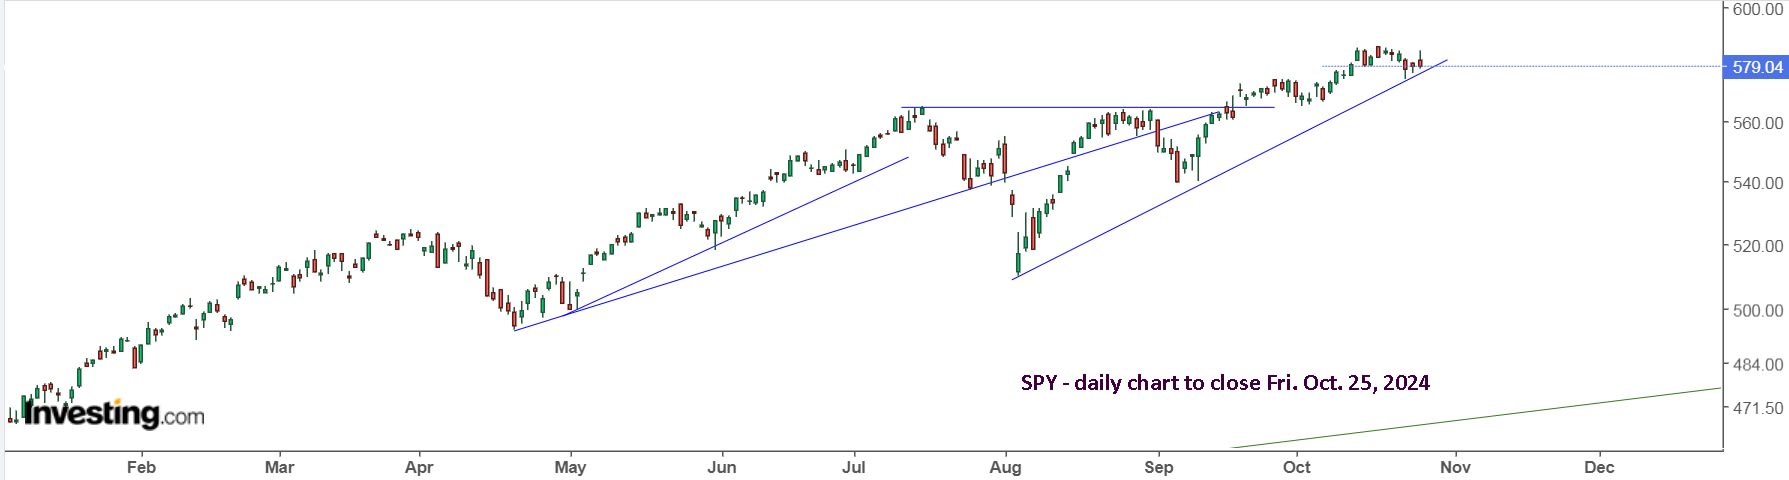
SPY similarly remains bullish, but has lost momentum and is mostly moving sideways.
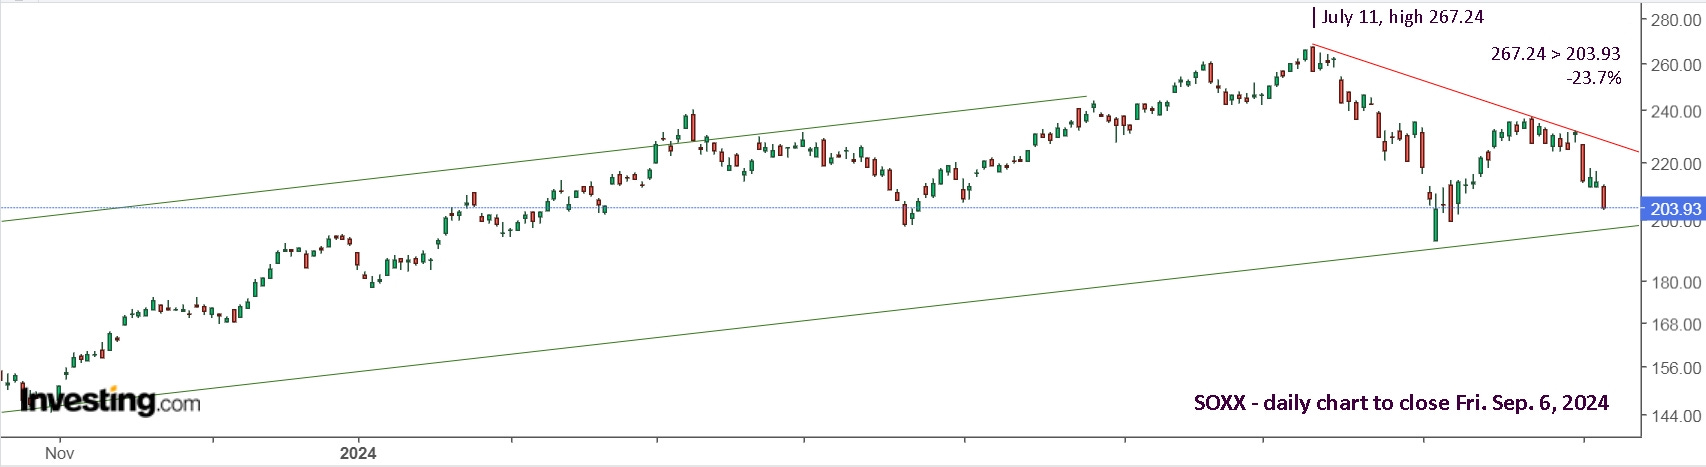
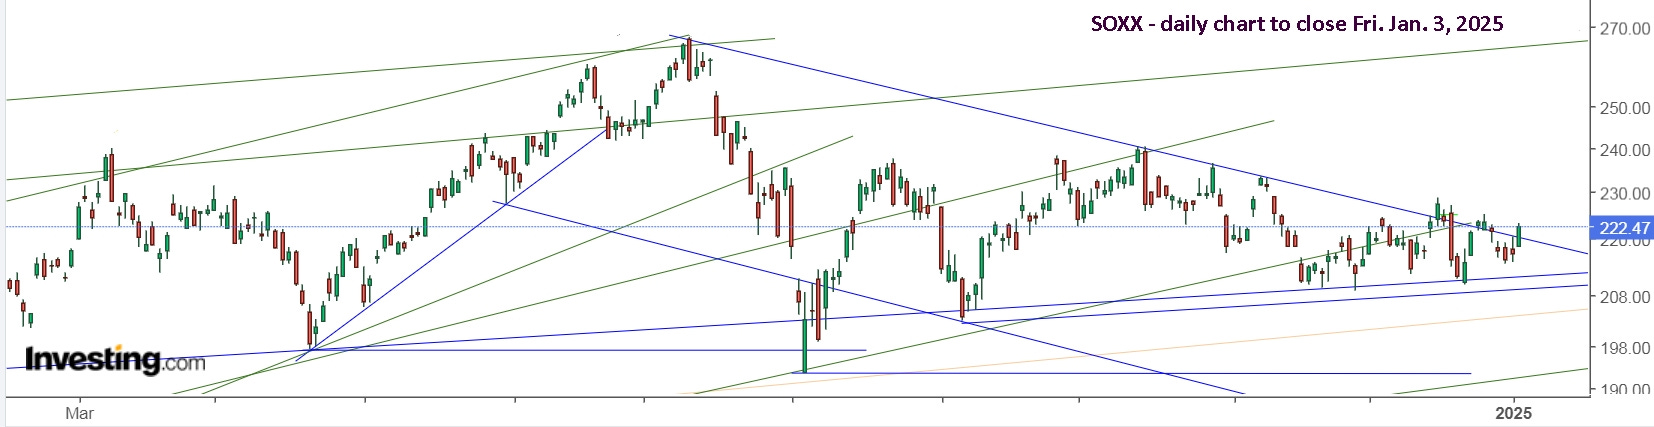
SOXX has also been moving mostly sideways of late, and it still needs to break downtrend resistance from the July 11 high.
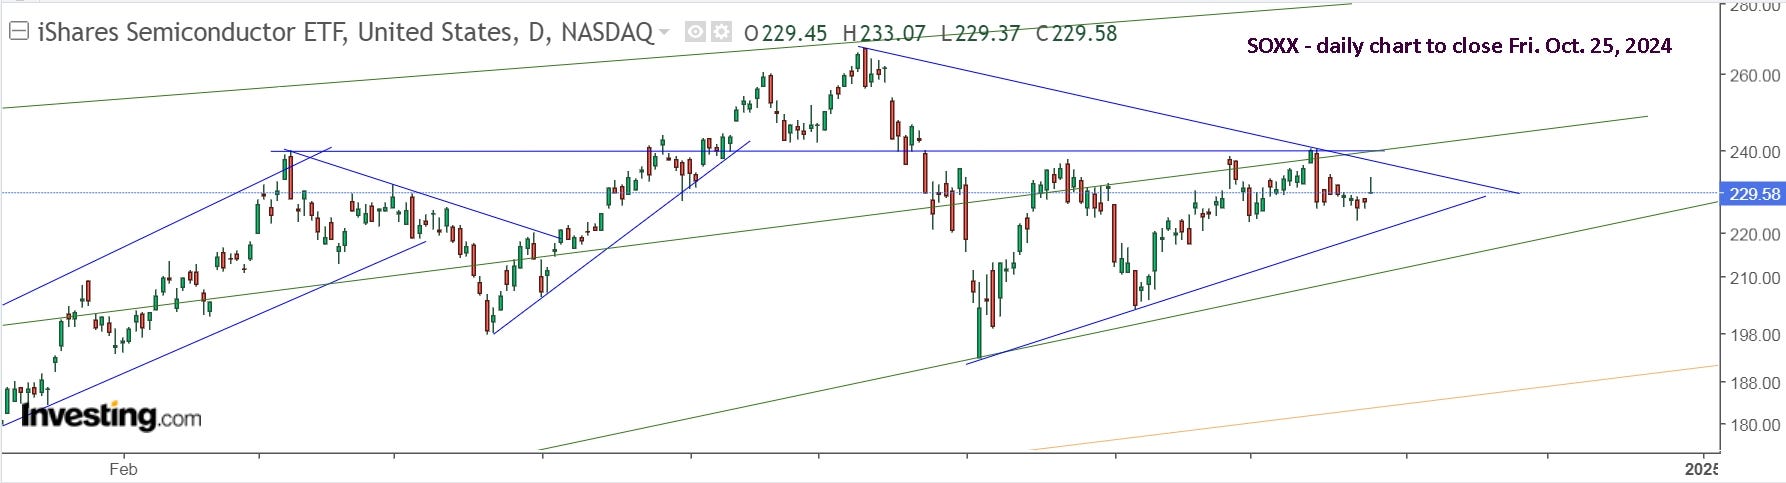
On the flip side, SOXS may be early in an uptrend like March-April and July-Sept.
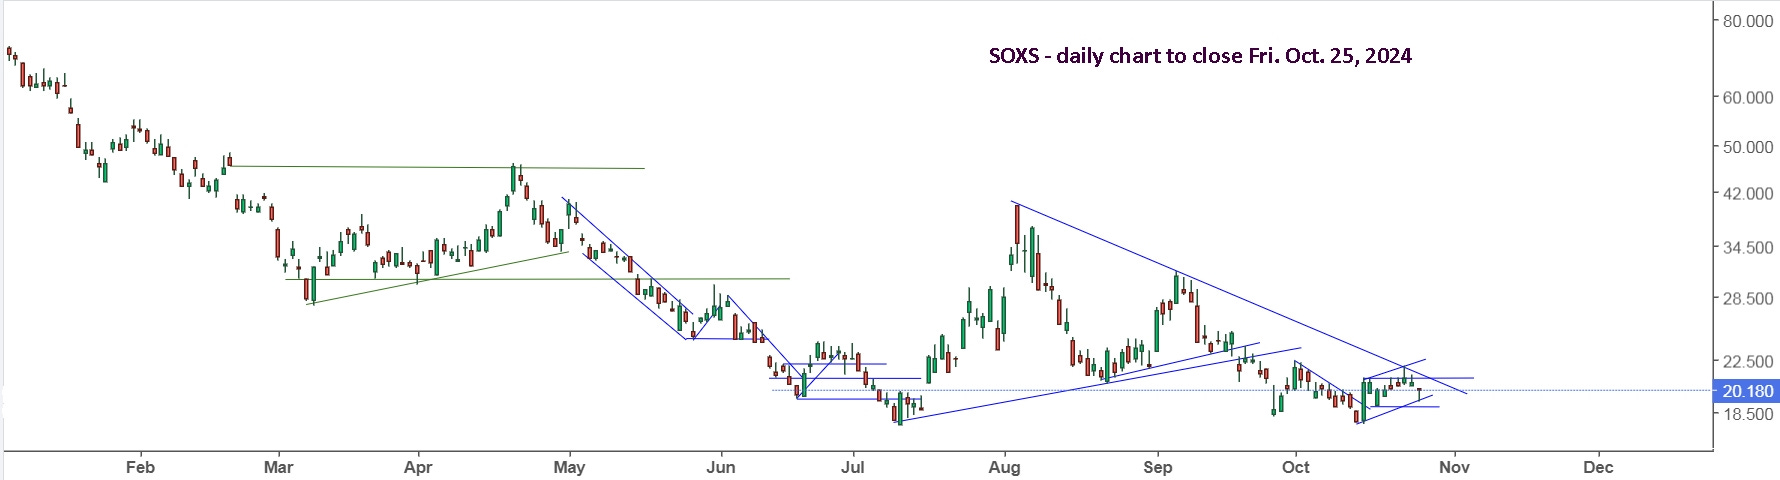
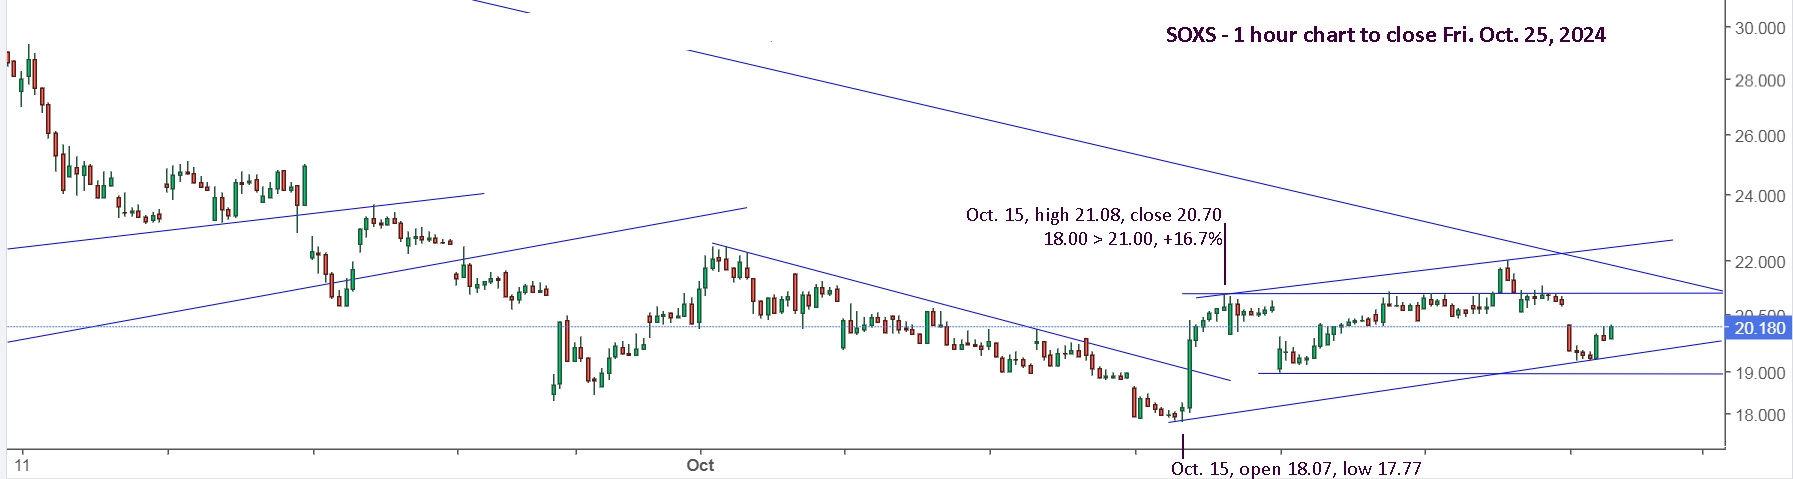
The hourly charts shows how both SOXS and SOXL are approaching the point of a wedge and will break out one way or the other. For me, from this view, SOXS is starting a turn up and SOXL may have lost upward momentum. Either way, SOXL could be a hold from buying Wednesday, Oct. 23 and SOXS could be a hold from buying Friday, Oct. 25. There’s less of a cushion on the SOXS buy, but it also has good gains locked in from buy Oct. 15, and Friday’s buy could be considered a continuation of the trade since Oct. 15.
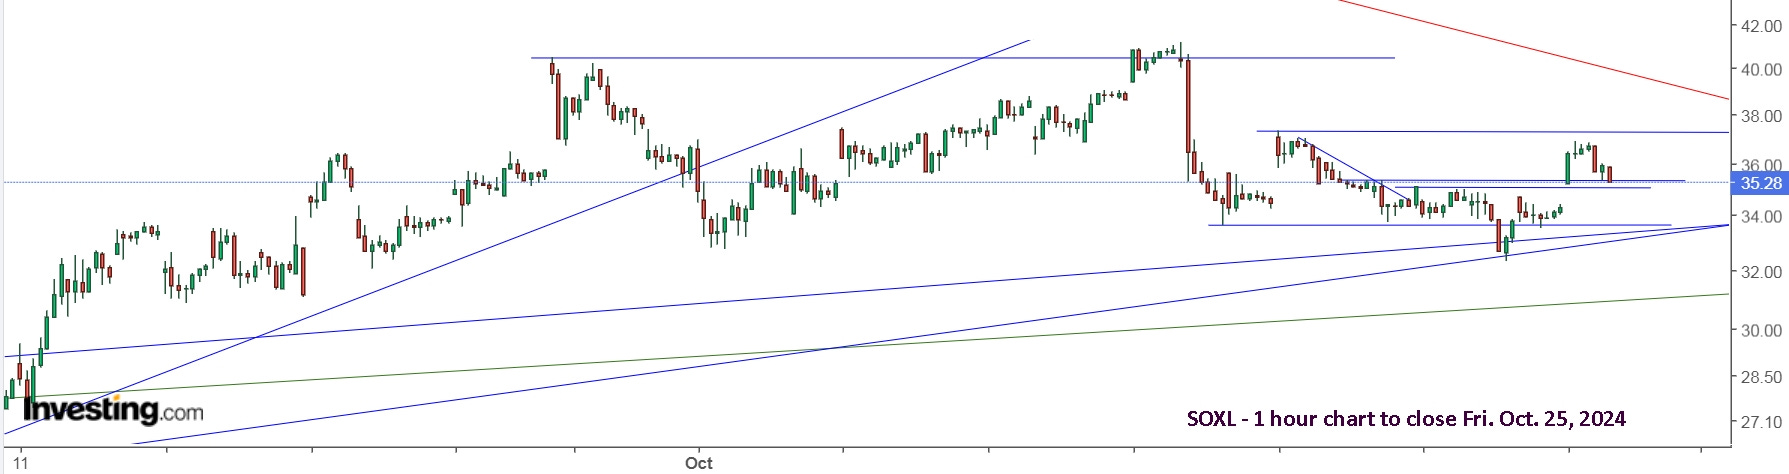
SOXL could be considered a continuation of the trade since Sep. 9, either holding since then, or selling and re-buying for extra gains. Watching from the sidelines is also an excellent choice. My preferred trade at the moment is UVIX which close +13.2% from buying early on Friday. That’s a hold, and buy more if it gaps lower and moves up early.
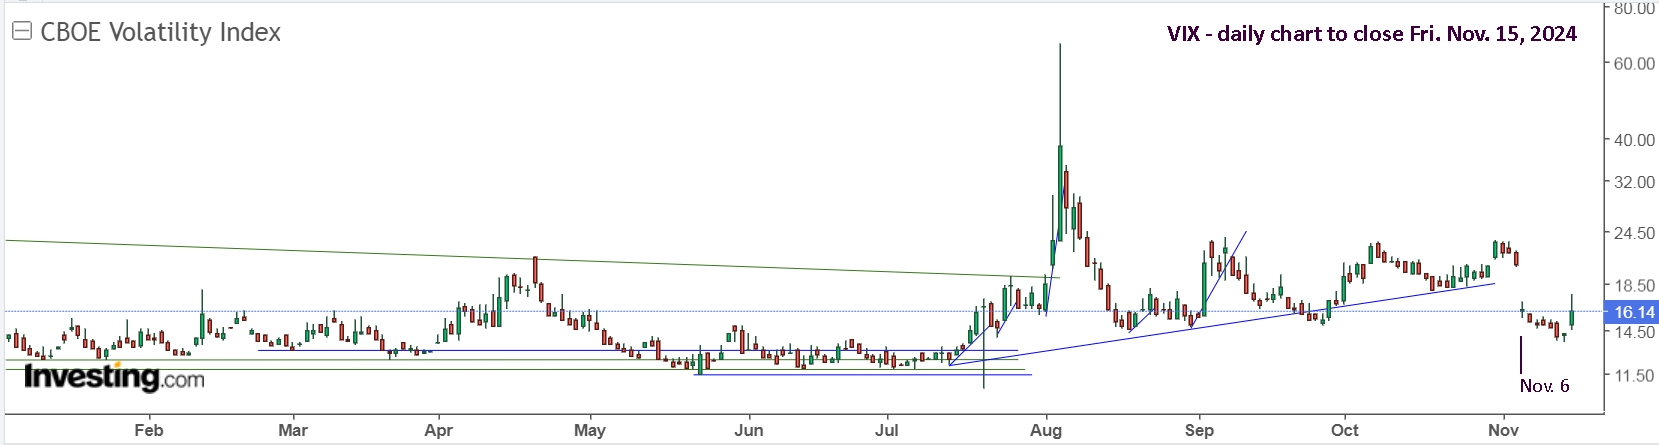
Update to Fri. Nov. 15: We finally know what was holding up volatility as it crashed after the U.S. presidential election.
The markets started up election day, November 5, and gapped way up the next day, followed by further upside on Thursday. Friday, Nov. 8 held about even and it was times to take the win. Monday, Nov. 11 opened up a bit and fell. Early birds went short from the open.
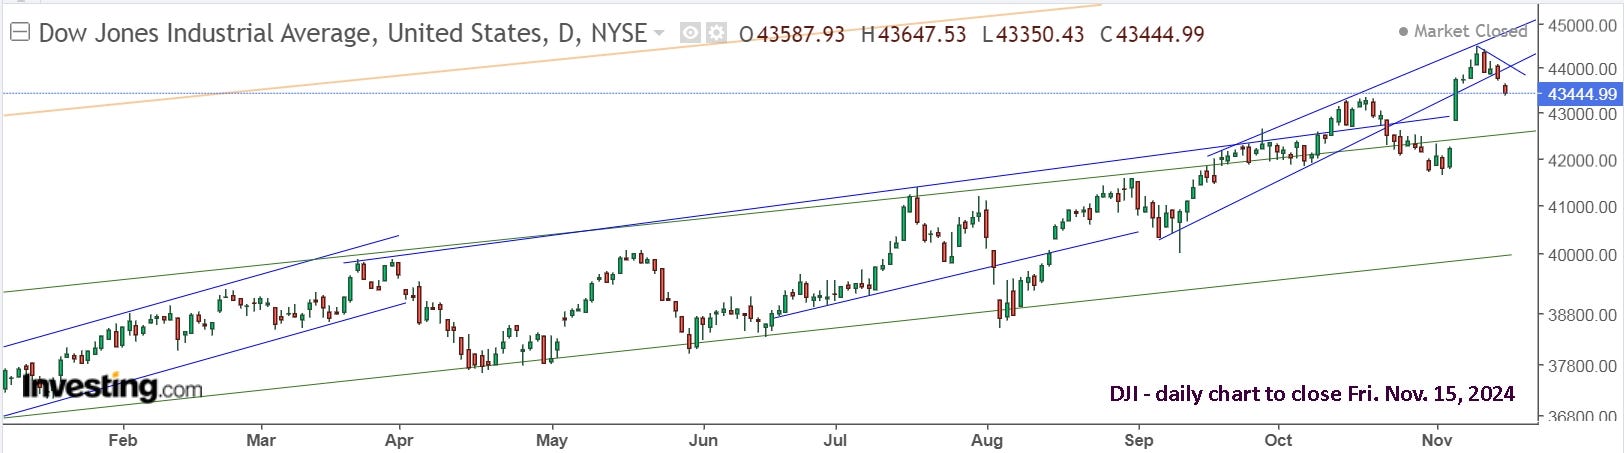
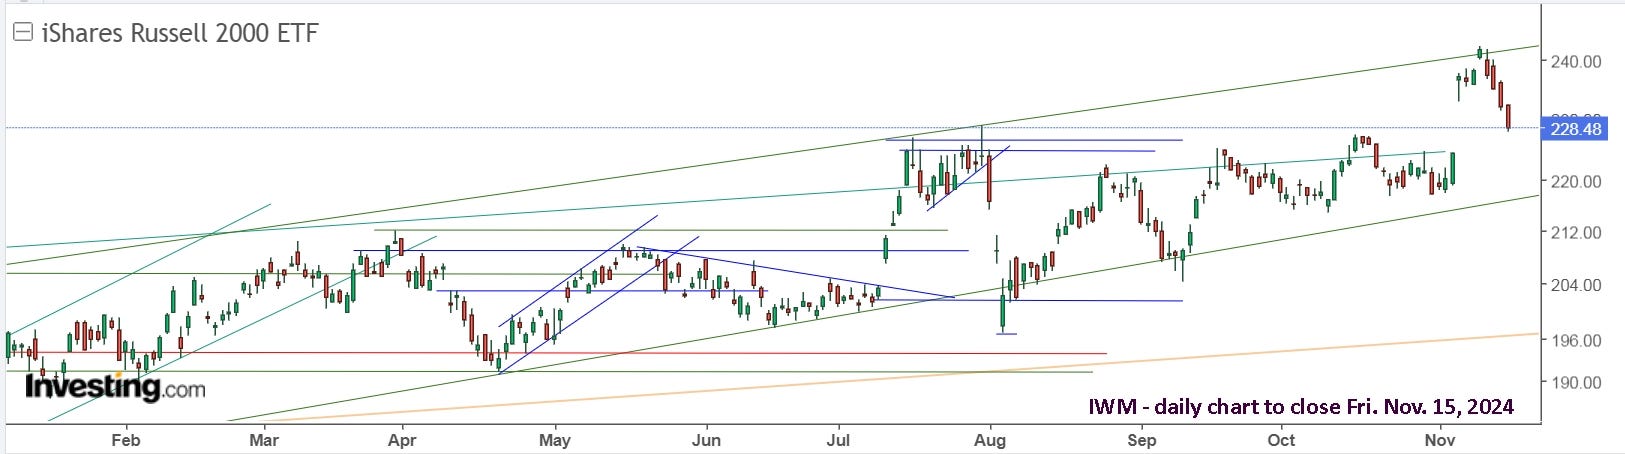
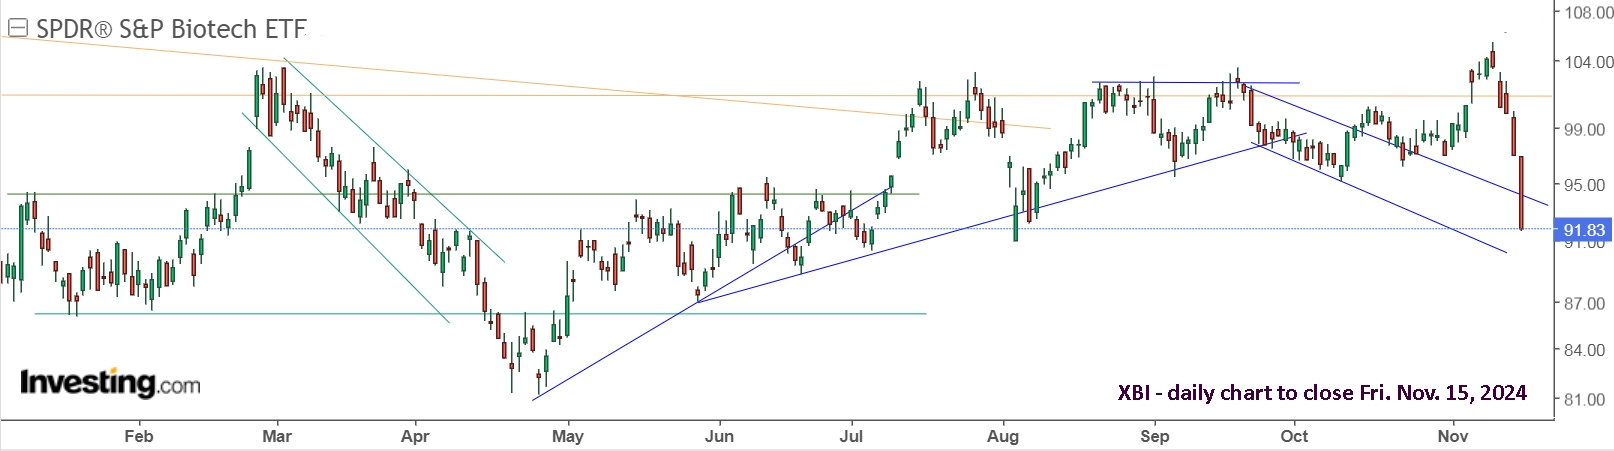
Small caps (IWM) and biotech (XBI) led the way, giving confidence that the bigger markets would follow.
Semiconductors (SOXX) showed signs of life early Thursday, but that quickly faded.
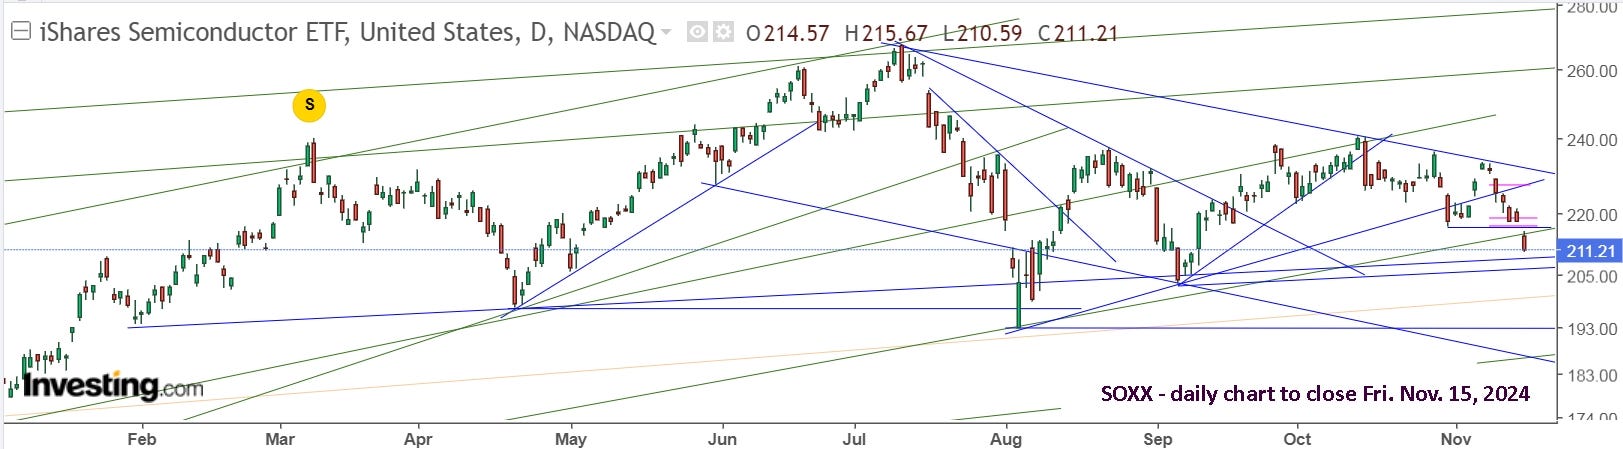
Thursday was finally the day when SPY and QQQ showed they were likely to follow the others lower, and not pull the others up. Everyone who went short Thursday and held were nicely rewarded Friday at the open, and the key was to then ADD to your shorts. One may have sold some Friday afternoon, locking in gains, but there was no reason to be looking long.
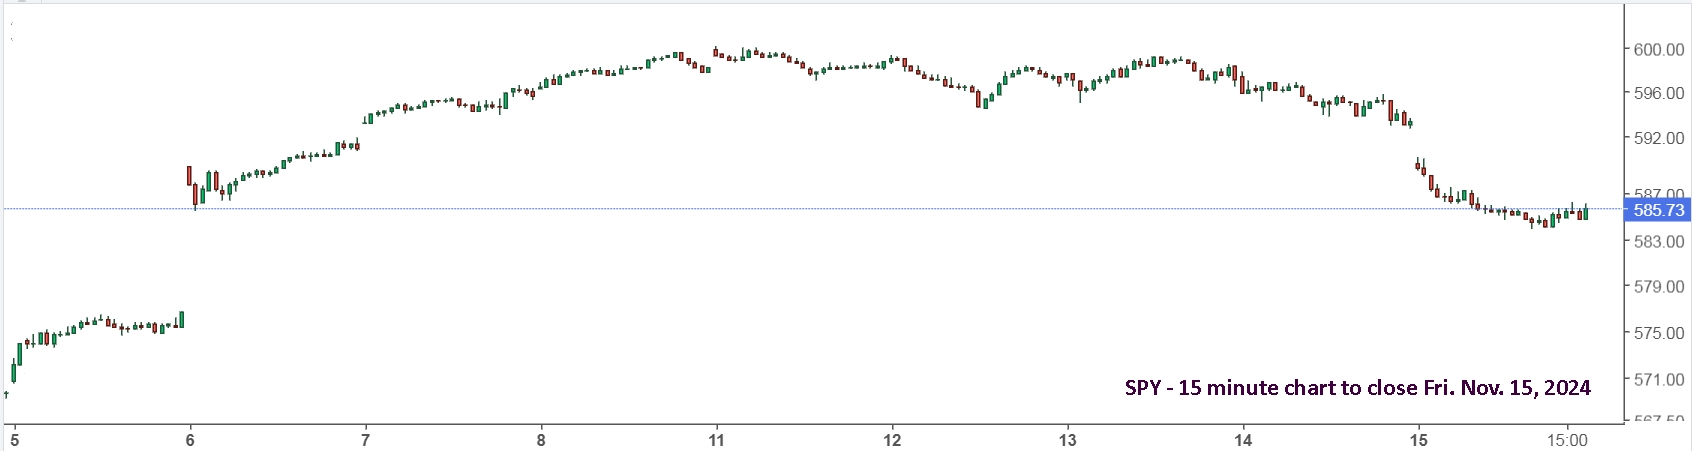
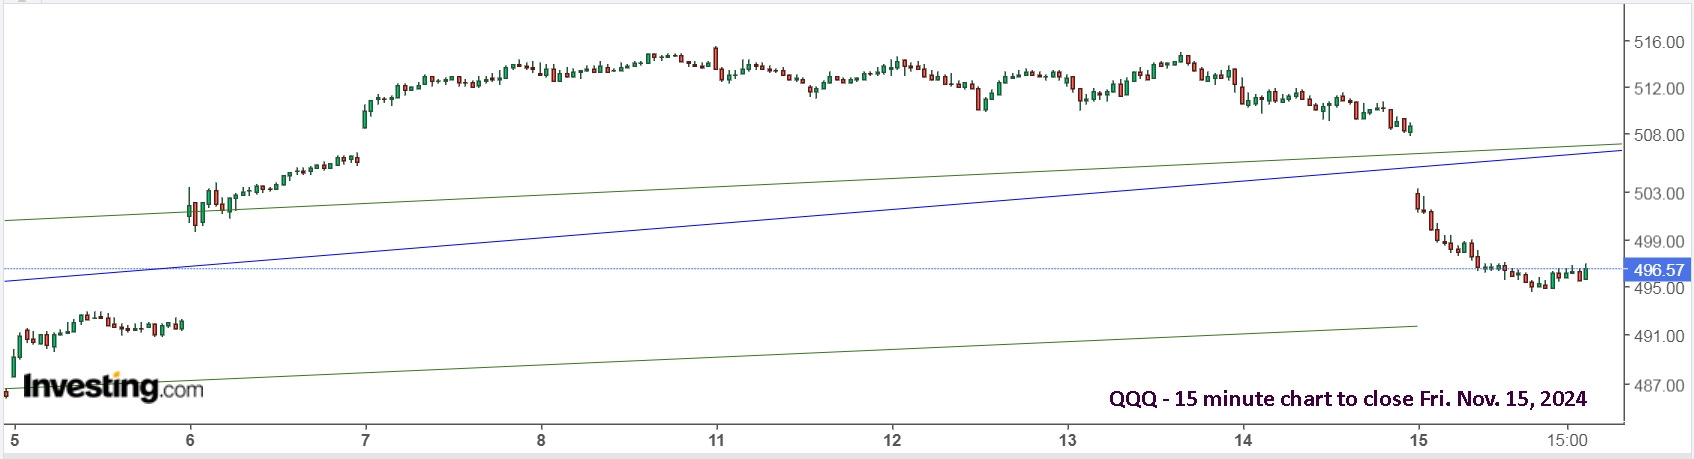
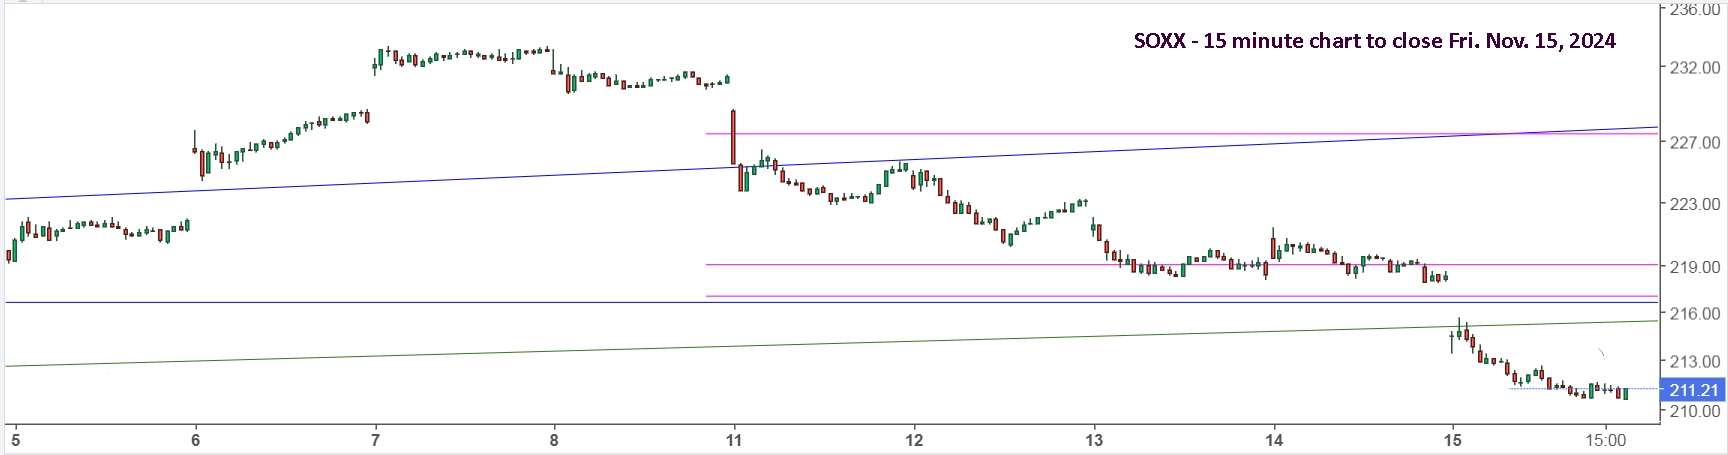
The purple horizontal lines are target support lines that Sandimas had after Friday, Nov. 8 and I wanted to have them as a reference for the week. Wednesday and Thursday had potential, but without a move higher on the day, I maintained my short position with SOXS. Here’s how it and the other shorts did last week.
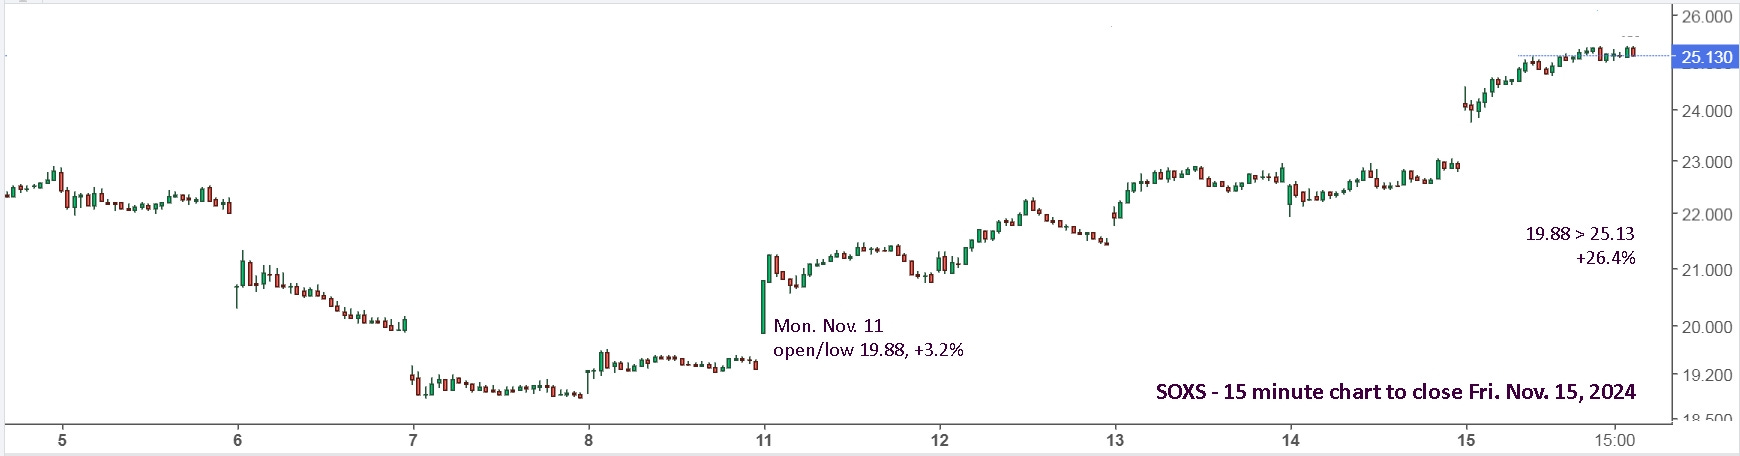

I found it a bit confusing with some sectors moving earlier than others, but that also provided a heads up to get short SQQQ and UVXY while the price was still low.
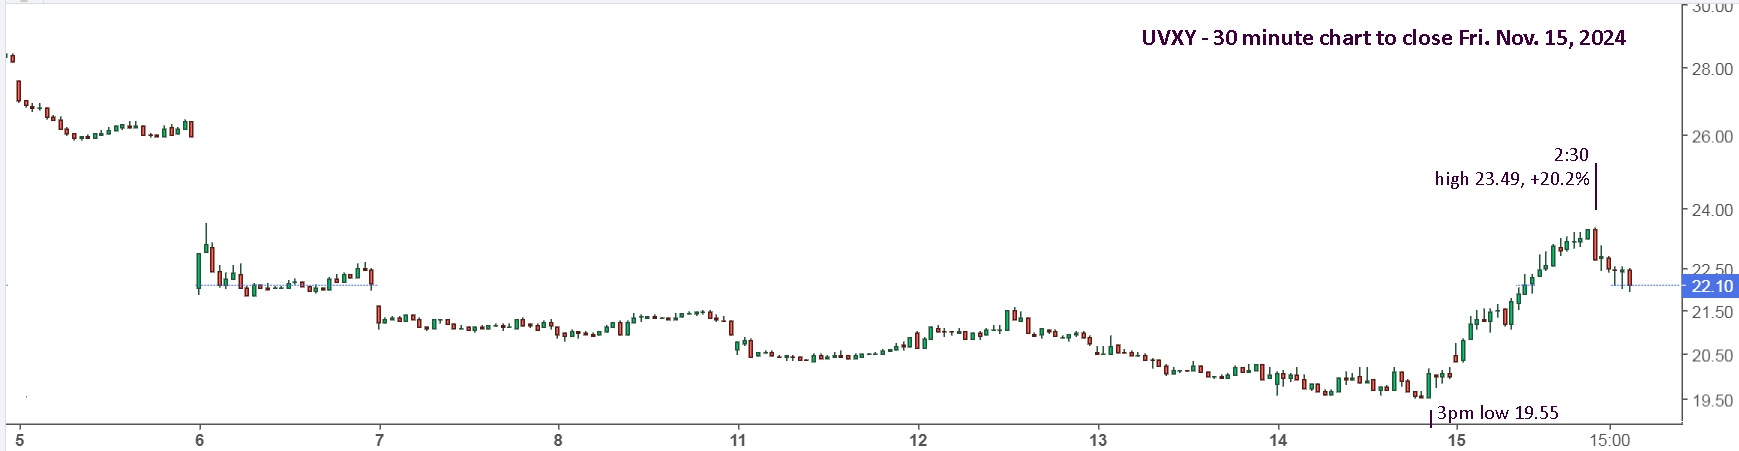
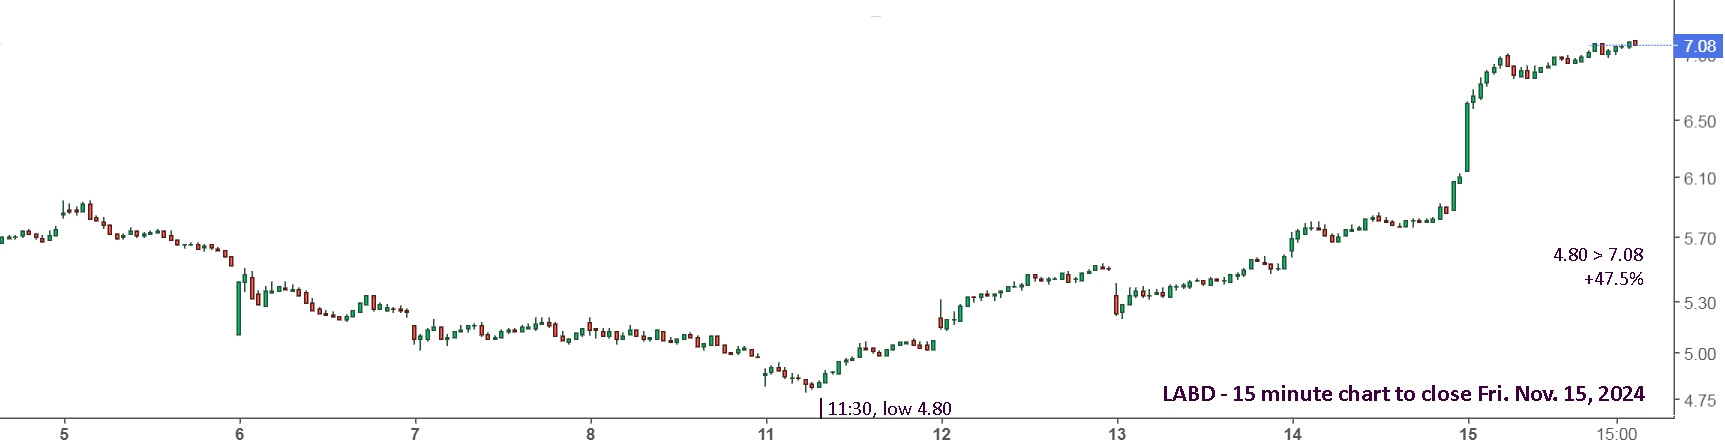
The easiest trade was UVXY and it might be a winning pick for next week. LABD made a monster move of 47% and is mostly like about done. SQQQ might have a lot left in the tank, but SOXS might continue to provide bigger moves. On the other hand, the short move could end Monday with an early reversal from a gap lower in the markets. Be ready for all possibilities.
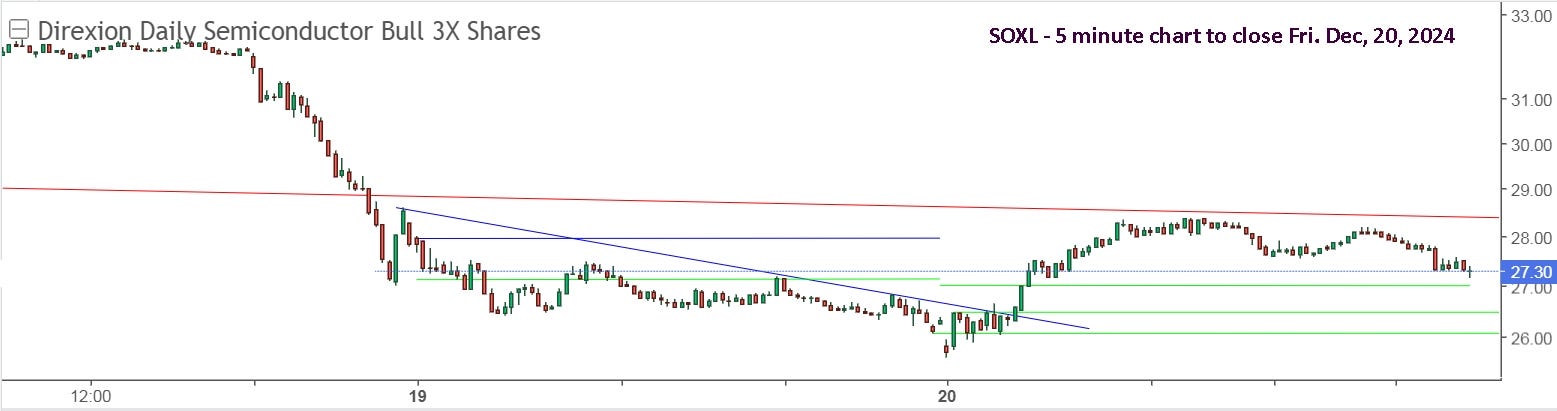
Update to Fri. Nov. 22: Last week, I made some adjustments, in an attempt to reduce the number of trades and help me maintain perspective on what was happening. I tend to watch the 5 minute chart which causes me to lose perspective. I hoped that drawing trendlines, early for the week, would help me maintain better perspective. Doing a mini review mid-day Monday, and/or that evening, could also help keep me looking in the right direction for the week. Here’s a look at SOXL.
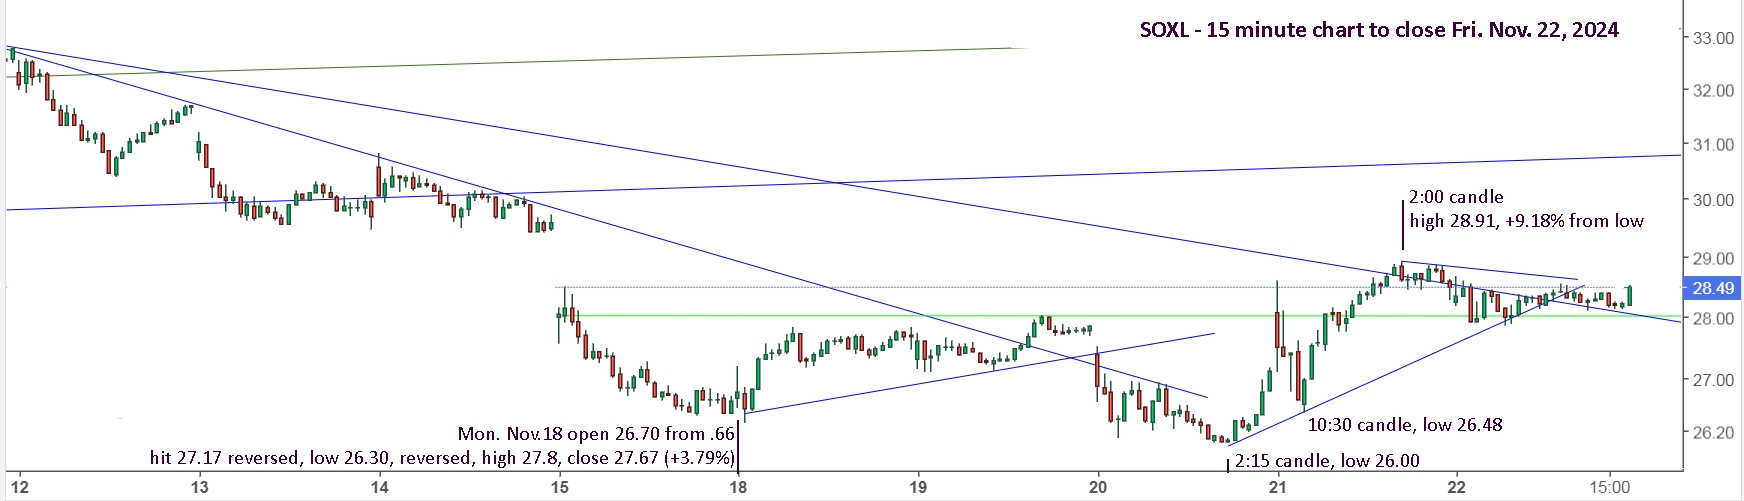
On Monday, SOXL opened 26.70 from .66, hit .55 and shot up to 27.19 in the first 10 minutes. I bought the reversal quickly and set a stop sell at 26.49, just below the early low. If it had moved higher, I would have moved my stop sell to breakeven. It then dropped hard for 15 minutes to 26.31 (-3.24%), stopping me out, then it reversed and stopped me back in at 26.61 (+0.5% from my stop sell). That got me in for the day. It hit 27.83 at 11:40, +4.6% from my buy price and the best option is to continue doing nothing. It fell hard at 11:45, and watching the 5 minute chart could have had me selling, which is the over reaction and over trading I want to avoid. It hit 27.18 (-2.34%) at 12:10, then moved up again. Tuesday provided lows for a new support trendline and when it gapped lower and fell on Wednesday, breaking support, I sold. When it hit Monday’s low of 26.31 and held, it was tempting to buy, but too early. When it spiked lower at 10:20 to 26.07 and pushed up, hitting 26.42 the next candle, then it made sense to put in a stop buy at 26.51 or 26.61, the same price I bought on Monday.
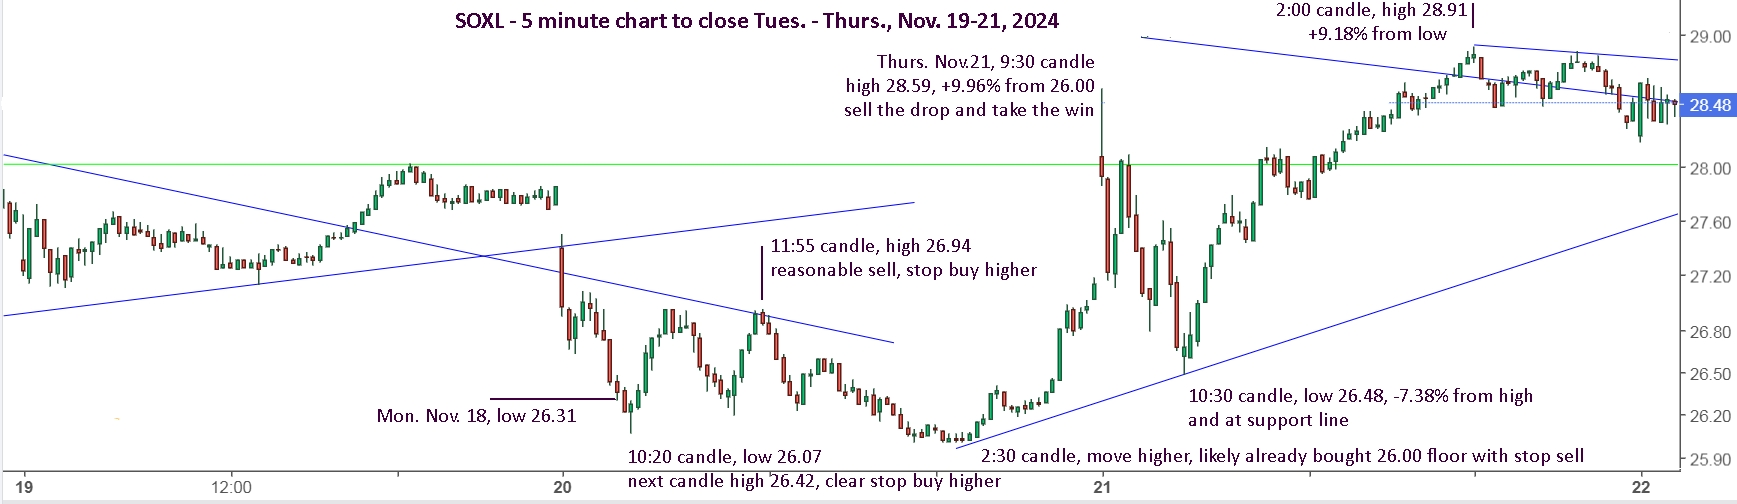
Selling the first rally top at 26.95, with it near resistance and a lower low from the early rally, was reasonable, especially if you were also looking short and trading SOXS. The second rally, topping out at 26.94 is a definite sell in my books, with a stop buy at 27.01 or .11 or .21 or wherever you like. Buying SOXS also made sense. Once it had held 26.00 for 20 minutes, it was time to buy again, especially if you had already sold SOXS for a win.
The gap up on Thursday, Nov. 21 was a gift as it fell hard, stopping you out to lock in a 9% gain from buying the floor on Wednesday. The hard reversals every 10 minutes would have typically had me over trading and getting whiplashed. This time I waited and watched. When it was down to a possible new rising trendline at 10:30, and back under my buy prices Monday and Wednesday, it was a no brainer to buy again. Later, with it over downtrend resistance and up 9%, it made sense to sell, lock in the win and wait for the next clear opportunity to present itself.
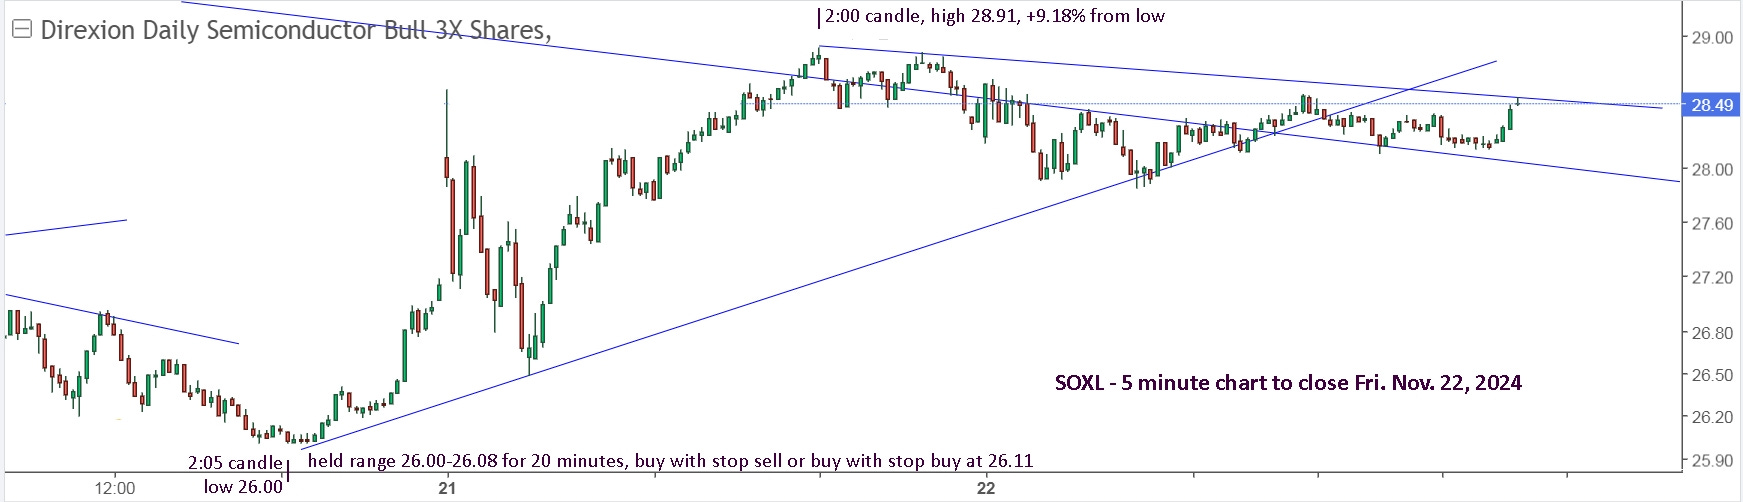
The next opportunity appeared at 11:35 on Friday, as it moved up from holding the support line for 15 minutes. Once it was up to downtrend resistance and holding, move your stop sell up to breakeven and you’re done for the week. For minimum trading, you bought after the early low Monday, sold Wednesday for a small gain and re-bought later on Wednesday. For more active trading, you stopped out for a small loss early Monday, stopped out for a small gain on Wednesday, then bagged two 9% trade gains and bought back in lower on Friday morning.

I decided to stay on the sidelines late Friday, after getting stopped out at 28.19. If one was bullish, it would make sense to continue holding, in case it gaps higher on Monday. If it gaps lower, it’s a chance to buy more cheaper and sell all if it drops. The same strategy should actually be taken if it gaps higher: buy more and sell all if it drops. I have a tendency to lose focus when holding shares that are suddenly in profit or underwater. I get afraid of losing more money or worried about losing the profit. The key is to trade the early action exactly the same, regardless if you’re holding shares or not.
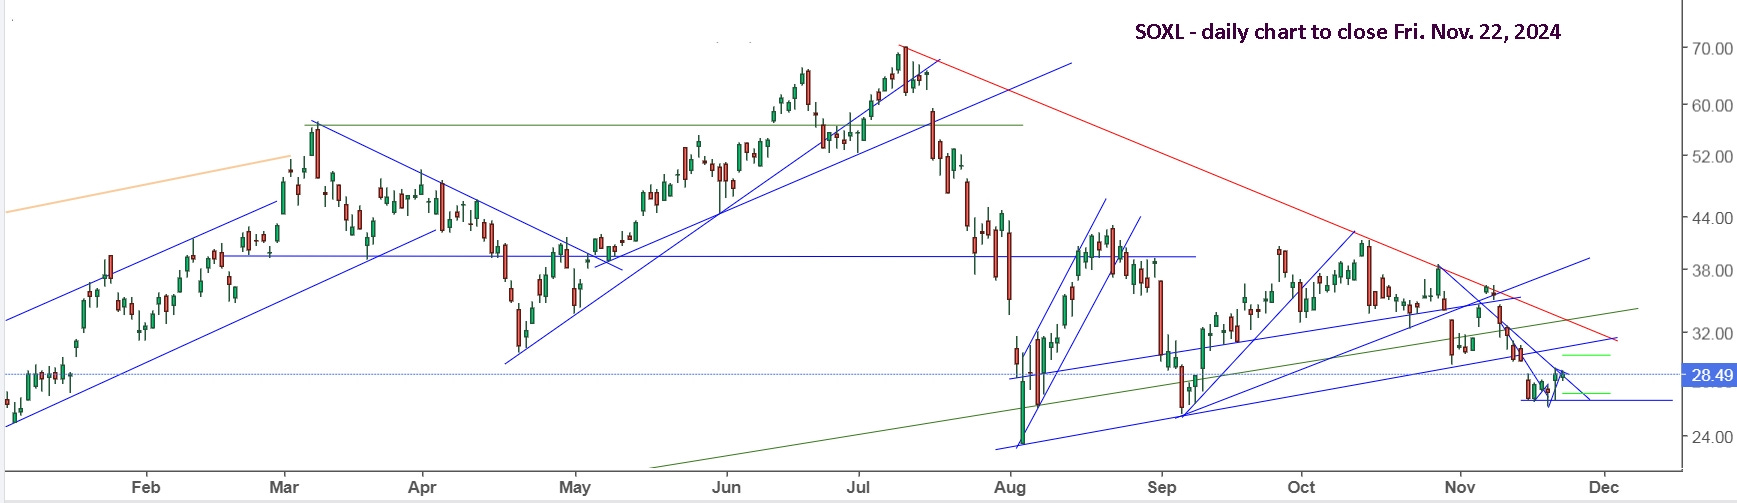
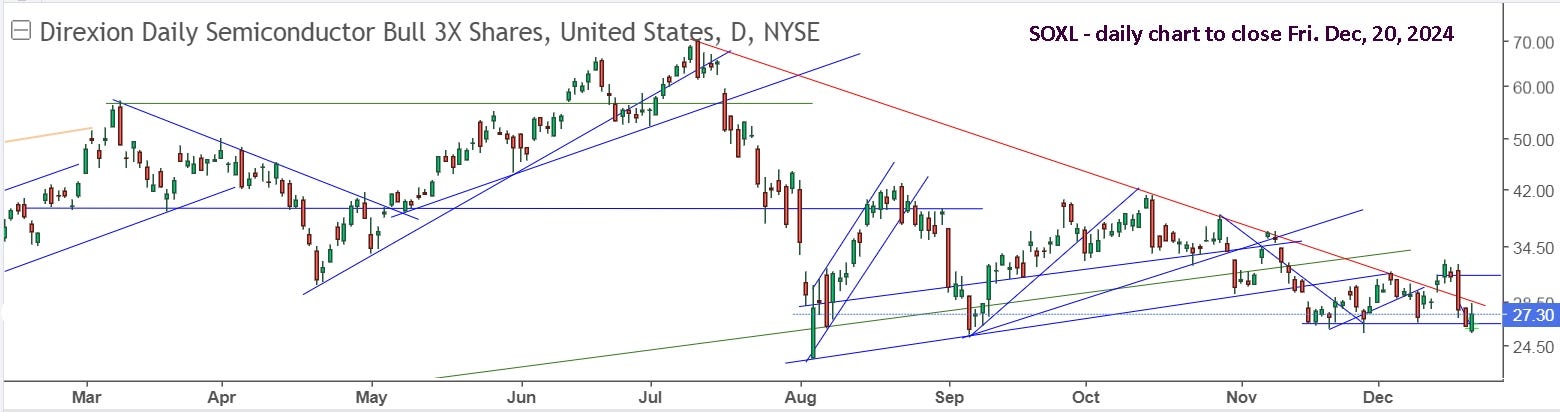
The daily view shows a possible floor, but a lot of downtrend resistance to break through before establishing a new bullish trend. I’ve drawn my +/-5% horizontal green lines again from Friday’s close and will see if my actual trades next week can match the potential. Have a great weekend!
Update to Mon. Dec. 9: In my last update, Fri. Nov. 22, I decided to try a few adjustments to reduce my number of trades with SOXL/S. Generally, it has worked out well.
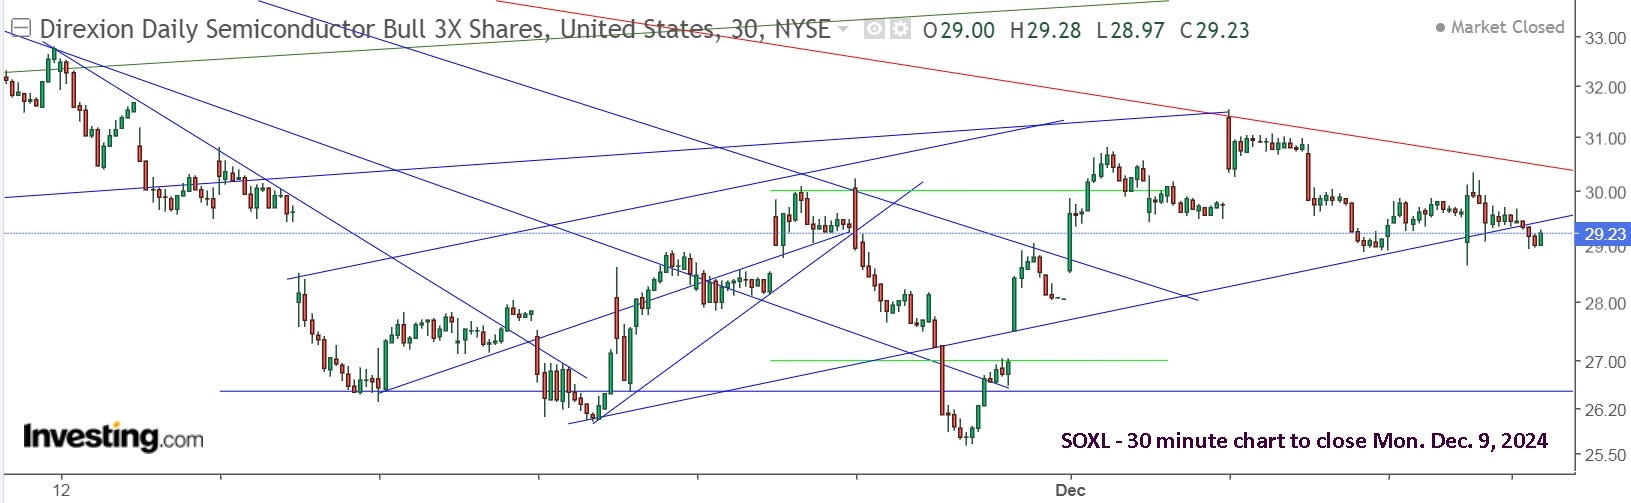
I decided not to hold from Friday and was ready to buy either direction today. SOXL opened lower, fell for 5 minutes, then reversed, so I bought with a tight stop sell just below the low, then sold at 30.05, down from .11 for +4.7% and put in a stop buy at 30.21. I wasn’t trusting the sharp move up. I was then stopped back in and then out at 30.19, and then able to stay out the rest of the day.
Today's action brought an image to mind of the floppy air guy. It stays up and flops around, so long as the fan is pumping in air. Once the fan shuts off, it'll drop to the ground. It’s all quite ridiculous, but it’s also reality, so it’s best to accept it and try to benefit from it.
“These days, algorithmic trading accounts for approximately 60- to 75% of total trading volume in the U.S. stock market. That means most trades are automatic, executed by bots adhering to pre-set parameters. And, unlike humans, robots don’t really ask why. They just do what they are programmed to. As a result, we get wild swings in the market – both up and down. The algorithms drive momentum one way or the other, and the market follows.”
I also believe that ‘big bots’ can be set to ‘attack mode’, to intentionally push markets around. How else can you account for large gap moves which reverse minutes after the open, and other times shoot higher for 30 minutes or more?
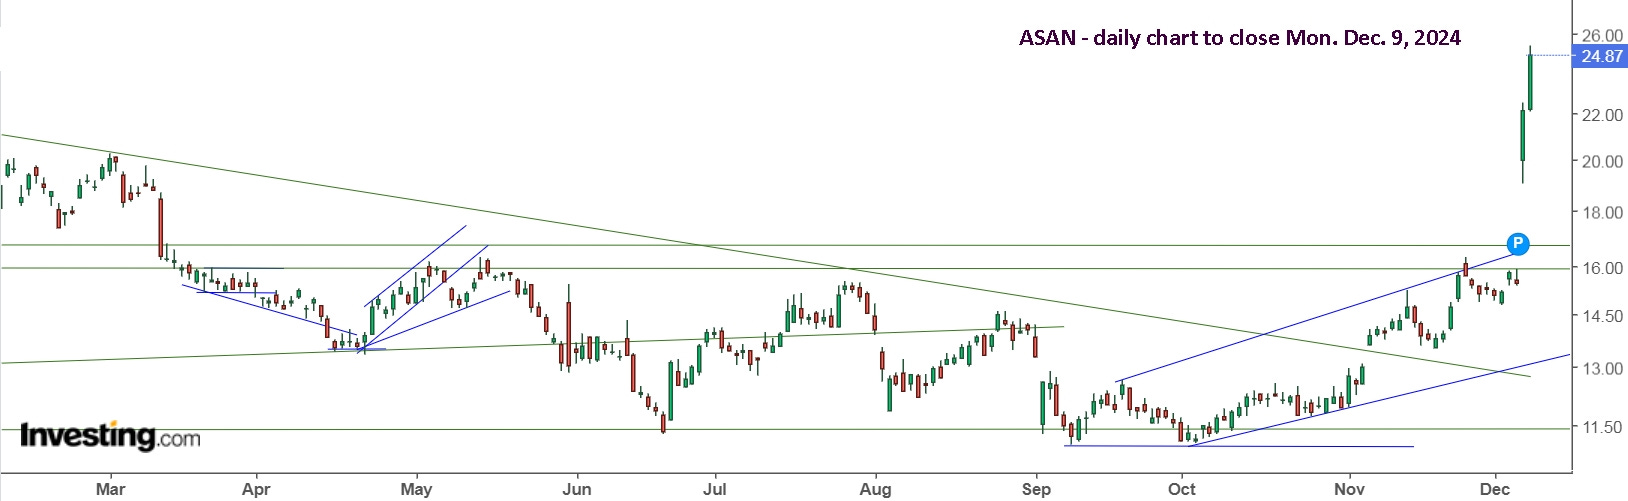
On Friday, and again today, ASAN was goosed higher. From the gap up Friday, the move was completed in less than 20 minutes, and was mostly flat the rest of the day. Today, the push was on hard from just over 25 minutes and it coasted flat the rest of the day. It’s now up a ridiculous 68% from Tuesday, Dec. 2 where you may or may not have re-bought. I didn’t, unfortunately.
Earnings after hours are always an excuse for a ridiculous push. Today it was Oracle’s turn.
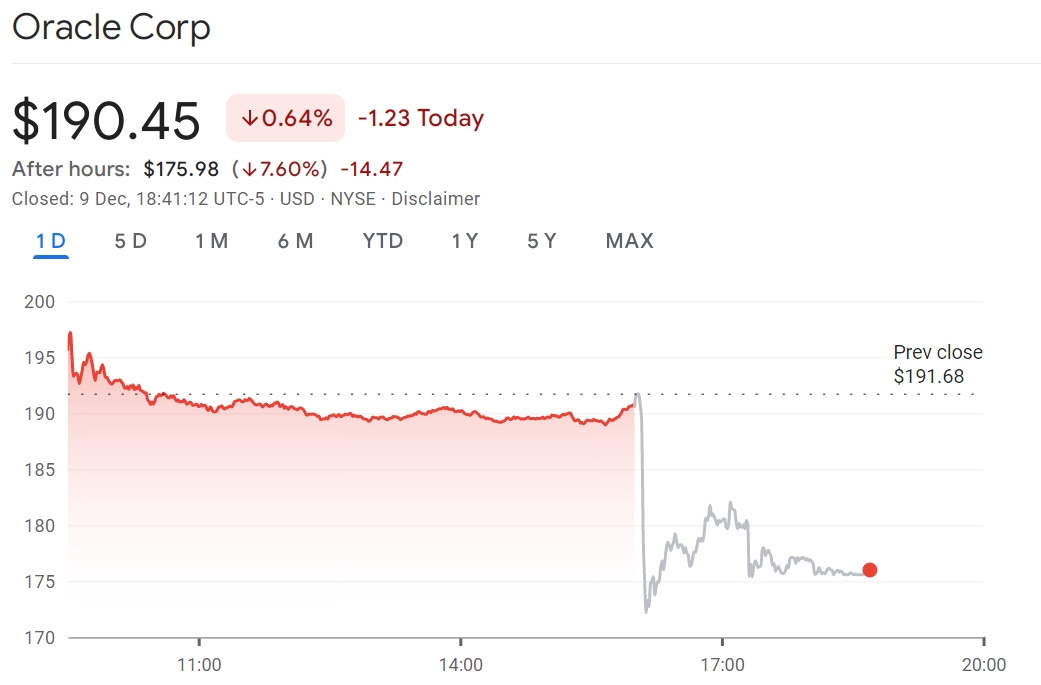
From the sudden drop, you’d think the earnings were terrible. “Oracle (NYSE:ORCL) shares fell 6% in late trading on Monday after the IT giant reported fiscal second-quarter results that were slightly below expectations, disappointing investors who had hoped for more. For the period ending November 30, the Safra Catz-led company earned an adjusted $1.47 per share as revenue rose 8.6% year-over-year to come in at $14.1B. Analysts expected the company to earn an adjusted $1.48 per share on $14.12B in revenue.” Are you kidding me?!? They missed estimates by a penny and the stock drops like a rock?
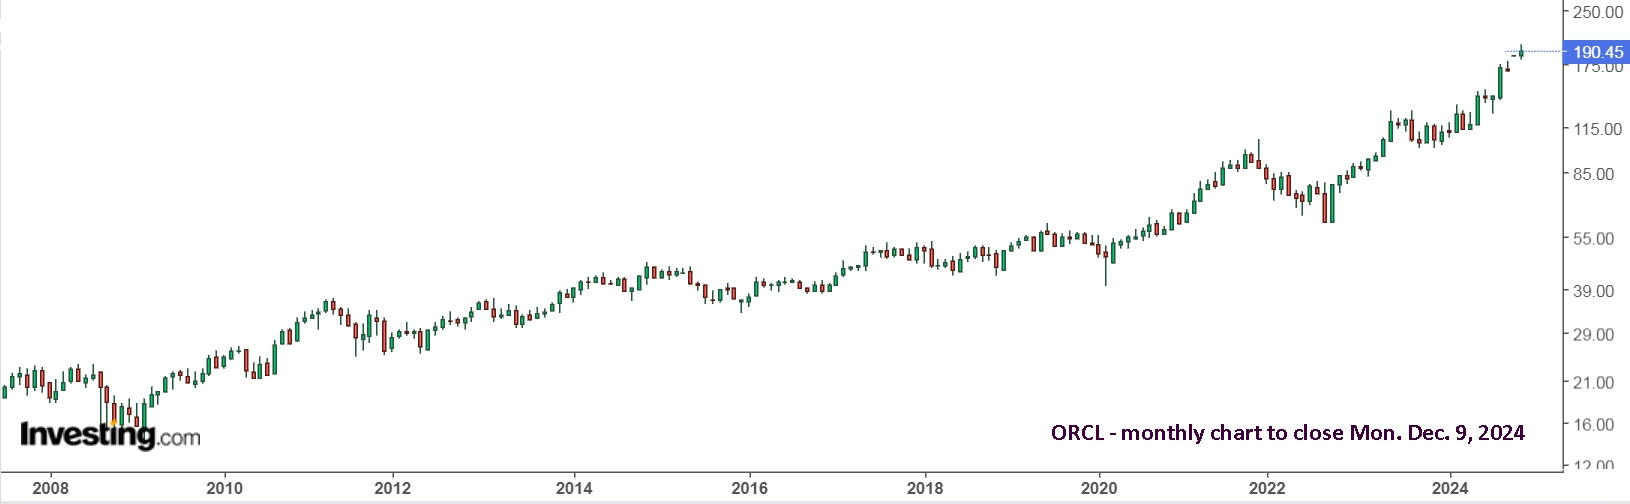
And, of course, the stock price was pushed up Friday, gapped higher today and hit a new all time high of 198.17 in the first seconds. Literally seconds, but maybe 1 or 2 minutes, but the first 5 minute candle was sharply red. It rebounded up for 10 minutes, giving you time to exit. Or, you completely ignored it all. Here’s a monthly view.
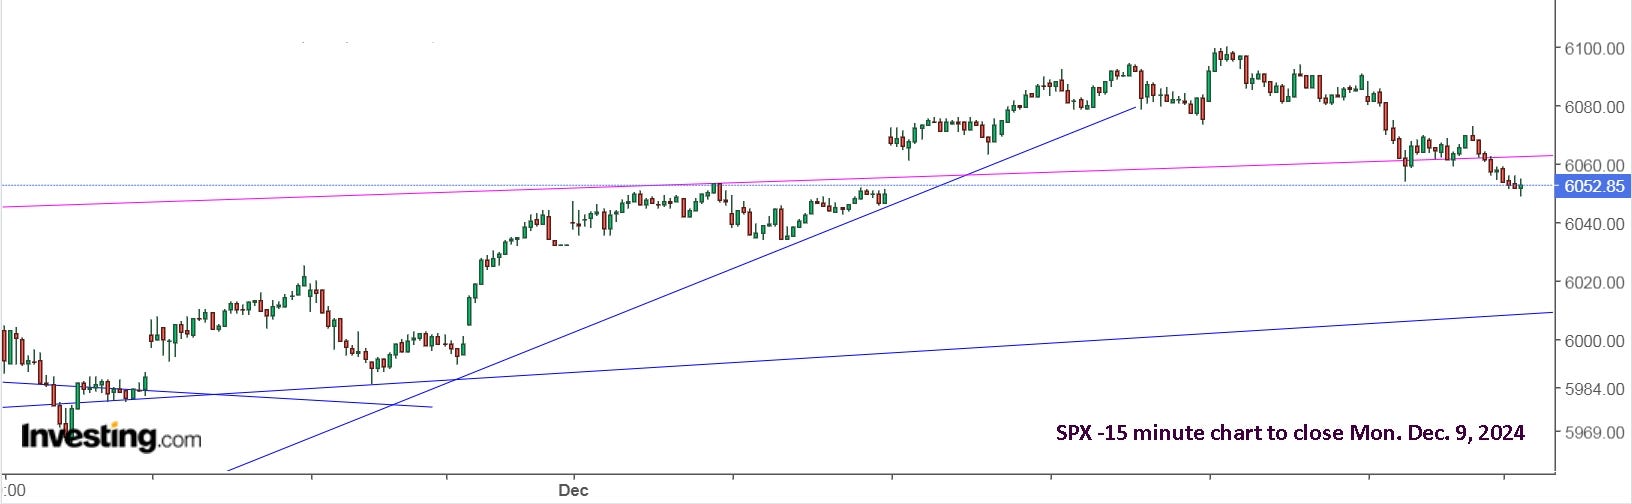
I went short a few things today and traded UVXY. The S&P 500 may have put in its top. It all depends on where the ‘big algos’ decide to push it.
Update to Fri. Dec. 13: In contrast to Oracle, Broadcom gapped higher after its earnings report after hours on Thursday. Friday was even higher to open and pushed higher on the day. It has room to go higher before hitting resistance, and a monthly view suggests that it could run out gas then.
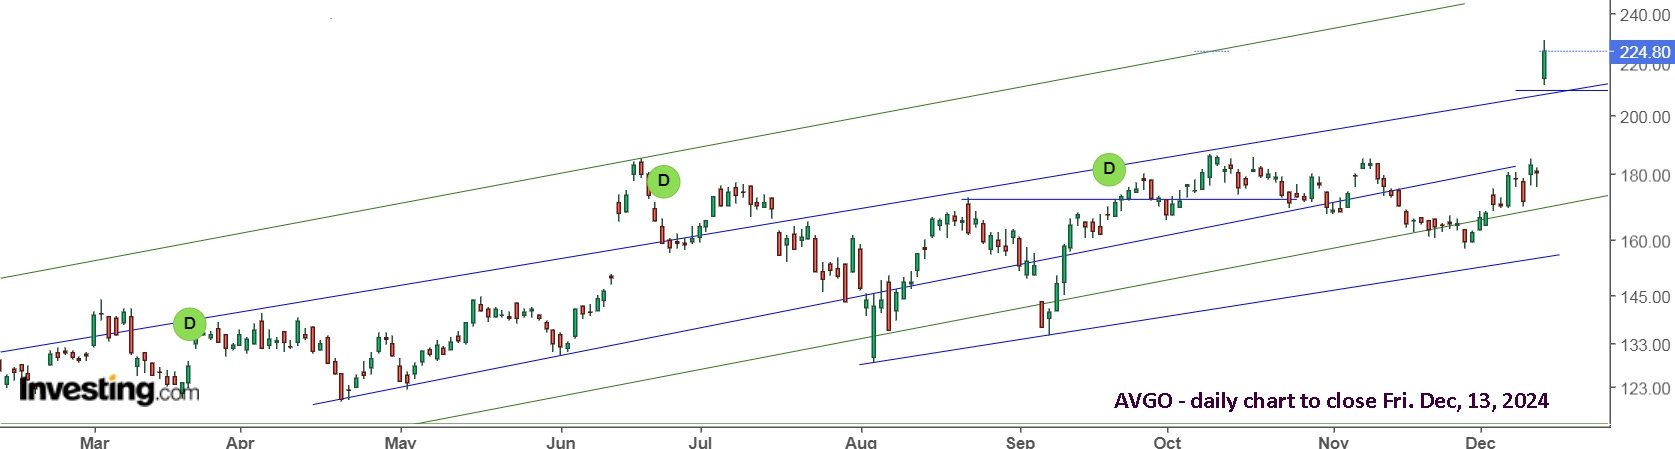
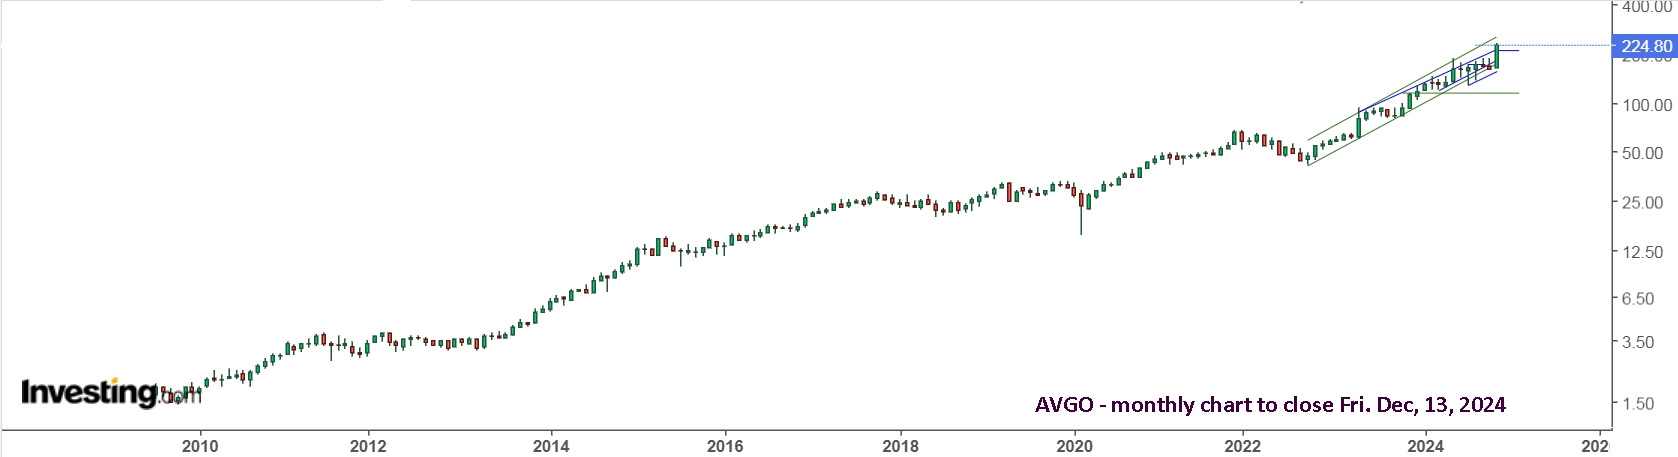
As you can see, it tends to move in spurts, for upwards of a year, then move mostly sideways. I’d continue holding for now, but would be ready to exit at any time.
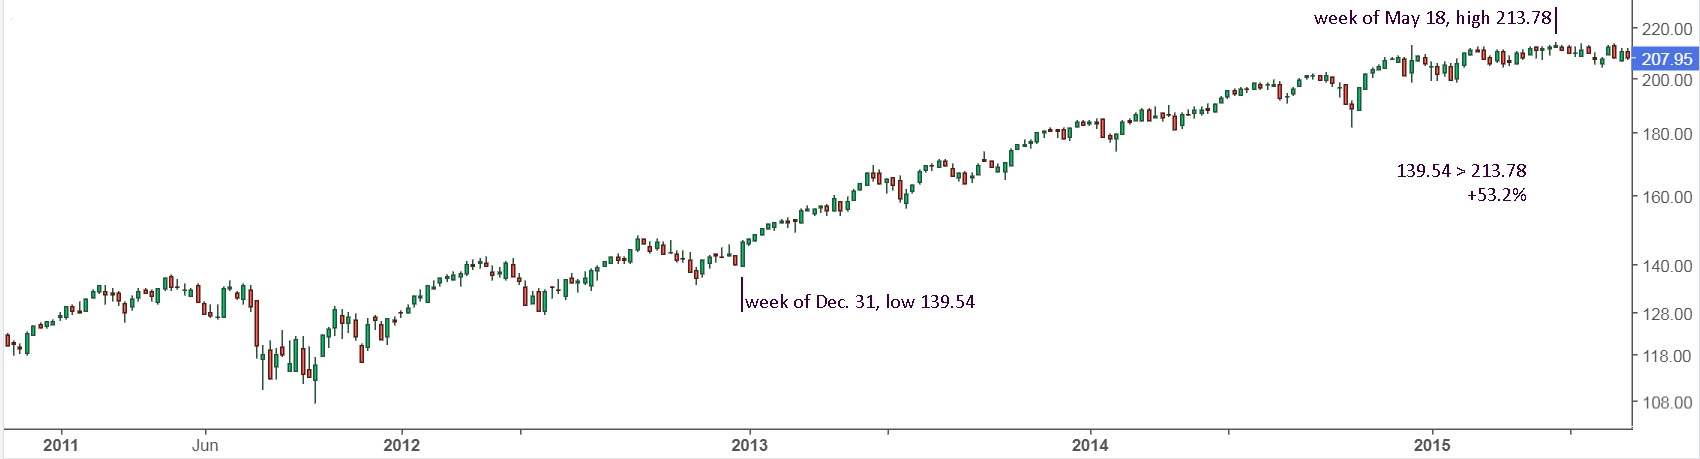
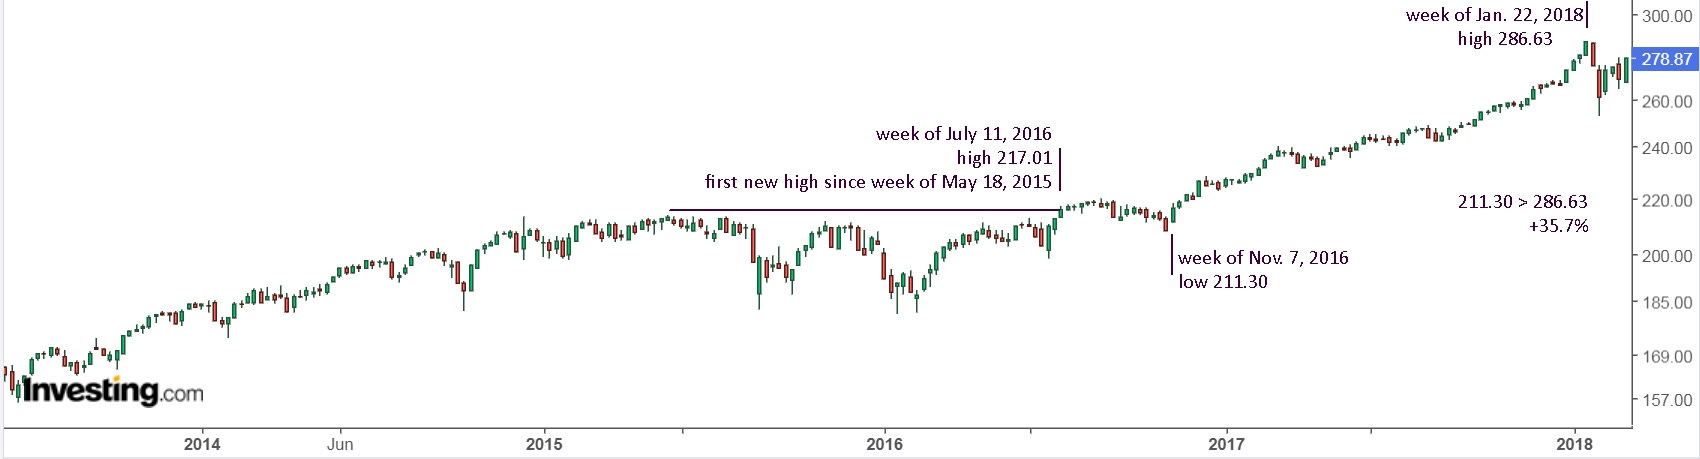
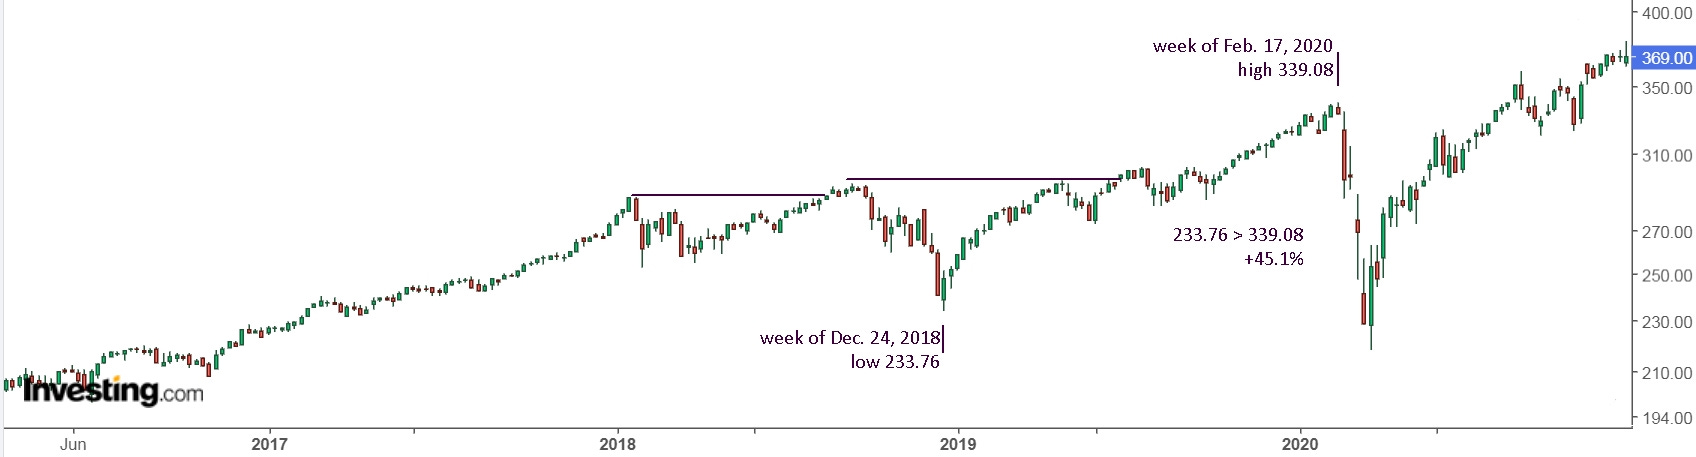
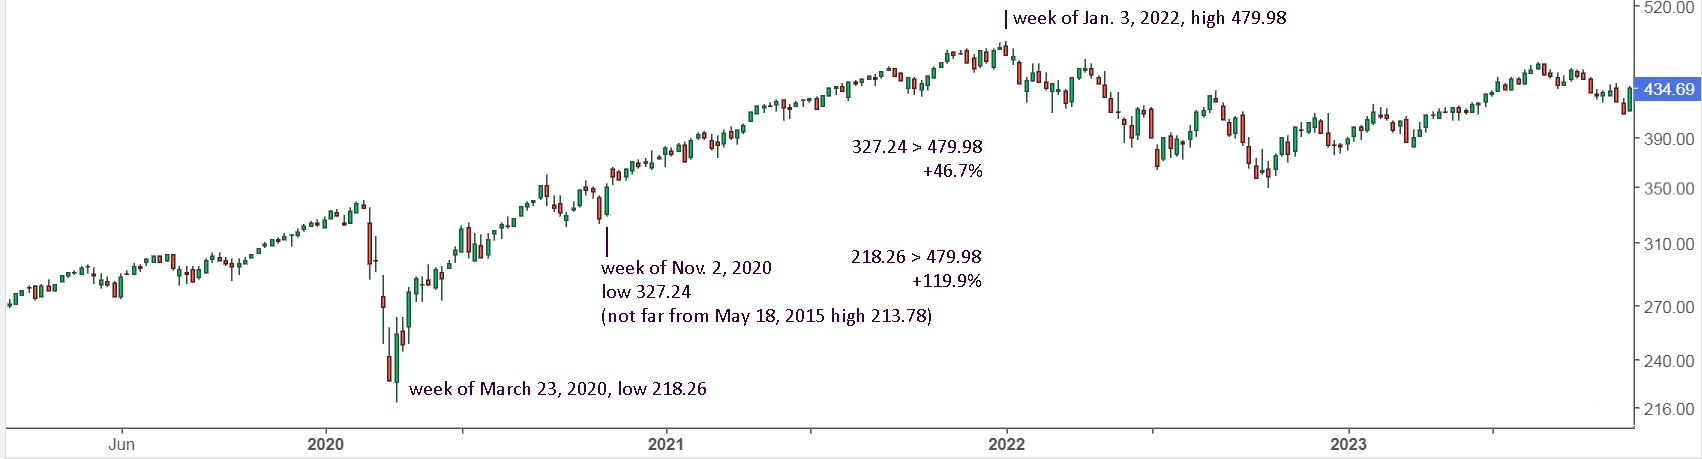
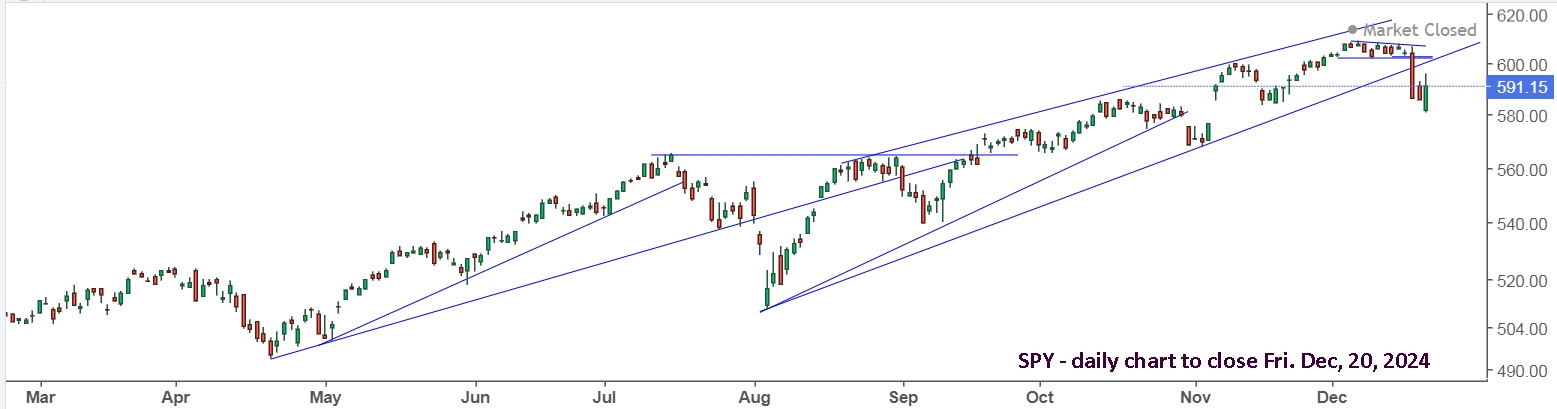
SPY also shows a tendency to move in spurts, for upwards of a year, then move mostly sideways. Here’s a look at it now and back in time. The monthly view shows no sign of weakness yet.
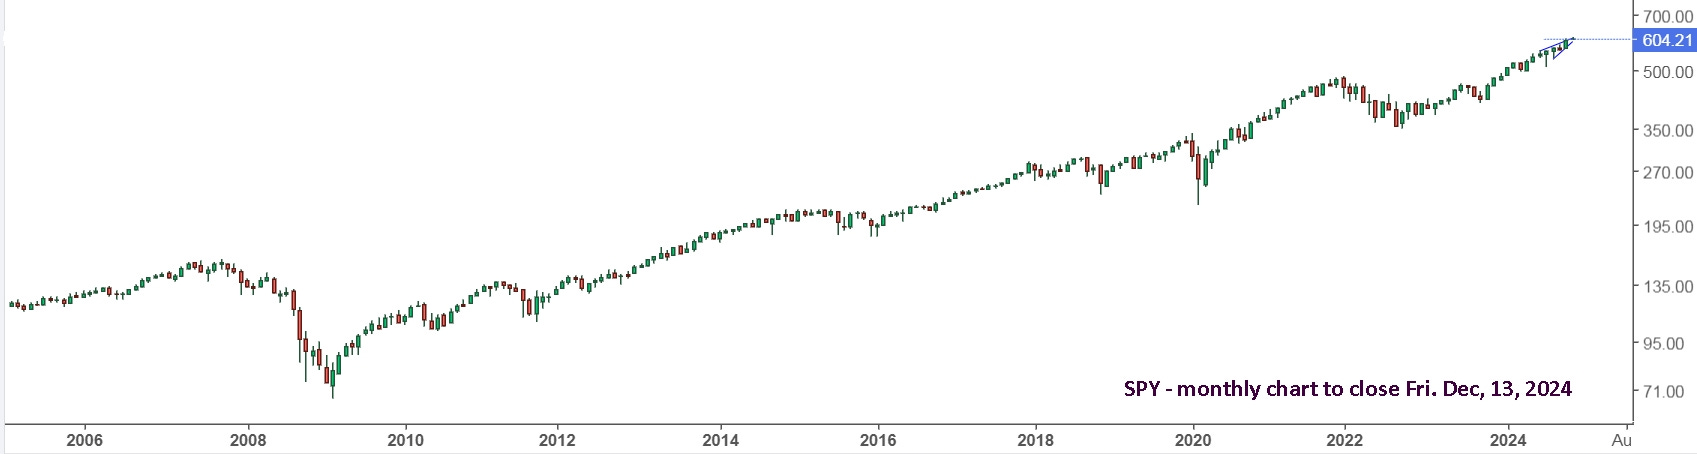

The weekly view shows a significant move of +45.6% since the Oct. 30, 2023 low. That’s a lot, and a look back in time suggests there’s not a lot of upside left in the tank.
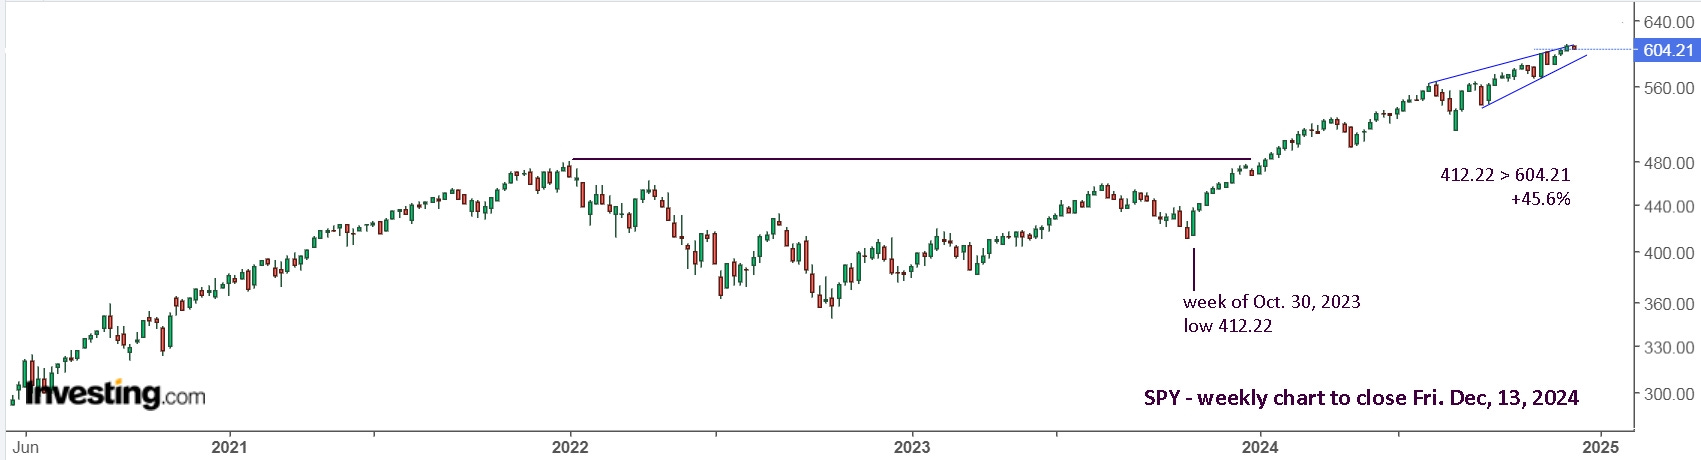
Here’s a daily view. The lines are very clear. A break of support would be significant and moving to the sidelines already was likely a wise decision.
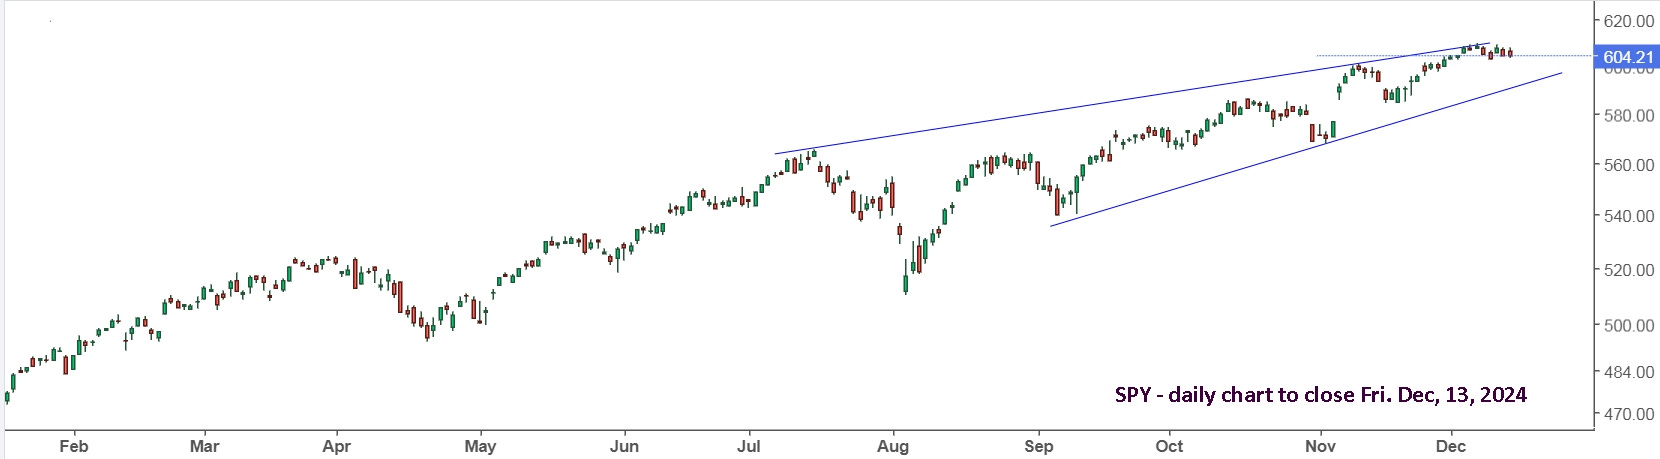
I see two likely outcomes and it will likely happen within the next 2 months. First, it moves to support, either downwards or sideways, then fails or moves higher. Second, it melts up like January, 2018. Either way, a down move can be expected eventually.
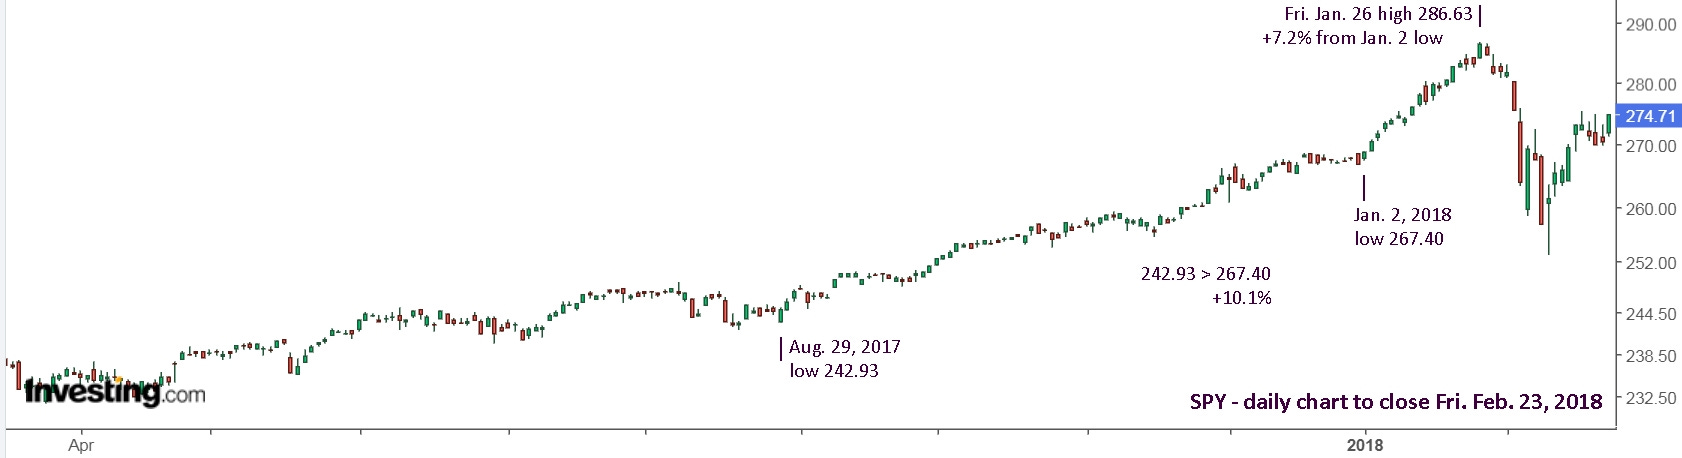
UVXY made a first move up Jan. 16, +9.06%, and held up while SPY powered higher and higher. This, as you have hopefully learned by now, is fairly common. And note that UVXY made its high on Tuesday, Feb. 6, with a lower high on Friday, Feb. 9 when SPY made its low and rallied on the day. This is also very common.

SPY gave an extra 7% to start off the year, then gave up 6 months of gains in a few days. UVXY gave +9.06% on Jan. 16 and +242.5% at the high on Feb. 6.
It made sense to stay in SPY for some of the extra gains, while focusing on UVXY for the inevitable big move. Alternatively, ignore the extra gain potential with SPY and simply wait for the inevitable UVXY move, and when it gets this clear, best to buy UVIX for some extra horsepower.
Update to Fri. Dec. 20: This week was a perfect example of how markets get ‘pushed’, regardless of what’s reasonable or logical. Before I show that, here’s a look at AVGO and ORCL since their recent earnings report gap moves.
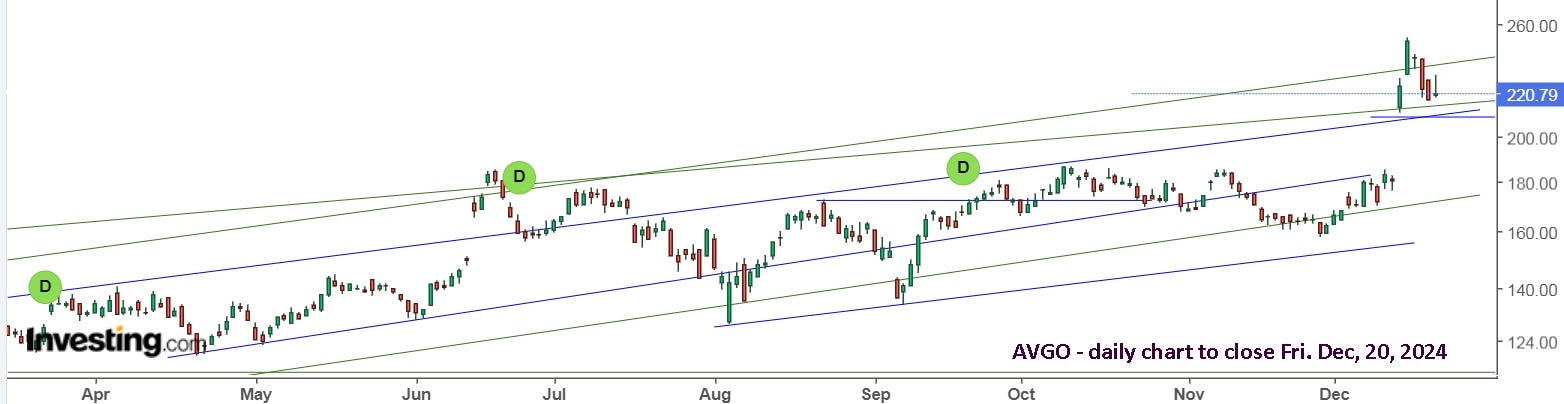
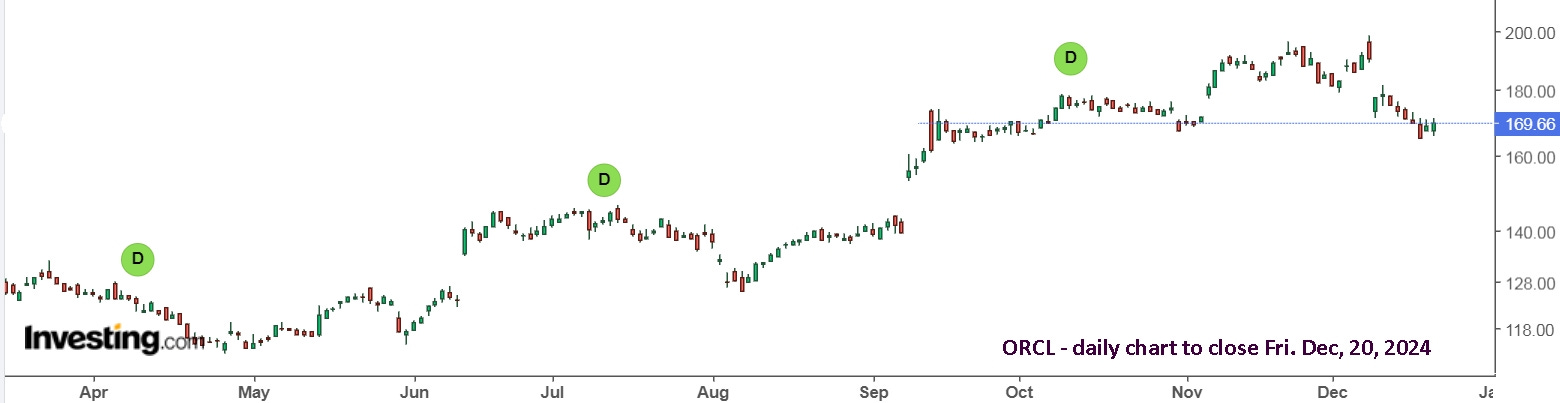
In June, and again now, it was a good idea to sell AVGO when the price got ‘too high’. There’s also the issue of gaps generally being filled, so a drop back to 180 is likely. I certainly would have taken the win and remain out. ORCL may hold support here, but I’m not interested. There’s too much risk for a ‘push’ lower.
In last weekend’s update, for SPY I wrote: “moving to the sidelines already was likely a wise decision.” and you then had time to get to the sidelines this week. I failed to remind you, and myself, of the FOMC announcement at 2pm on Wednesday. Regardless, we were already safe on the sidelines and trading UVXY, in anticipation of a potential sharp move.
Like with ORCL after earnings, the hard drop in the markets on Wednesday was pretty ridiculous. The Fed cut interest rates as expected, but forecasted only 2 cuts for next year, versus the market expectations for 4. Let’s be honest, it’s impossible for millions of individual investors to all agree within seconds of the announcement and begin selling hard. This was clearly a ‘push’, and all the other bots quickly joined in.
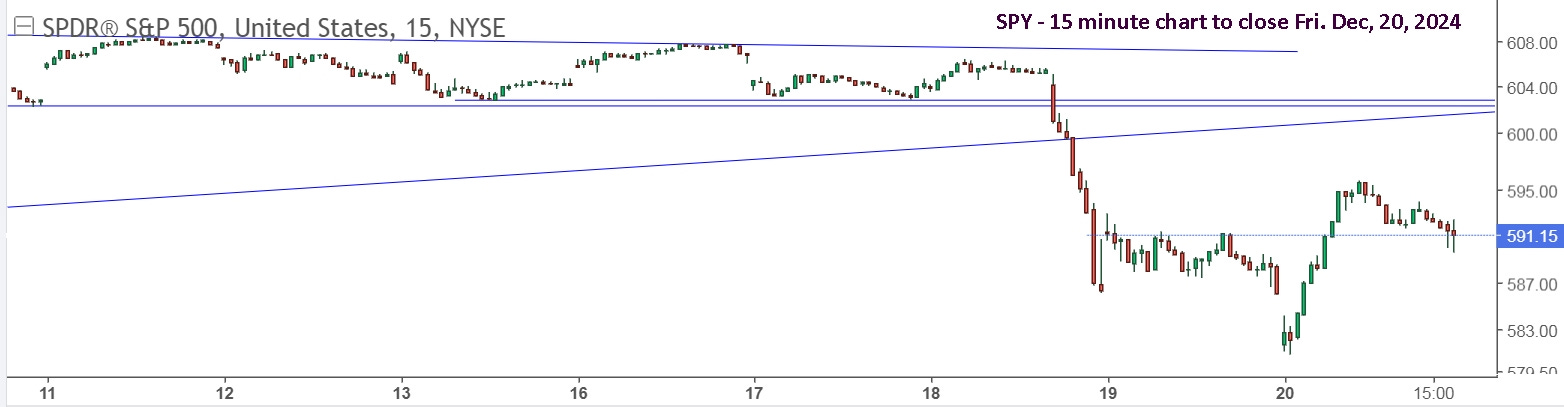
We can’t react as quickly as the bots, but we can act within a few minutes. Of course, we can also plan ahead and already be out of SPY and in UVXY before the ‘push’. Here’s a 5 minute look at SPY.
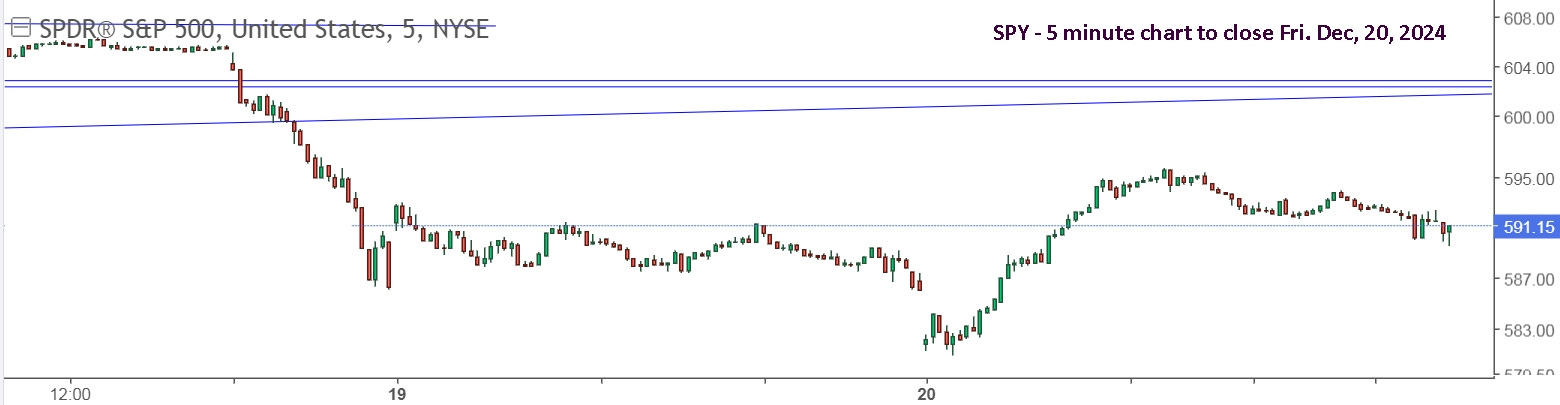
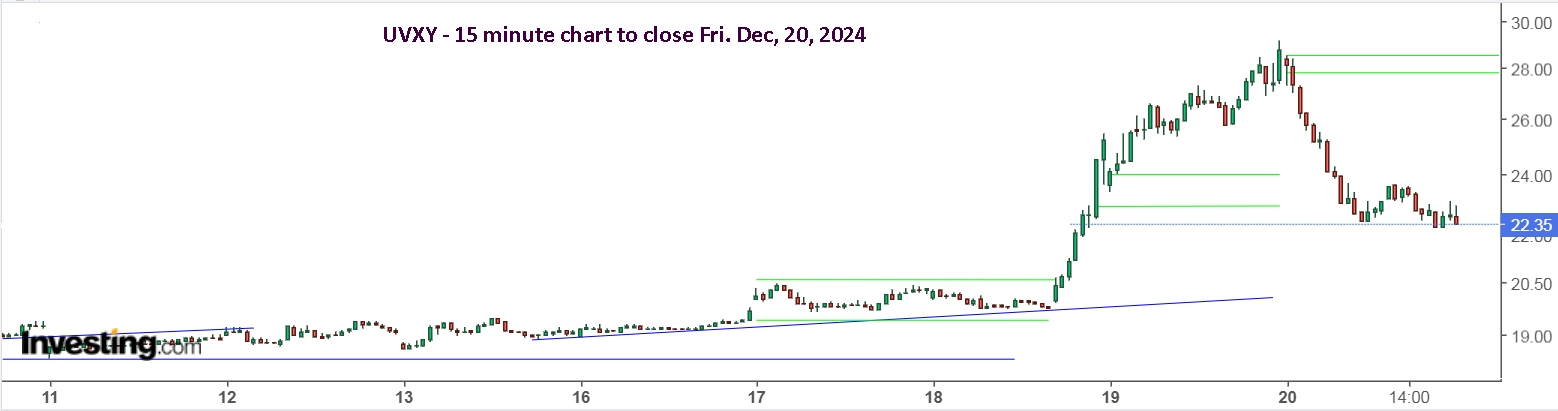
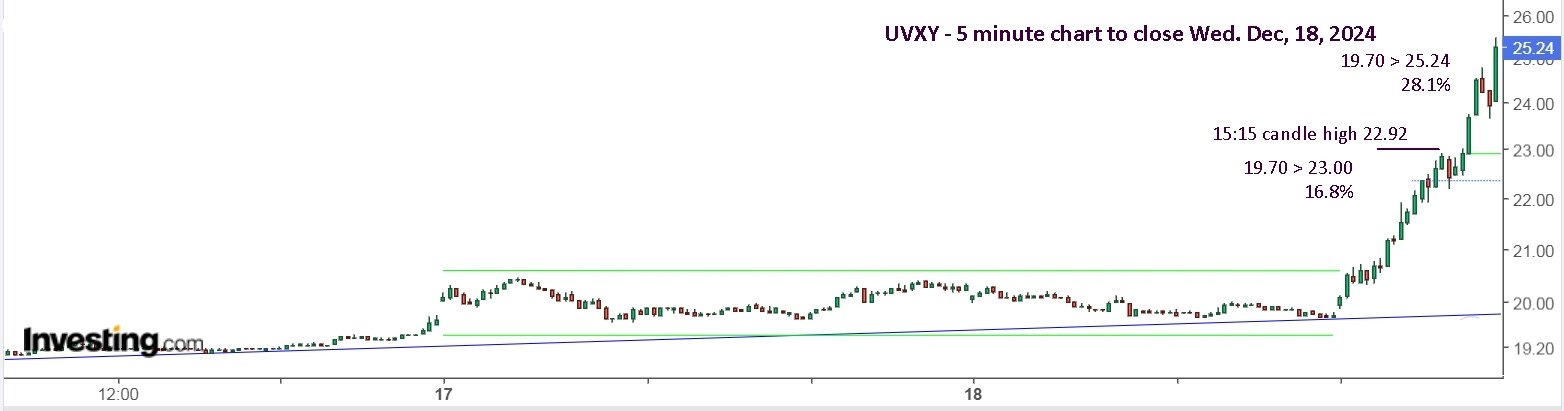
And here’s a 15 minute view of UVXY, which we were already trading for gains since last week. Notice how prior trading ranges become tiny by comparison and all perspective is easily lost.
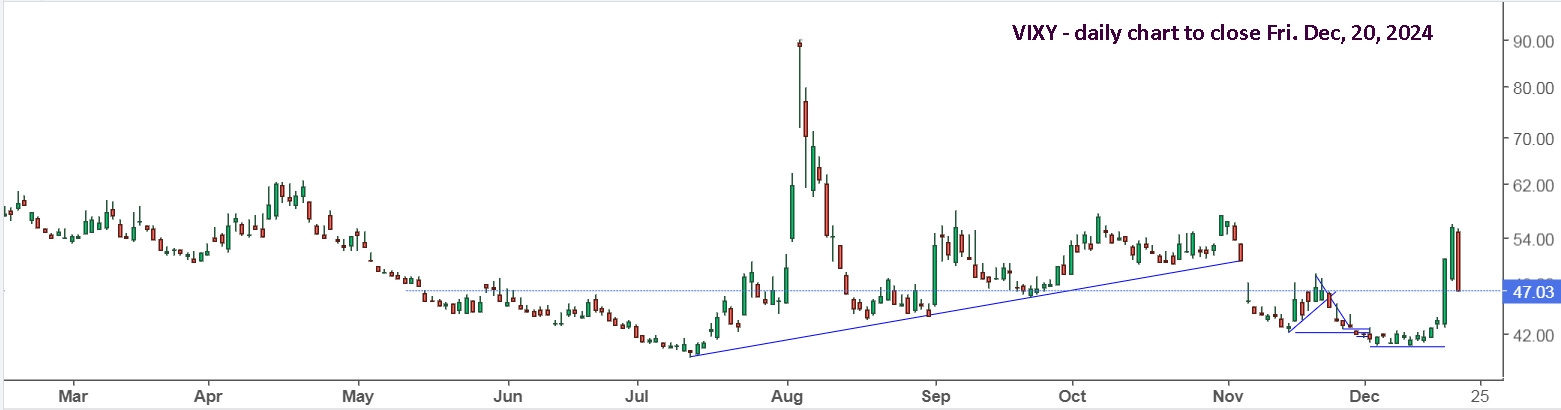
And here’s a daily VIXY chart, which was the focus of this article, written September 2. You’ve had over 2 months to prepare. Don’t feel bad if you completely missed this opportunity.
I was worried that it might rocket higher on Friday, which would have been completely ridiculous and unjustified, but the move in August, triggered by the Japan carry trade issue, was even more ridiculous and unjustified. Here’s a closer look at last week, starting with Monday.
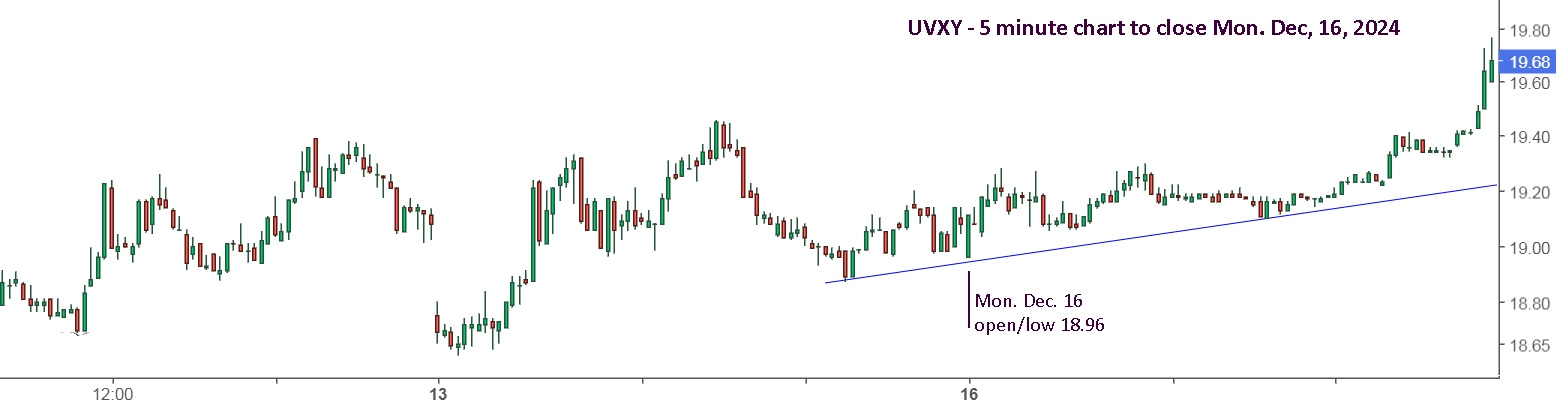
UVXY was a buy at the open at 18.96, adding to what you may have held from Friday. Even though it was flat most of the day, it held above your buy price, so best to let it ride. Once it moved up in the afternoon, it looked promising, and ‘safe’ to hold overnight. It could, of course, gap lower like it did on Friday, but it was already losing momentum Thursday afternoon, so the setup was quite different.
I now draw 5% lines above and below the closing price, as a guide for the next trading day. As you can see below, it provides a nice reference for the day. I sold off the morning high and re-bought when it held a firm bottom. The late dip and reversal was a great time to buy if you hadn’t already.
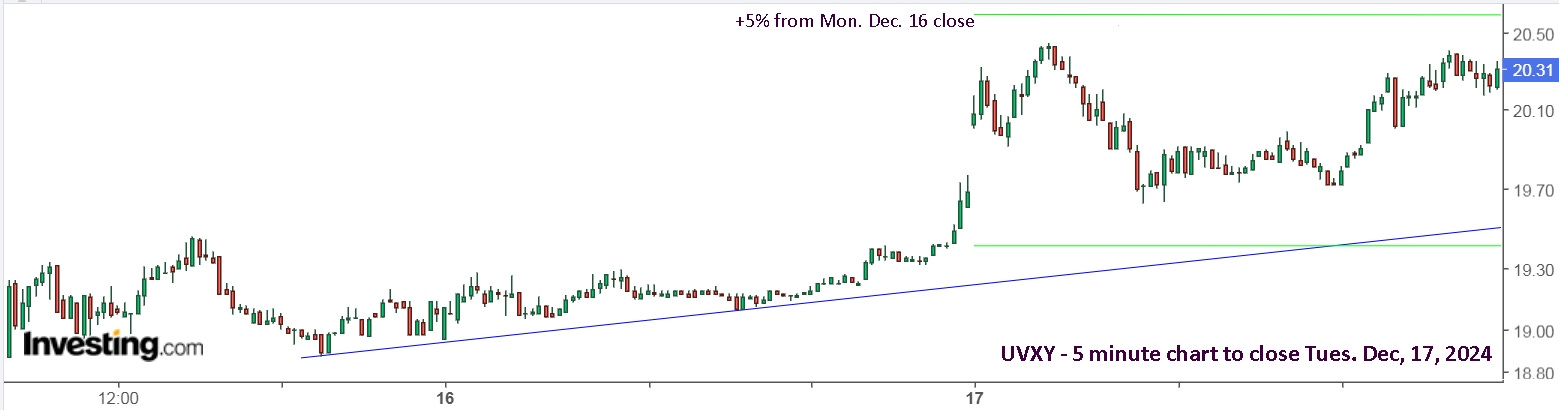
The close on Tuesday was fairly neutral and I chose to sell some shares, taking the win, as I wasn’t expecting a sudden move overnight and it could easily gap open lower, which it did, so I re-bought. When it topped out after 15 minutes and reversed, you may have sold, or held and waited, with a stop sell just below the early low, which was triggered and 10:46. You may have decided to sell before that and put in a stop buy above the recent high of 20.20, or the early high of 20.29.
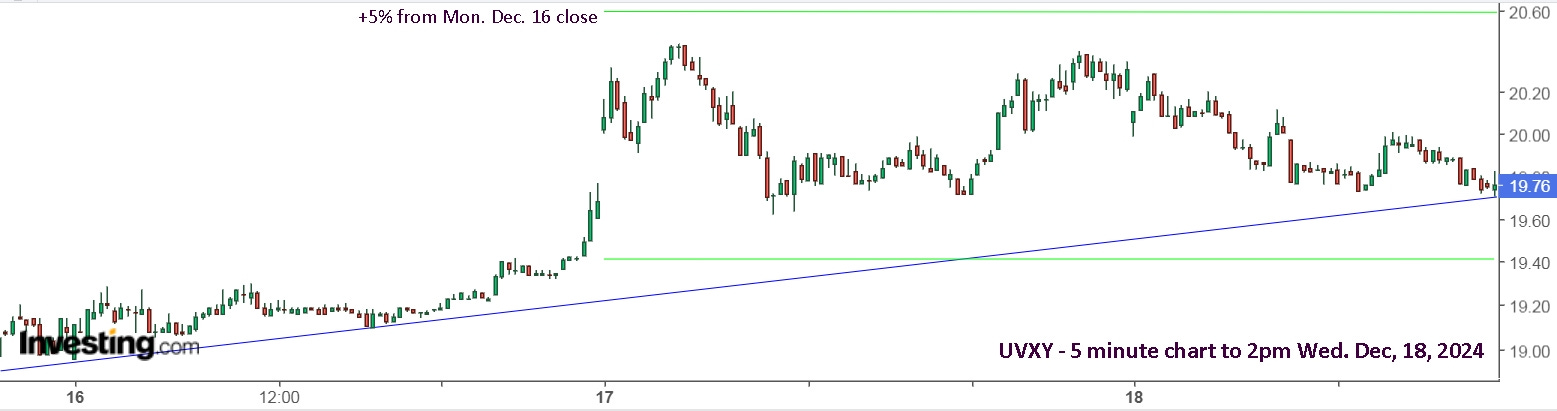
Once it was back to my support line, and back to the earlier low, I bought extra with a tight stop. I completely forgot about FOMC that could have triggered a sharp gap move lower, or higher. Naturally, with my miserable luck, I was stopped out of the extra shares by pennies and it shot up. I quickly bought some and then remembered FOMC.
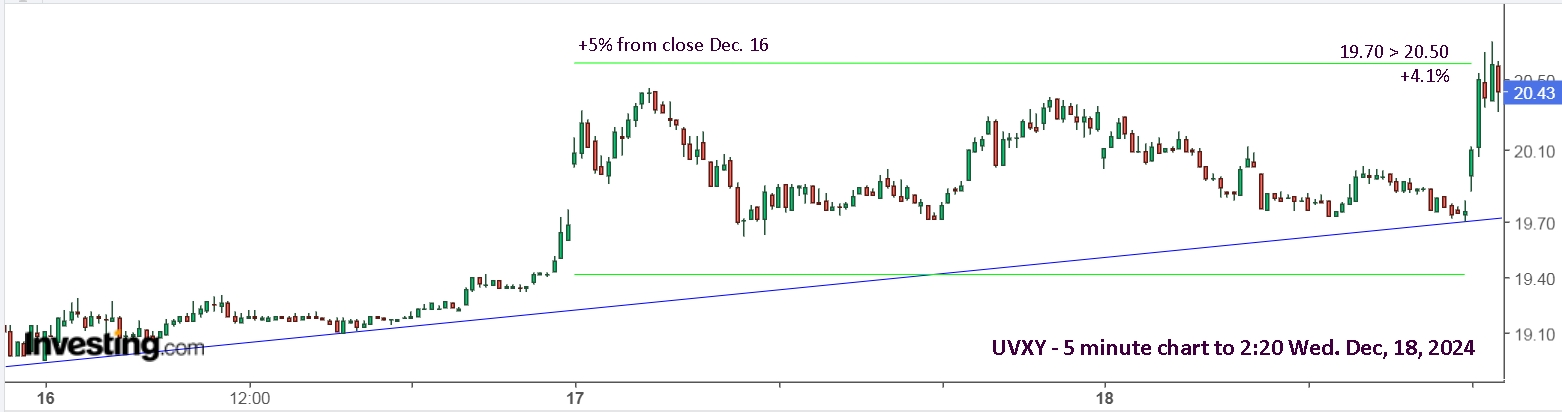
With it up to my +5% line from Tuesday’s open, bouncing up and down, and no valid reason for a big market drop, I sold my shares and put in a stop buy higher. In hindsight, and what I’ve been telling you and myself for months and years, it’s better to let it ride. Don’t take a small gain. It’s better to give up a small gain, in order to maintain your position for a potential big gain. Doing it in the moment can be really difficult, especially when selling and re-buying lower is what you’ve been doing for days and it has been working.
When it hit 22.92 and turned lower at 3:20, I put in a sell order at 23.00 for +16.8% from buying at 19.70 at 2pm, which was actually where I was stopped out and then quickly re-bought higher, but the shares I was still holding were from Friday at 18.65 for +23.3%. The move up was completely ridiculous and unjustified, so grabbing a quick gain of 23% felt good.
What I didn’t do, is put in a stop buy at 23.31 or so, +1.3%. I was VERY upset with myself when I checked later and saw it way up over 25 and closed +28.3% from buying at 19.70, or +35.3% from Friday at 18.65. You may think I shouldn’t complain, after all, a win is a win, but if a team plays like crap and wins, the coach isn’t going to be happy, and neither should the players. Plus, I missed the +200% move in August because my account was unfairly locked, then I was afraid to jump in and hold after the first day. I was committed to catching the next move with a big position. Here’s a look to Wednesday’s close.
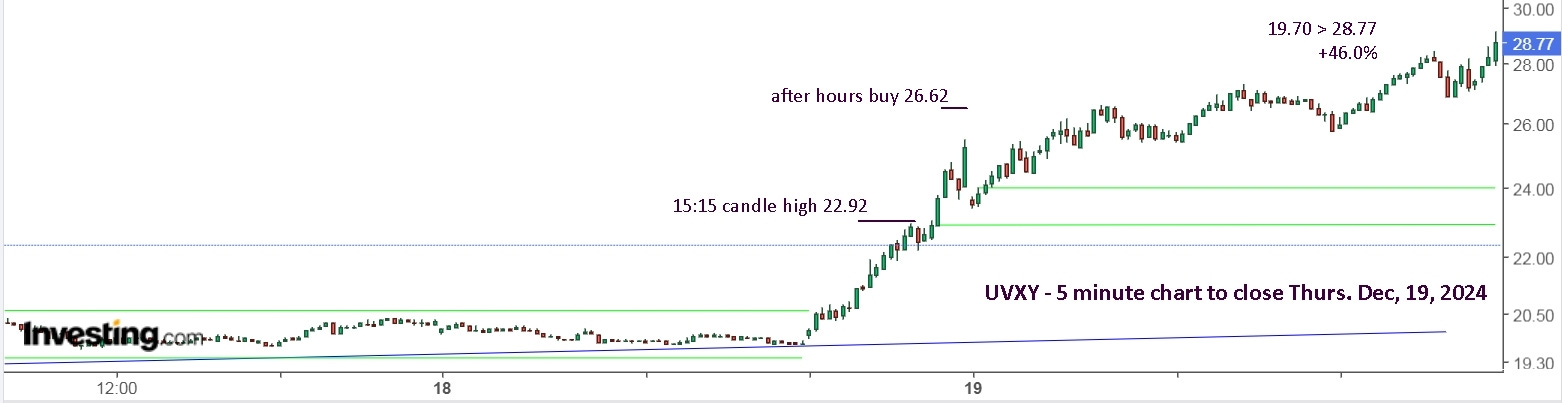
It was then over 5% higher after hours, and I said to heck with it, and bought some at 26.62, hoping that it would go back down, which is stupid, I know, but it’s emotional, and it was a very small amount, less than what I bought at 18.65, so I would ‘happily’ hold those shares all the way back to 18.65 and a chance to re-buy. That would be stupid also, but it’s emotional.
After hours (and pre-open), it’s not possible to use stop orders, so you’re stuck with your decision, unless you watch it closely and use a limit order. I certainly wasn’t going to sell if it dropped, since it would just as easily then go back up higher. Within 30 minutes of buying, it had dropped back down and I bought a bit more at 23.15, happy with the chance to ‘correct’ my first mistake.
I commented to Sandimas that evening that I was going to be ready to buy big Thursday morning, regardless if it gapped higher or lower. Unfortunately, saying what you’re going to do the night before is a lot easier than actually doing it on game day. It’s literally like jumping up on a surf board on the beach. It’s a completely different ball game when you’re in the ocean. I tried it on my windsurfing board. I’d never surfed, there was no wind, but big waves, so we went out and ‘had a go’. I paddled like mad and was staring down the sheer drop with my front half hanging over the edge. My mind then told me it was crazy to keep going, which it was. I stopped paddling and decided to be safe and wait for some wind to go windsurfing. It was the right decision.
UVXY gapped lower on Thursday at 23.62, but above my second after hours buy price of 23.15. It hit an early low of 23.37 and move up sharply. It was exactly the setup I hoped for, to buy big, but I didn’t do it. I’m still not sure why I didn’t, but I suspect it was because I was looking at the sheer drop back to 19.70, with a high buy at 26.62. I then struggled all day, selling and re-buying.
Even though the after hours buy at 26.62 was small, it was stupid, especially since I firmly believed the entire move up was ridiculous and unjustified. I was then trying to get out of that position for a minimal loss. When it reached Wednesday’s close and fell, it made sense to sell. If I had bought big at the open and was following the standard rules, then I would have kept holding. When it got back to my high buy price, I sold again. If I had started the day properly, I would still be holding. I then bought it back and held for the end of the day.
It was up a bit after hours and after cursing myself again for not buying big early, I decided to sell at 28.86. It closed 28.77, +46% from 19.70 on Wednesday, a buy at support. All because the Fed says they expect to make only 2 rate cuts instead of 4 next year? That’s completely ridiculous since they might still make 4. Either way, it makes little difference to the thousands of companies that make up the market.
Thursday evening, I decided I needed a way to avoid seeing the sheer drop, so I slid the 5 minute chart to the left, only seeing the final 15 minutes of the day before. I then drew in my horizontal lines for a guide. That small adjustment was a BIG help.
I happened to wake up early and check the pre-open prices. UVXY was +5.3% at 30.30. Damn, miserable luck yet again. I remembered how ridiculous the August move up was, with UVIX going an extra 90% holding from Friday! I bought some UVXY at 30.30 and went back to sleep. I also remembered that in 2020, UVXY went up 1174% in a month. Paying an extra 5% now for a small position was no big deal.
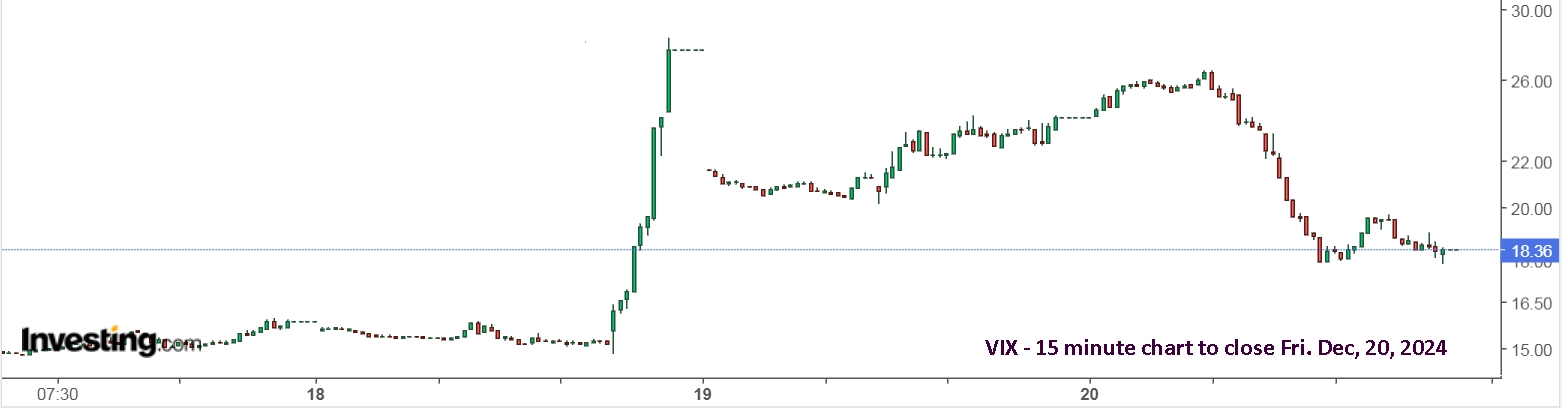
Naturally, the price was back down when I got up to start my day. You can see below just how crazy the VIX move on Wednesday was. You can also see how it started down sharply at 7:30 on Friday, so I was lucky to have woken up at 7:50 and not 7:20. Getting up and having a look was the smart thing to do, but I didn’t want the pain and aggravation. It then dropped sharply again at 8:35 and was about even by the open.
Apparently, the markets liked the inflation news, which is also completely ridiculous. It’s amazing how finance reporters can continue making such ridiculous comments. I mean, millions of investors were up early and made such a decision after reading the report in seconds? No, the ‘attack’ bots were set to push the markets up, having accomplished their strategy to push the markets down.
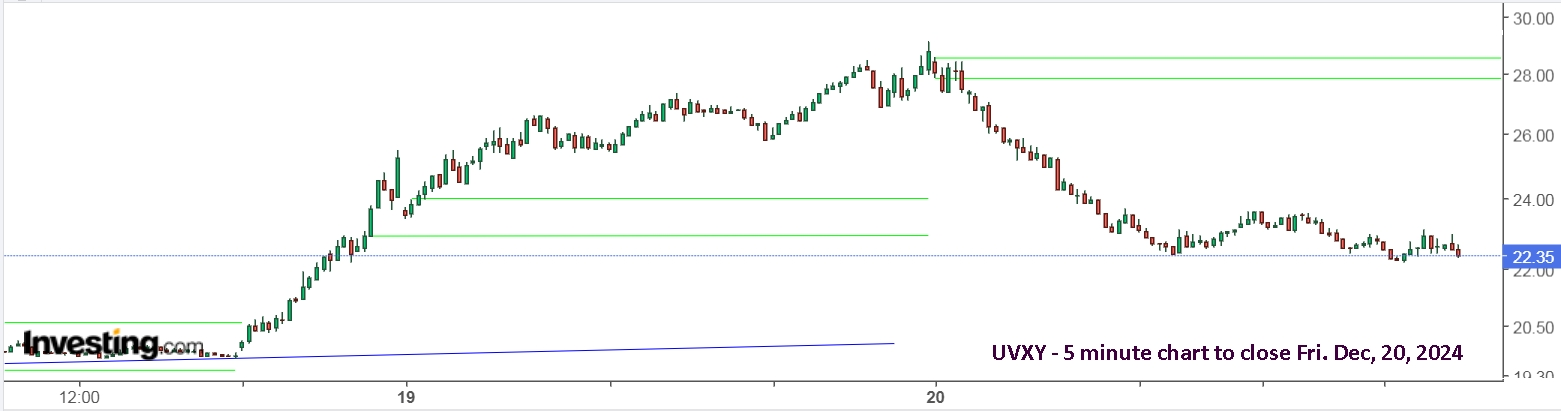
Only seeing the end of Thursday on the 5 minute chart for UVXY and SOXL was a huge help. I added horizontal lines after the first 5 minutes, then waited to see which way they would go. SOXL hit its low in the first minutes, then held a range until 10:20. UVXY hit 28.53 off the open, fell to 27.30 (-4.3%) in the first 10 minutes, then shot up to 28.39, shooting up and down all the while. That gave me my range, I had my lines and I couldn’t see the sheer drop below. On a normal day, like last week and earlier this week, 4% is a wide daily range, not a 10 minute range, and that’s why you have to change your mindset and charts to help you manage the changed conditions.
After the pop back up to 28.39 from 27.30, I sold my 30.30 buy with a stop buy at 28.61, just above the early high of 28.53. At 9:55, UVXY made a new low of 26.98 and shot back up to 27.34. If I had stopped out below the early low of 27.30, I may have then been back in on a poorly set stop buy. The new chart setup allowed me to ignore that move. It dropped the next candle and I was happily watching it fall, holding SOXL and now expecting it to push higher. That took longer than I anticipated, but the new setup was again very helpful, and was a great help all day long as the charts then pushed to the right, removing the earlier times and maintaining a focus on the current range.
You can see how I wouldn’t have been able to see the early moves clearly with the prior day showing. The lower horizontal line is at Thursday’s final 5 minute candle low. I figured that was a good reference point. The upper line is at the early high.
With UVXY down over 20% on the day, it’s tempting to then buy, in case it makes a move up again. Don’t. Stay out. If you made a bundle on the move up, then it’s easy to stay out. If you missed most of it, it’s easy to talk yourself into buying and hoping for a move up. Don’t.
Here’s a 5 minute chart of SOXL.
As with any buy, if you catch the early low and it moves up, you’re golden and should stay patient and hold. Give it time to make a larger move up. Without the red resistance line showing, I would have continued holding. With it showing, I sold and put in a stop buy higher. I decided to buy some back late in the day.
That red downtrend resistance line held 4 times, before finally being broken on December 13. It was a sell on the FOMC drop and a cautious hold on Friday after buying early Friday.
I’m not expecting any big moves next week, but I also remember clearly the push that happened in 2018 and the massive reversal on Boxing Day.
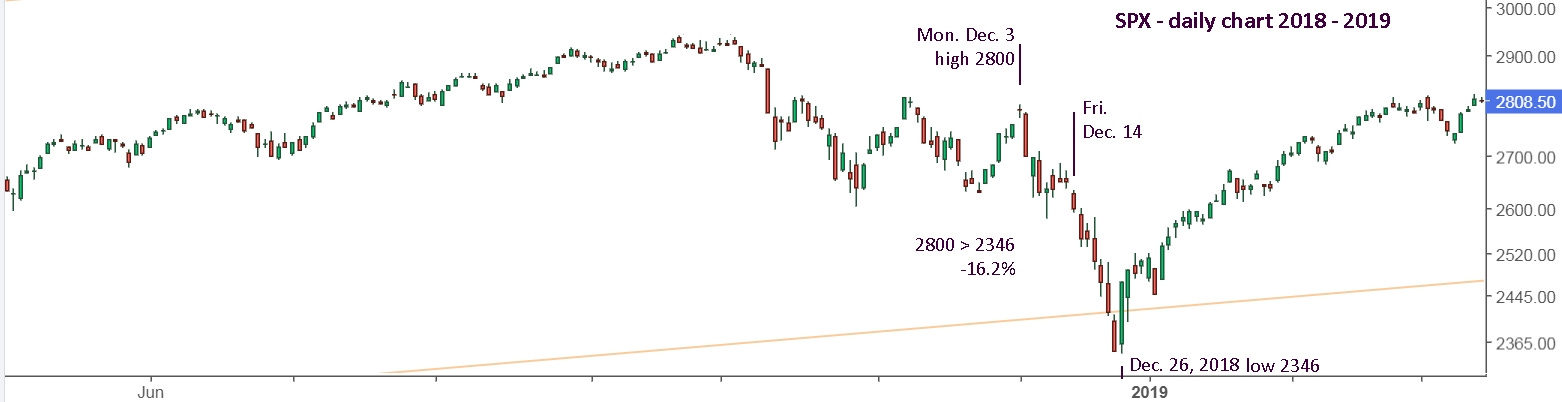
Instead of a Christmas rally, it was a Christmas avalanche, -16.2% from Monday, Dec. 3 with an extra hard drop the week before Christmas. I hadn’t completely accepted the notion of markets being intentionally pushed so effectively and was left second guessing everything on Boxing Day. I then couldn’t imagine a big move up in January, 2019, repeating the crazy January move in 2018.
The key is to understand what can happen, based on what has happened in the past, then ignore it and focus on what is happening at the moment. Enjoy the holidays and best of luck knocking the next pitch out of the park.
Update to Tues. Dec. 31: And that’s it for 2024! Happy New Year!! There were some significant shenanigans in the markets over the holidays, but not like 2018. Essentially, you should still be out and on the sidelines since the smack down at 2pm on Wednesday, Dec. 18 after the FOMC announcement.
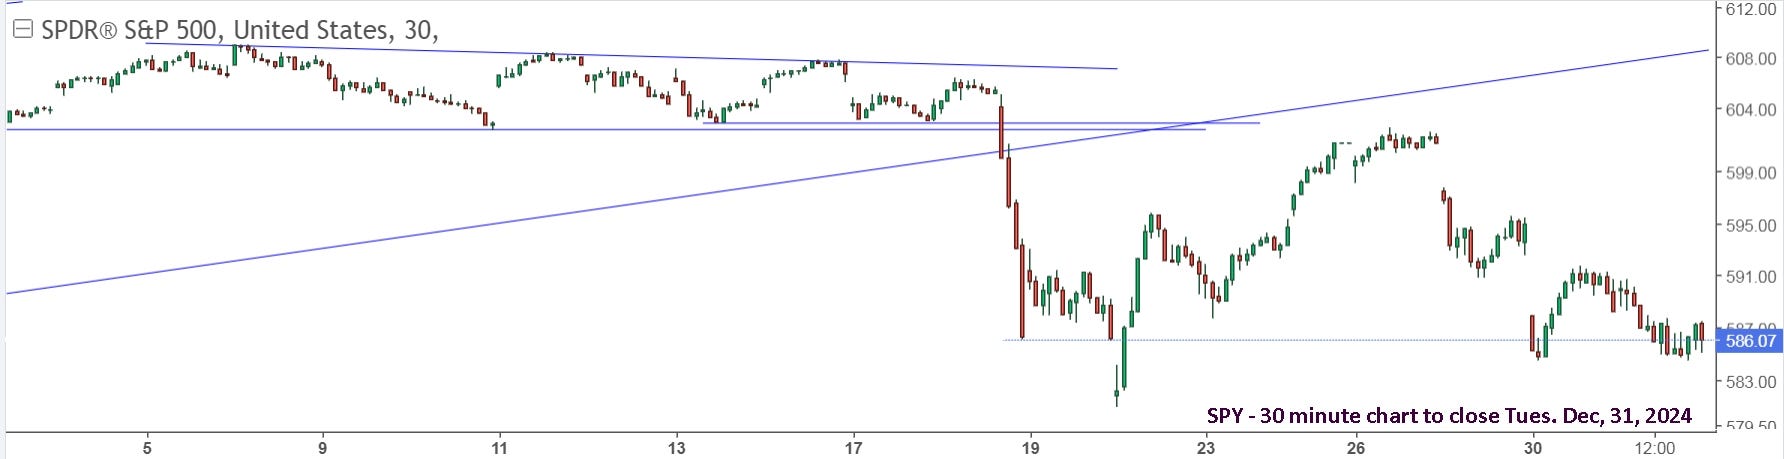
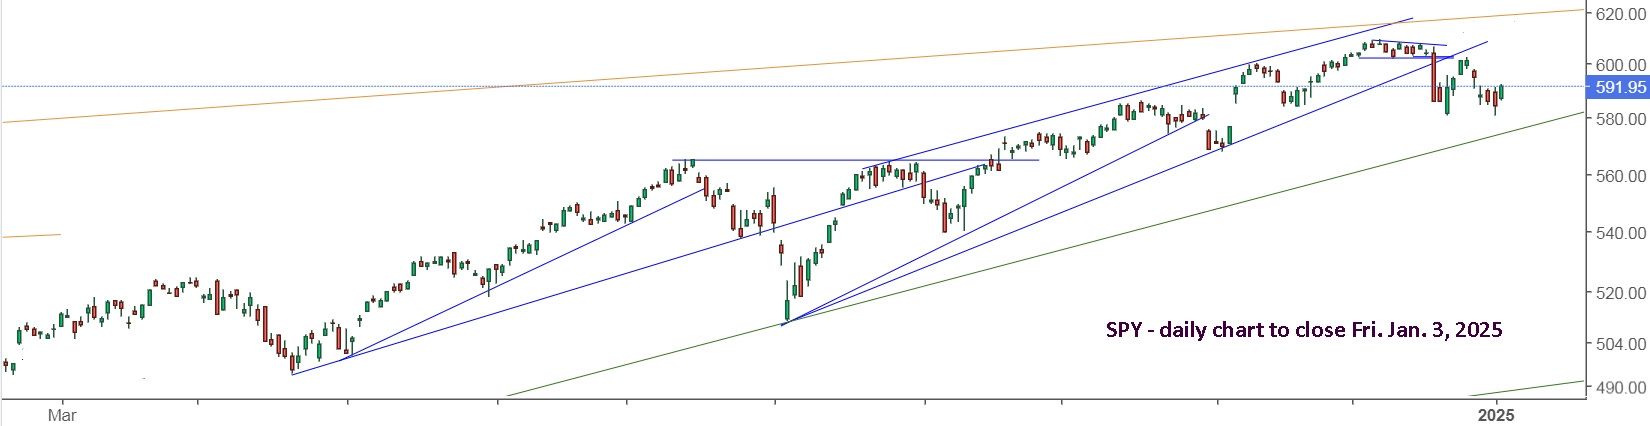
The drop from last Friday, Dec. 27, came as a surprise to me, and there’s certainly no reason to be ‘bargain shopping’ just yet. Be ready for a gap open lower and hard rally like Friday, Dec. 20, but also be ready for a gap lower and drop. Here’s a daily view of SPY for the year.
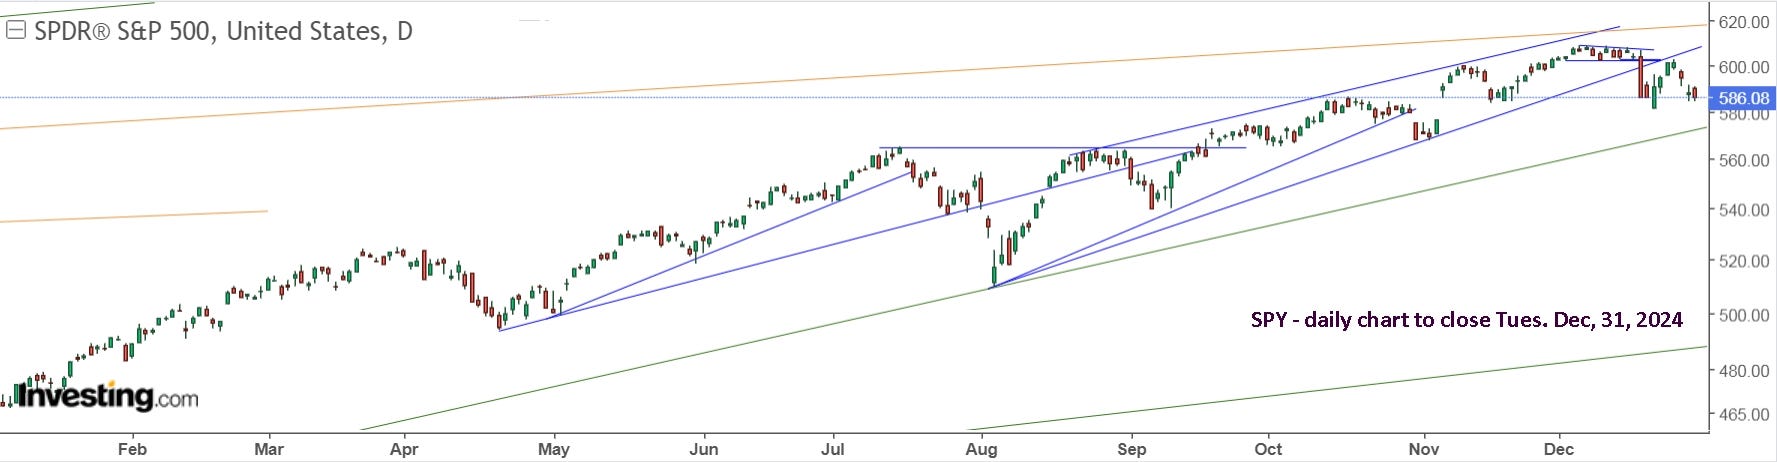
I’d say the markets could easily pull back to support and then it’s pretty critical that it holds. If it breaks, then 2025 could see a significant drop. It’s also clear that one should have sold prior to the hard drop after the FOMC.
Here’s a look at the intra-year declines versus calendar year returns for the S&P 500.
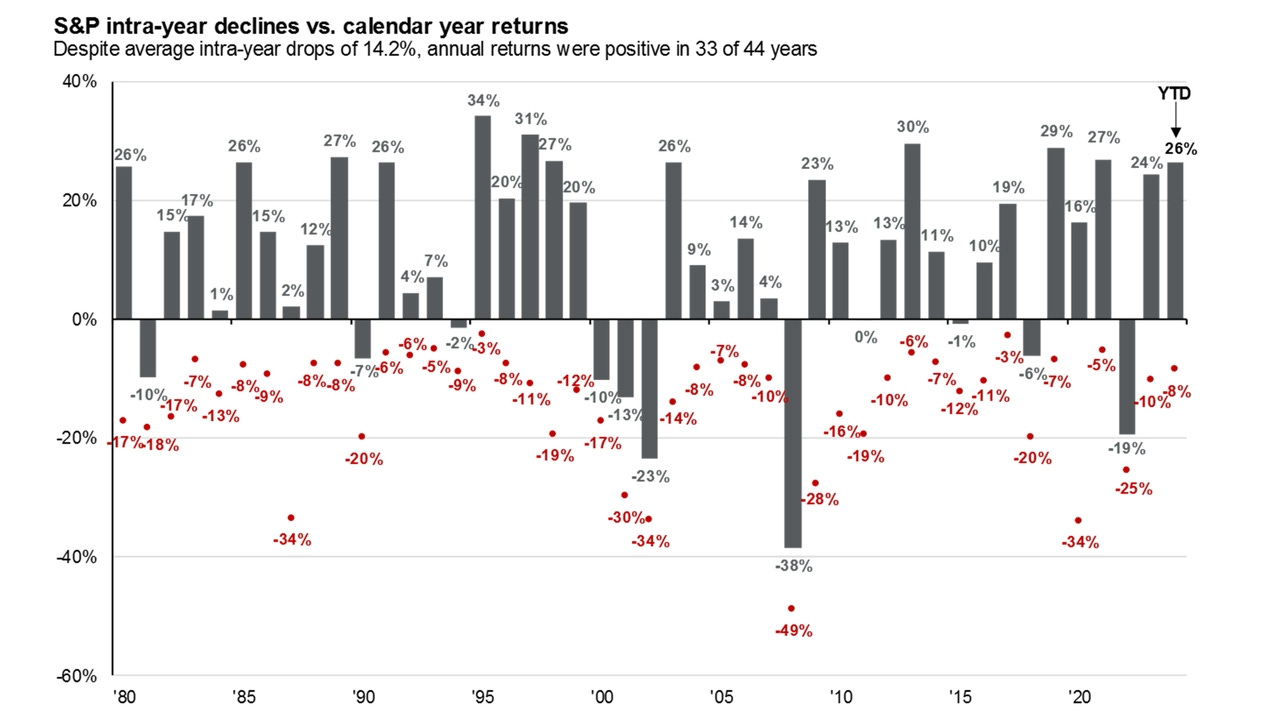
The first thing that pops out for me is that there have been a lot of big annual returns since 2019, and even 2017 was a pretty big year. The only period that comes close is the 5 years leading up to the dotcom bust.
The stock market has only had back-to-back years of 20%-plus gains three times before: in 1935/36, 1954/55, and 1995/99. Sure, we could get another 5 year run, like in the 1990s, but caution would certainly be a good idea.
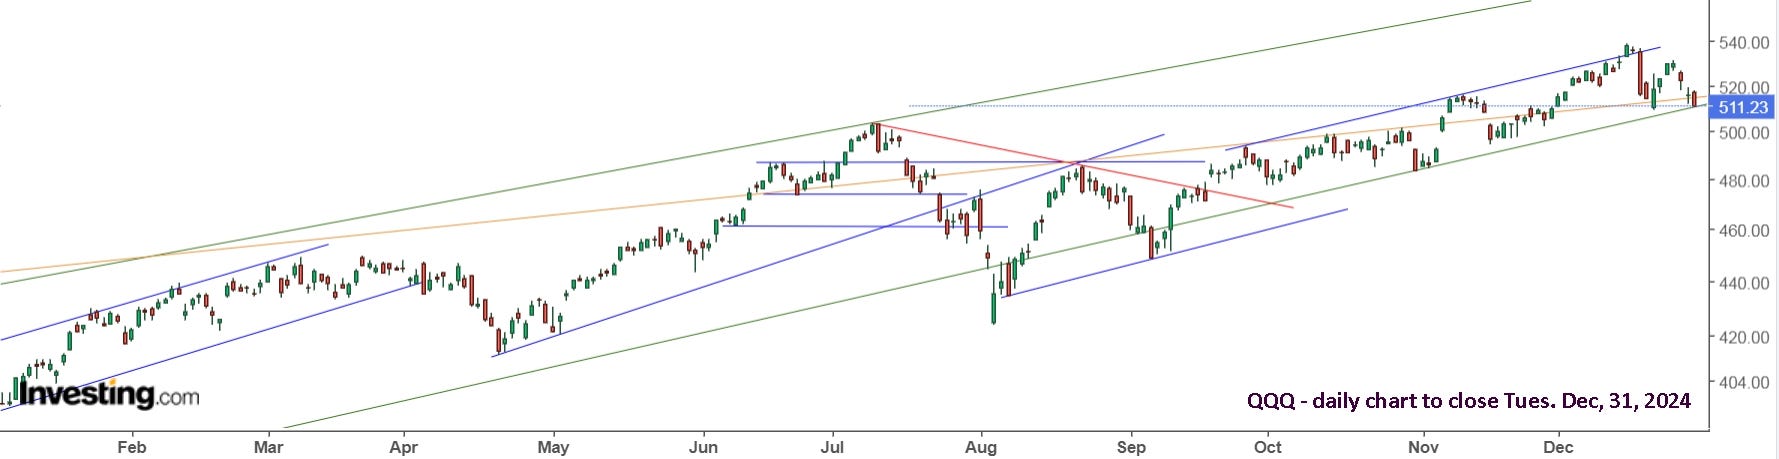
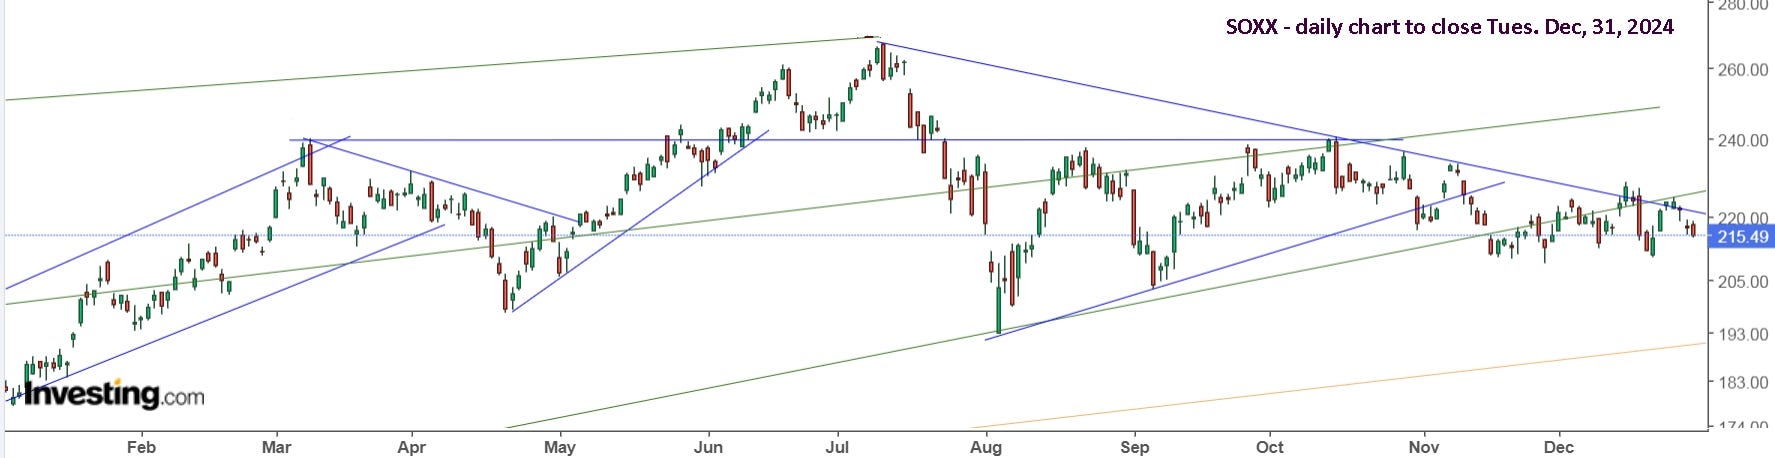
Here’s a look at QQQ and SOXX. You can draw your own conclusions.
Ideally, you should be sitting on great gains for the year and safely on the sidelines. I am mostly on the sidelines, but I didn’t manage to pull off great gains for the year. As I have said before, I’m a better coach than a player. I missed some open nets and coughed up the puck in front of my own net. Oh well, like all the players trying to make the big leagues, more practice and hard work is the path to success. For many things, working smarter is better than working harder, which is what I plan to do.
I’ll be watching UVXY and UVIX closely for another opportunity, perhaps tomorrow, or next week.
And remember, this will go up 10x if the markets really take a tumble. Even a 200% move like in August, would be a nice way to start the new year off!
Update to Fri. Jan. 3 : They hit the switch at 1:55 on Thursday afternoon. I sold my UVXY a bit earlier, trying to time the top and was then stopped back in on the final 10 minute blast higher. I immediately put in a tight stop sell, as I was already watching to buy SOXL. It just seemed like more games were being played, and I didn’t want to get caught looking in the wrong direction.
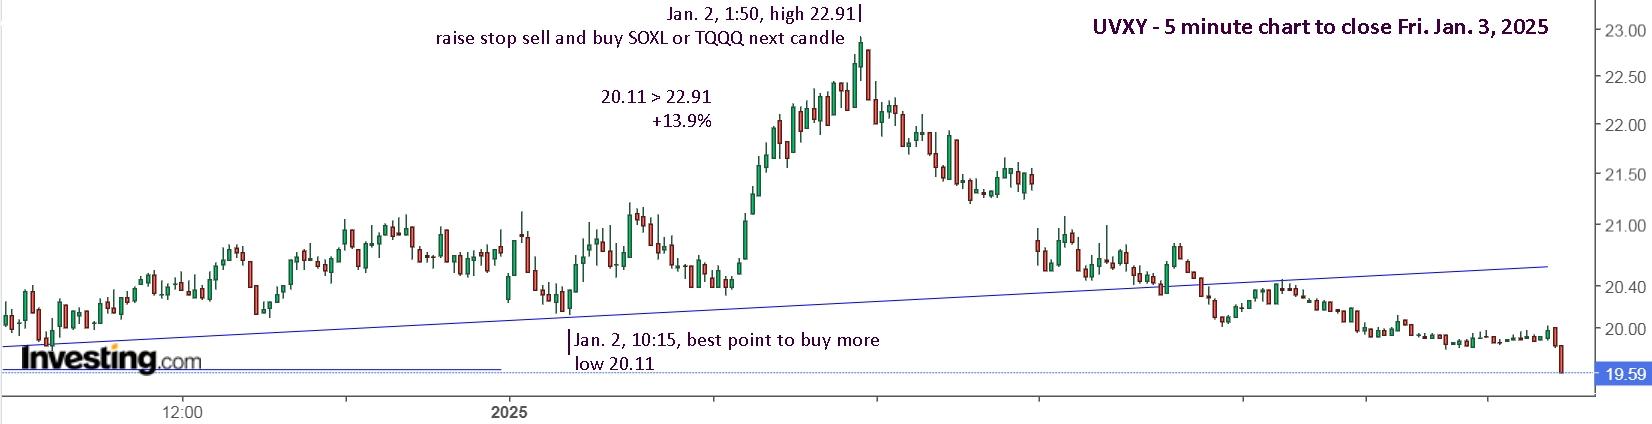
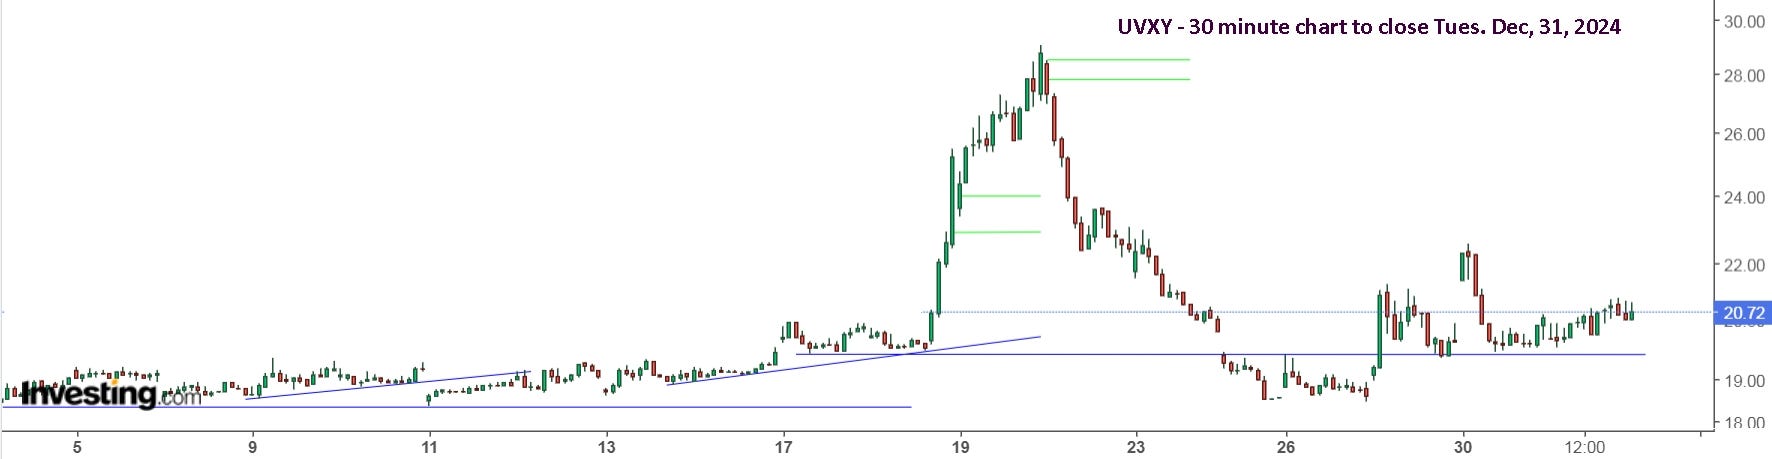
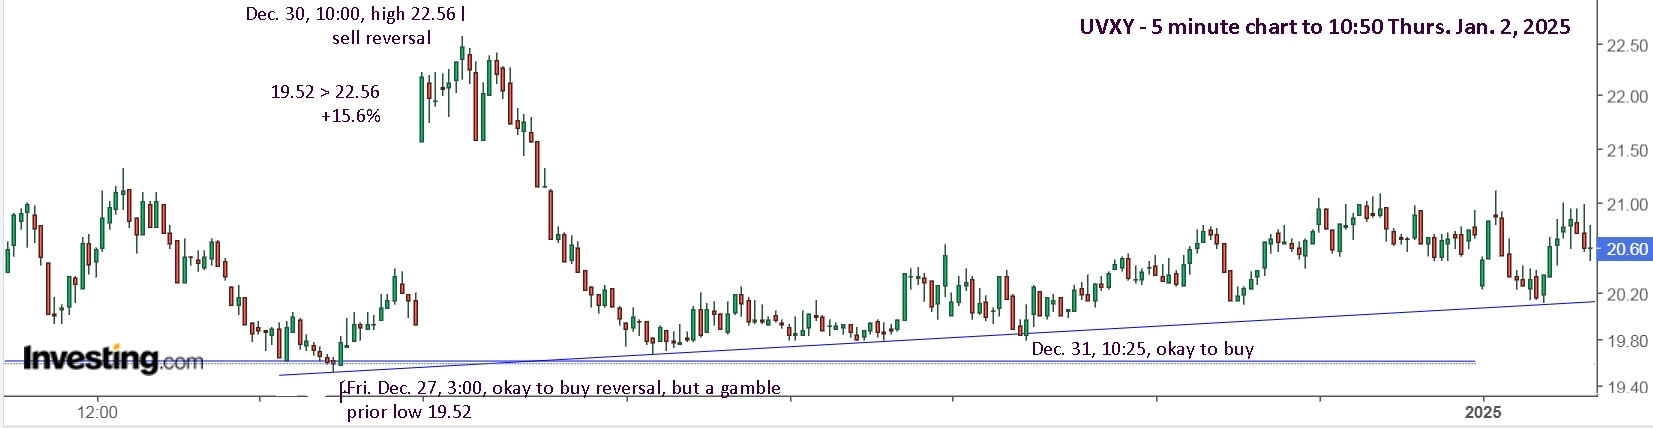
Here’s an earlier view of UVXY, showing how you were likely holding shares on Dec. 31. Only a small position to be safe, and then buying more on Jan. 2.
Now here’s a look at SOXL, which has been approaching the point of a wedge where it would have to break higher or lower.
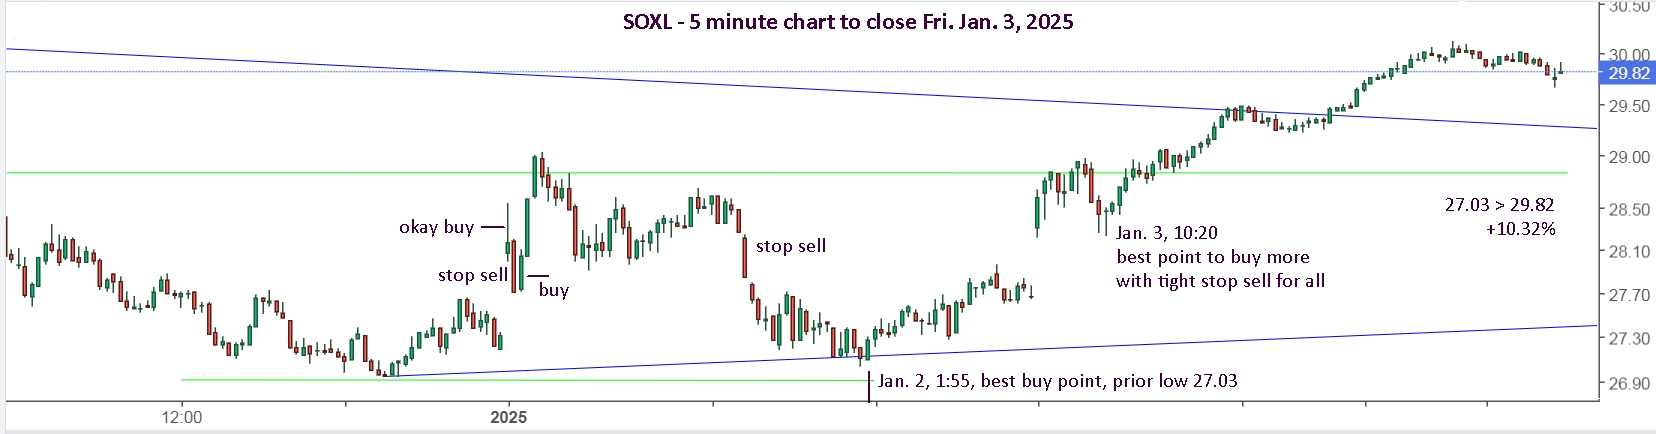
Holding some SOXL and UVXY at the close on Dec. 31, would have been a reasonable decision. Holding both, and trading both on the day, can be hectic, but one can also provide a signal for the other. In this case, SOXL was clearly holding possible support on Thursday for an hour, from the 10 minute spike up at 12:50. It could have easily continued straight up from there, but lately, such quick moves have often failed, and to avoid over trading, stay patient, and wait for the ideal setup.
SOXL and UVXY also provided a signal for TQQQ, which wasn’t yet clear. It was holding a hard floor, but it was a lower low from the day before.
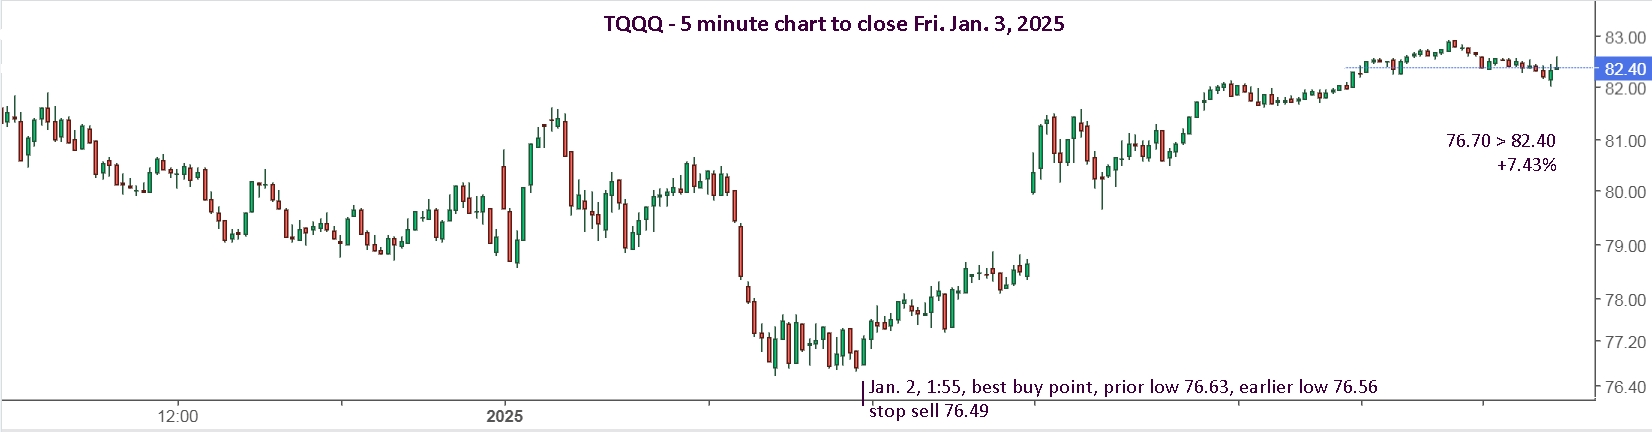
In order to make fewer trades this year, I am going to set a strict rule for buying. As you can see in the above charts for UVXY and SOXL, an early buy at a higher low from the day(s) before is a good bet. Using them as a signal for TQQQ was also useful.
Now, from being completely unsure which way the markets would go, you’re up a possible 7.4% on TQQQ and 10.3% with SOXL. Plus, you possibly bagged 2 gains with UVXY, +15% and +13%. That’s a good start to the year.
I will continue watching for a pullback in the markets, but the appearance of the charts changed dramatically after Friday.
We’ll see which way the big boys want to push things next week.
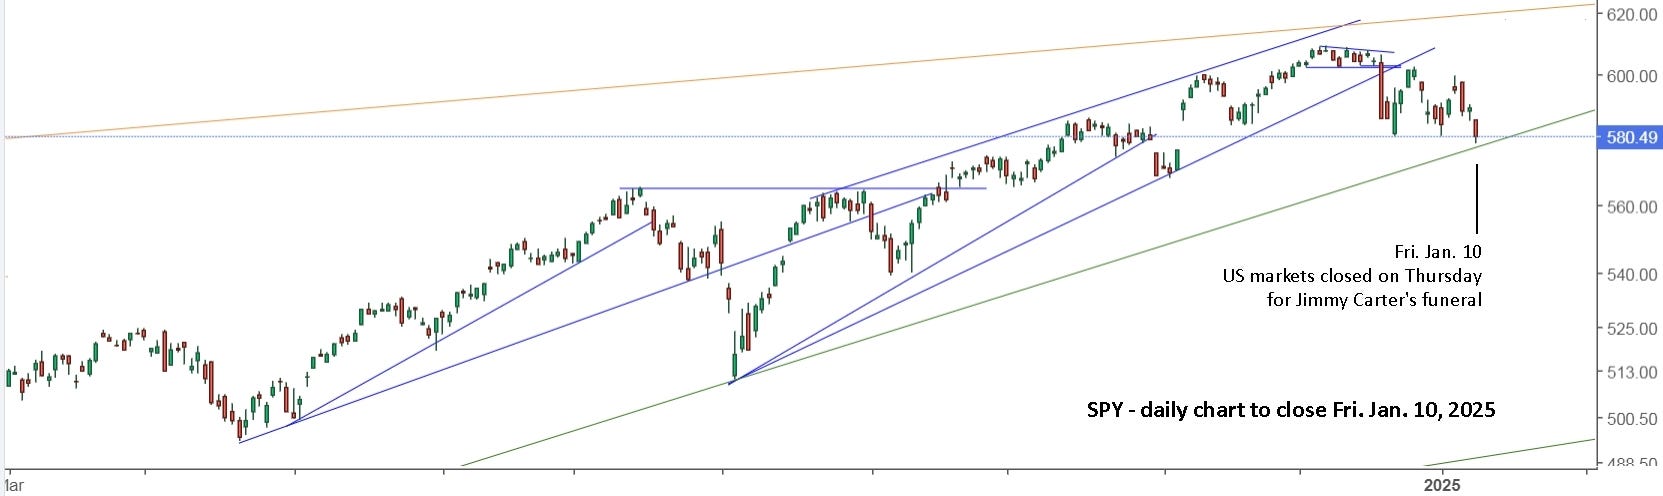
Update to Fri. Jan. 10 : In last week’s update, I wrote, “I will continue watching for a pullback in the markets, but the appearance of the charts changed dramatically after Friday.” Here’s a look at SPY, which put in a low at support on Thursday, Jan. 2, rallied to close, then gapped higher and rallied on Friday, Jan. 3. My conclusion was that the games played over the Christmas period were hopefully coming to an end.
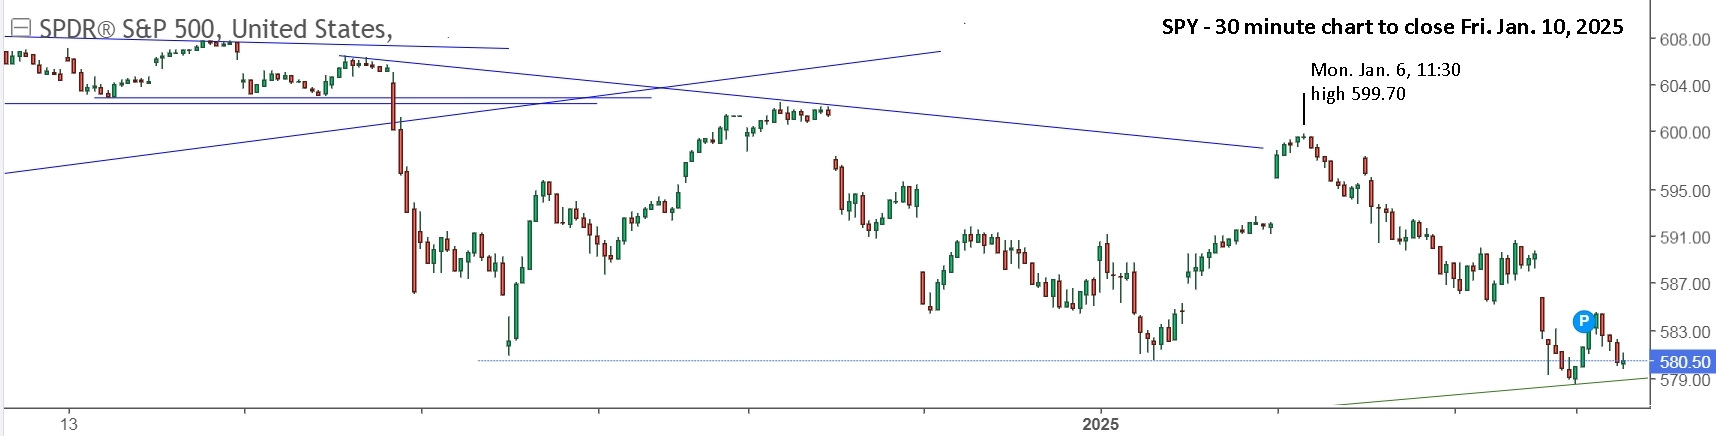
With the large gap up on Monday, Jan. 6, I was suspicious. It seemed too easy. Last year, the markets gapped up on Monday, Jan. 8 and we were watching and ready to buy. They powered up and the year was off to a solid start. When this hit resistance and lost momentum after the first 30 minutes, I started looking to sell and go short.
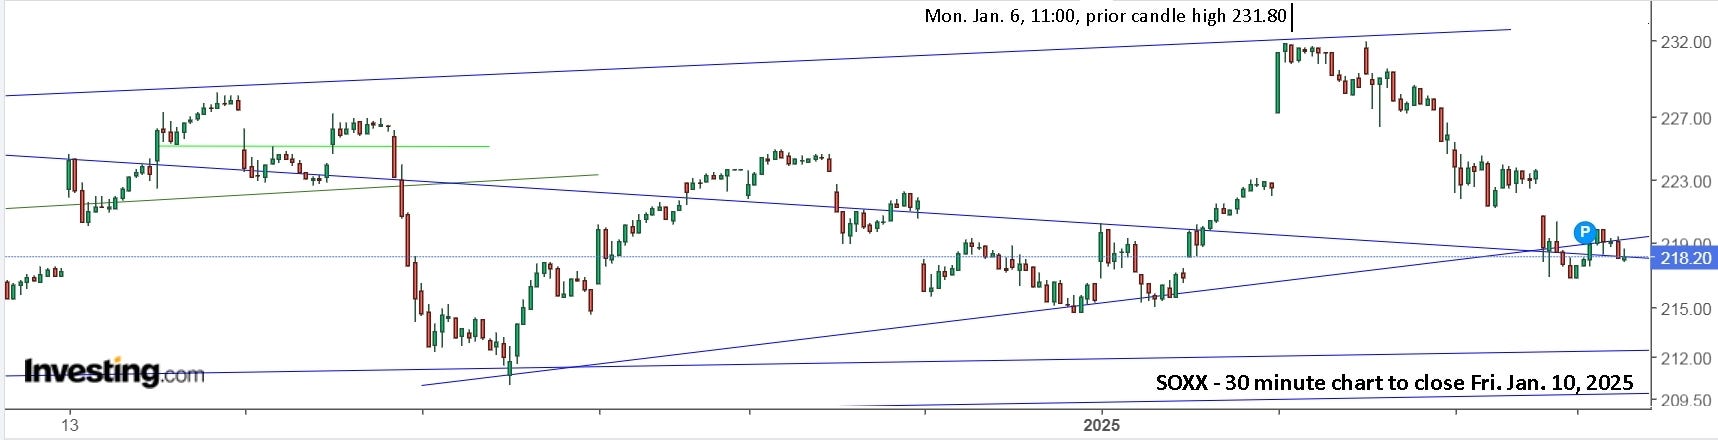
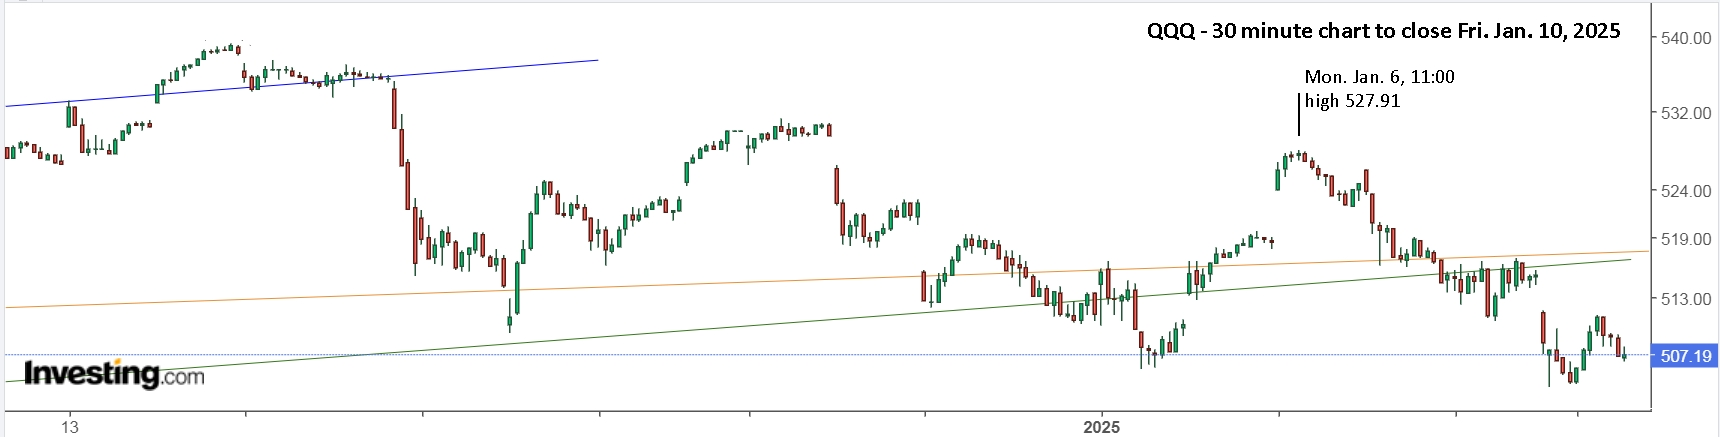
SOXX was an earlier indicator that the bears were dressed up as bulls. It closed the 10:30 candle at the high for the day and at resistance, then held a hard ceiling. I sold my SOXL. QQQ made its highs during the 11:00 candle, so it was no surprise when SPY made its high during the 11:30 candle. It was as close to a U-turn signal as you’ll ever get in the markets.
When they all put in a higher low on Wednesday, and pushed up, I was cautiously optimistic. I had bought SOXL but decided to sell, take the win and remain safe on the sidelines, willing to re-buy higher, if necessary. If you did hold from Wednesday, you needed to quickly sell on Friday for breakeven, or a small loss.
I bought the low for SOXL twice on Friday, but with supports broken and lower lows for SPY and QQQ, I decided to sell again and remain safe on the sidelines, willing to re-buy higher on Monday, if necessary.
Here’s a daily view.
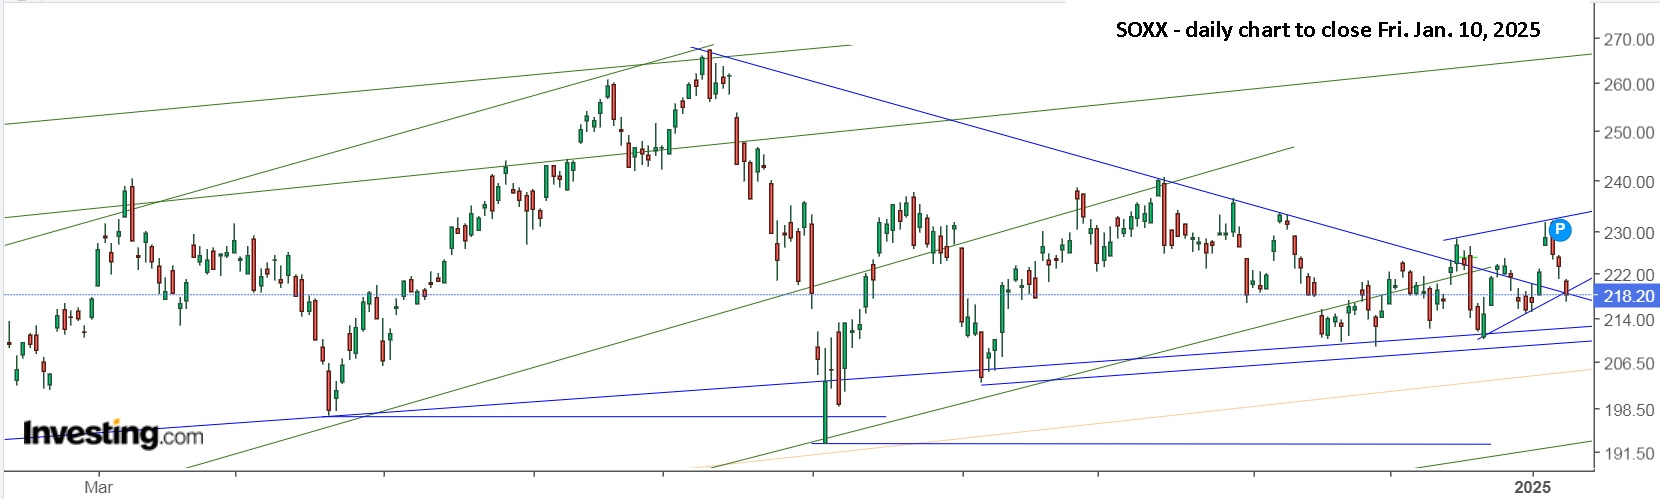
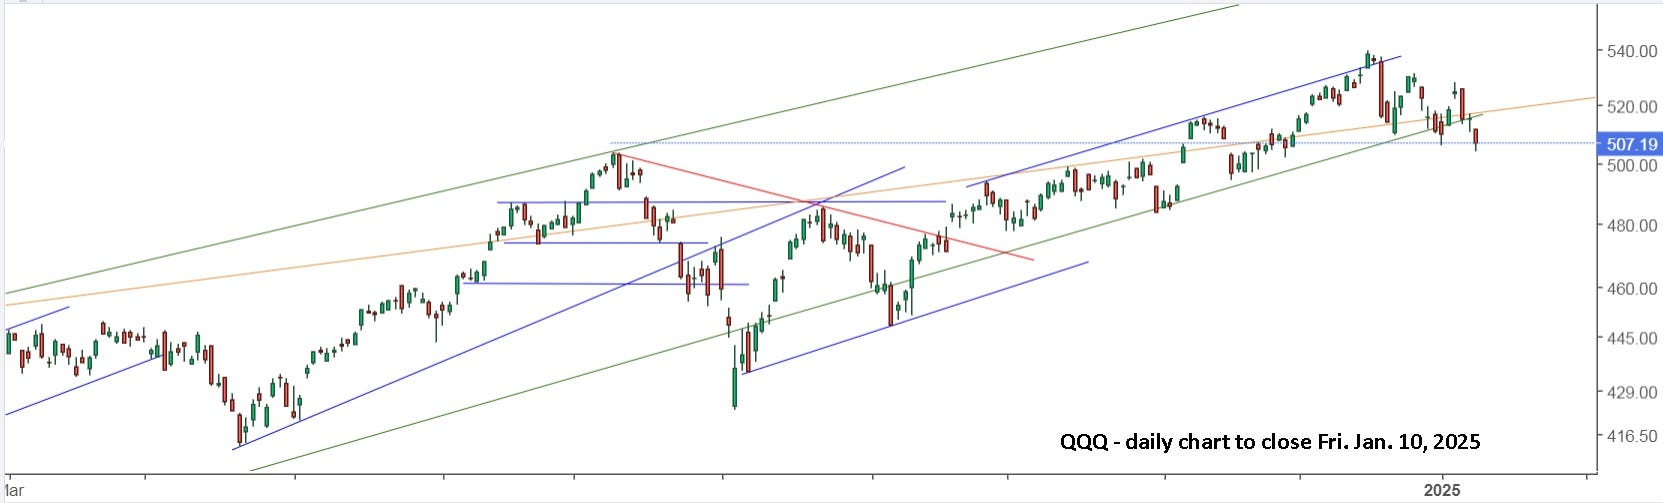
I had a feeling that the charts may now look a lot like they did in January, 2022, so I had a look, and they are indeed similar, even down to the change from a bullish to bearish view, prior and after a market ‘holiday’. We all know what happened in 2022, so caution is advised. We also know what happened in 2020, and if you hadn’t already sold, Monday was your last chance to exit before everything dropped off the cliff.
Last week was an ‘easy’ UVXY or UVIX buy on Monday, but then it got tricky.
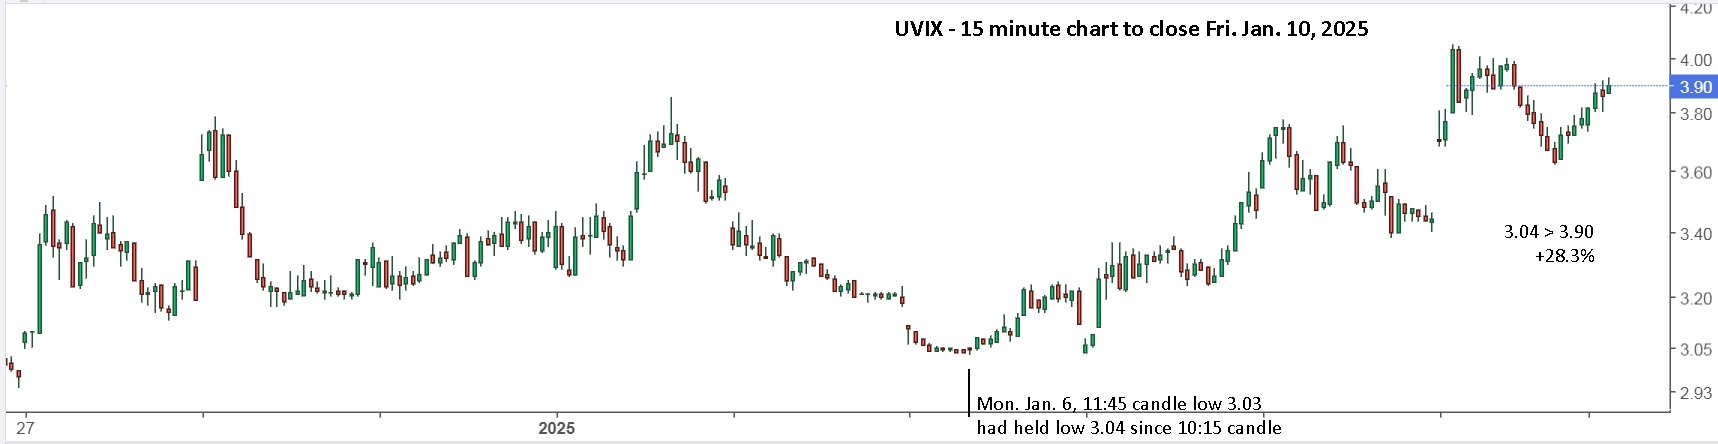
Buying the floor on Monday with a stop, after selling your longs with a stop buy higher was about as relaxed and slow as this trade ever gets. The sharp drop late in the day had me nervous and holding a minimum position for Tuesday. The markets gapped higher on Tuesday and fell, providing a perfect opportunity to go short and hold for Wednesday.
As mentioned earlier, Wednesday was generally bullish for the markets as they put in a higher low and pushed up. UVIX made its high of 3.78 at 10:15, dropped to 3.40 (-10.1%), then turned up at 11:45 with the markets turning down. When it’s ‘game time’ with UVIX, you really need to pay attention and get back in if you sold the earlier high. Alternatively, simply stay in and ignore the 10% pullback. The markets made a lower low at 12:30 and UVIX made a lower high of 3.76 on a spike up from 3.70. That’s almost always a signal that the VIX trade is done, so it was best to sell.
With the markets closed on Thursday for Jimmy Carter’s funeral, and the markets now looking bullish, it was best to stay out of UVIX. I chose to re-buy some UVXY, just in case, happy to then sell lower, but with a chance to buy more lower like on Tuesday.
The sharp move lower in the markets on Friday, pre-open after a strong jobs report, had me suspicious all day. From 11:00 till 12:10, UVIX hit a ceiling of 4.00 3x, then fell steadily to 3.62 (-9.5%) and turned up sharply at 2 o’clock. The markets broke through the ceiling at 1:55 and reversed hard the next 10 minutes, back to what had been resistance at 1:00. That support broke at 2:45 then reversed 5 minutes later. Games were again being played, faking one direction then the other. When it broke lower at 3:10, it was clearly a sign to stay short.
If you bought UVIX Monday at 3.04 and held to Friday’s close of 3.90, you’re up 28.3% for the week. If you sold at 4.00 and re-bought at 3.65, you locked in +31.6% and are sitting on an extra +6.9%. It’s unlikely UVIX will open below 3.65 on Monday, but it could easily open 7% higher. If you completely messed up the trade all week, don’t worry, it takes time to get it right, even when it seems clear in your head what you should be doing. Remember, in 2020, UVIX went up over 1000% in a few weeks, so missing the first 30% is no big deal. In 2022, it went up over 100% in January, then went up and down for months, providing gains of well over 1000% with compounding trades. Be ready to get it right on Monday!
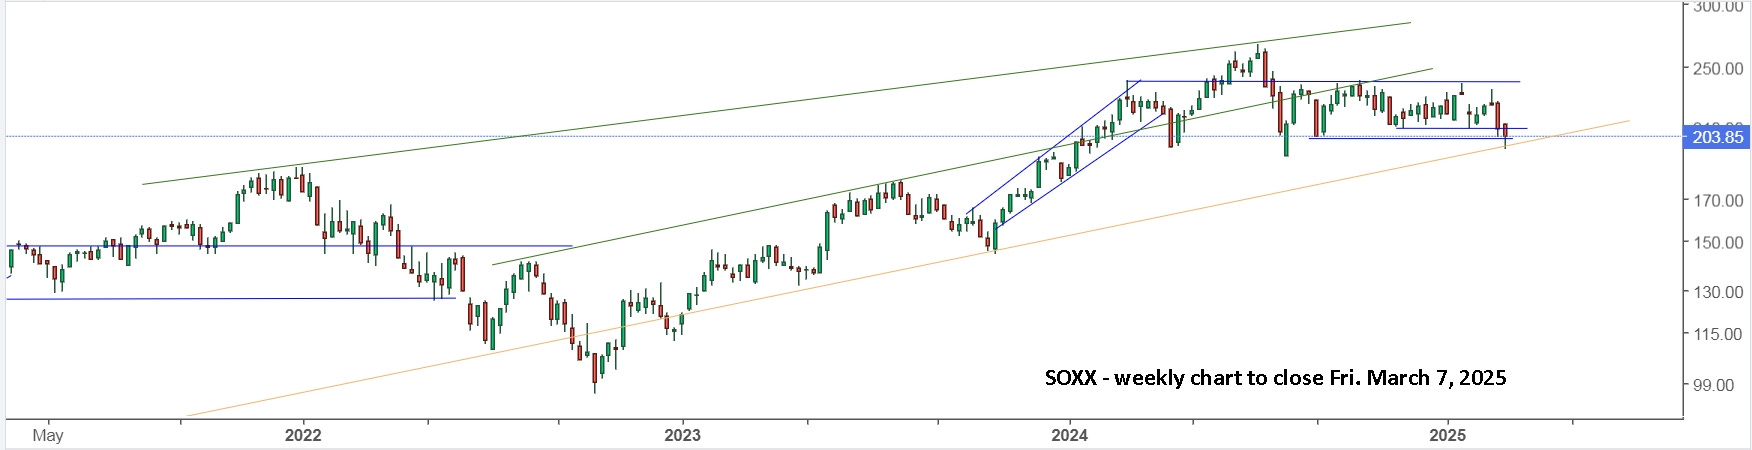
Update to Fri. March 7, 2025 : Prior weekly updates can be found in my more recent article, “Lessons learned in 2024 and 2021/22.” (Jan.11, 2025). This weekend, I decided a 6 month update from when this article was written might be appropriate. Here’s a daily view of the main ETFs.
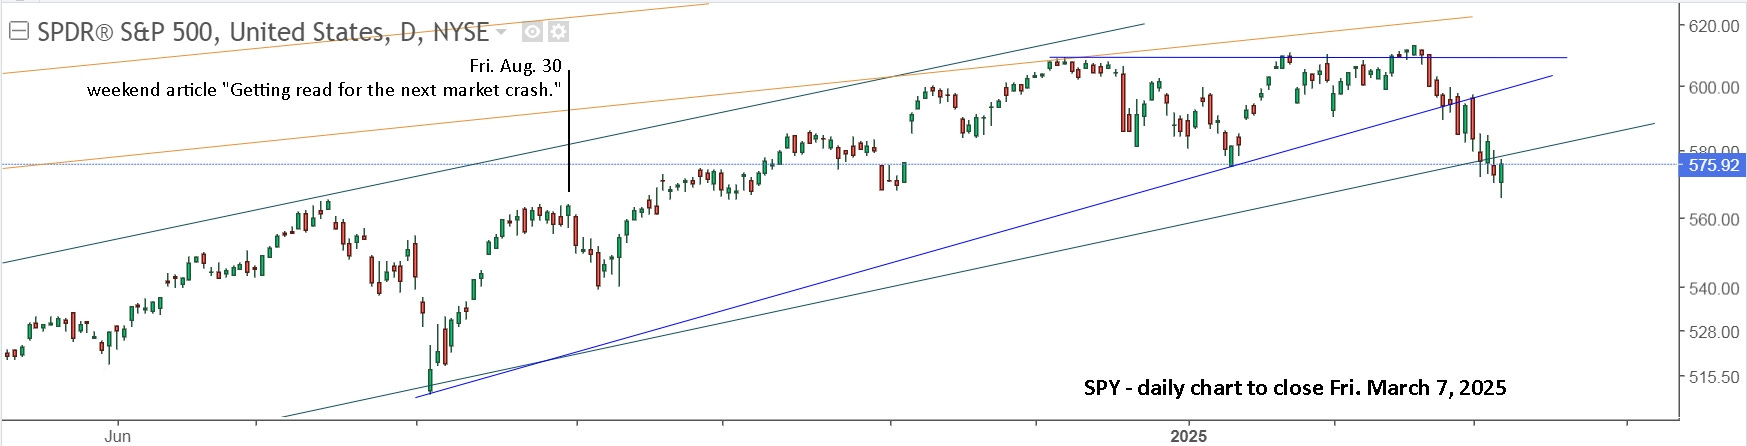
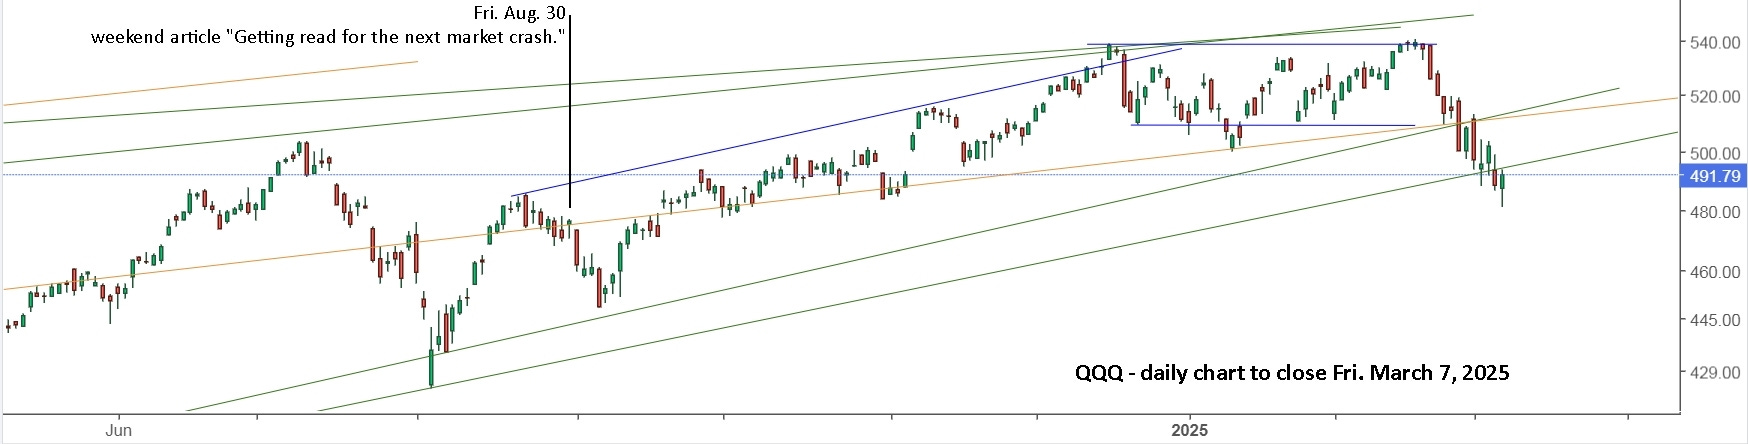
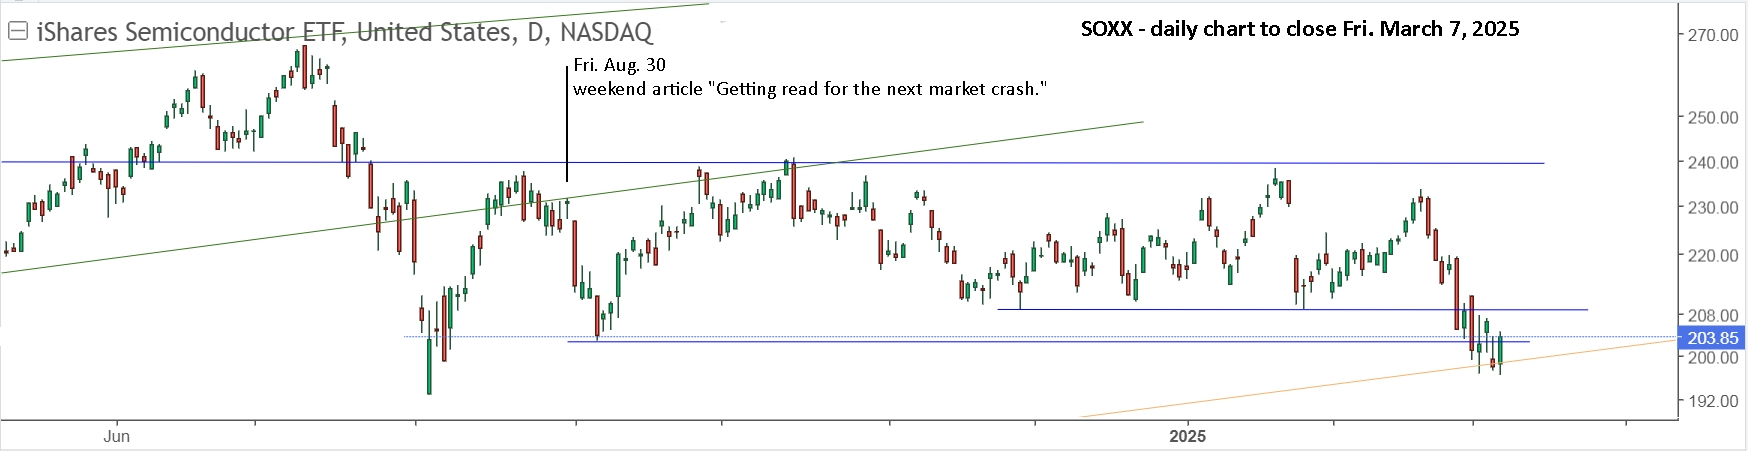
Since December, SPY and QQQ have been bashing into a hard ceiling and eaking out new all time highs. Telling everyone in early September to get ready seems like great advice. SOXX has been holding a horizontal range since then, and may be on the verge of going lower, but it is now at monthly rising support. Here’s a weekly view.
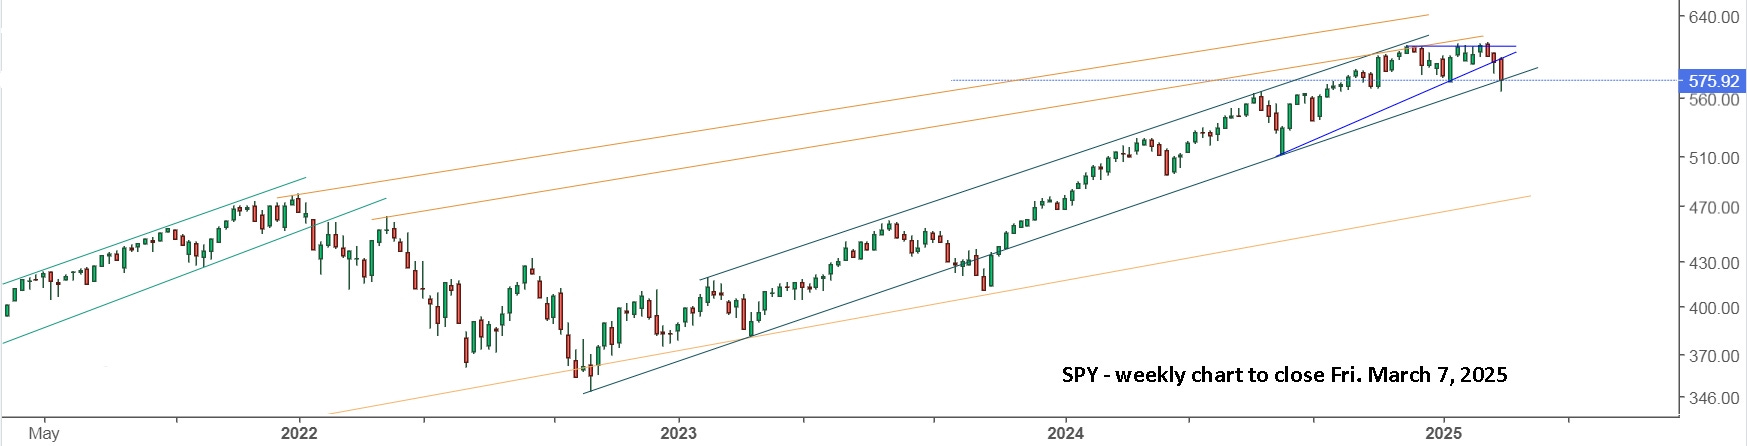
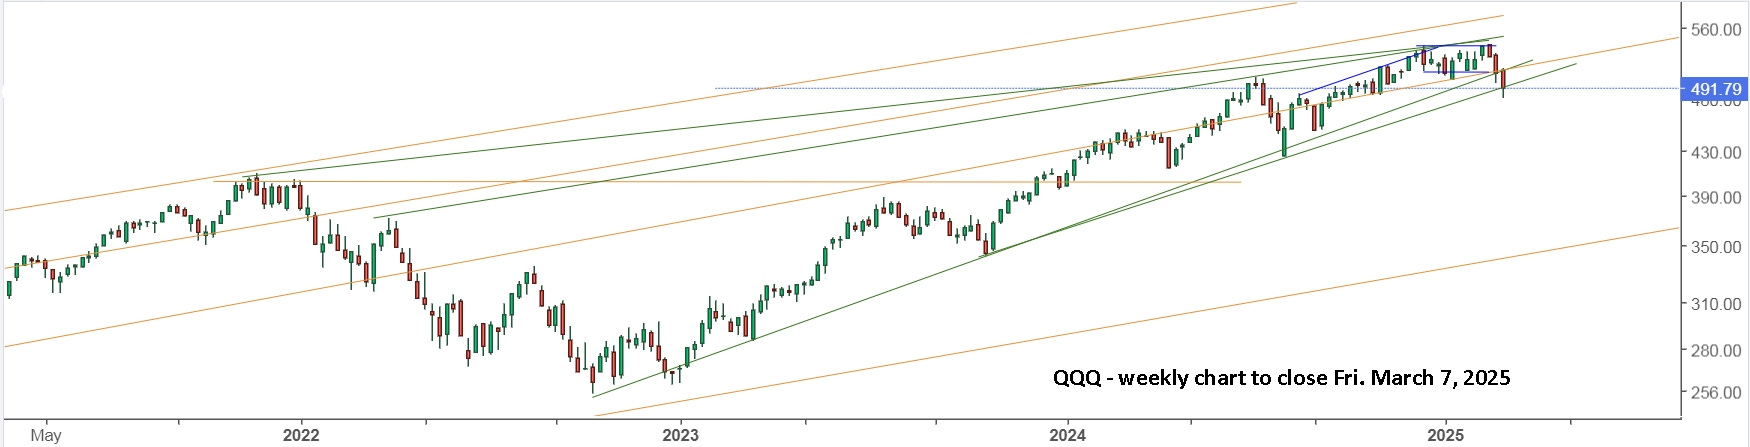
In the subtitle, I wrote “It may be months or years away, but now is the perfect time to get ready.”. It still may be months or years away, but the past 3 weeks are showing a lot of red, and the chaos and uncertainty with Trump’s tariffs and other bewildering Executive Orders has the markets on edge. Even without such a valid reason for a cooling off in the markets, SPY and QQQ have made an impressive move up since October, 2022, and are more than due for a cooling off.
SPY is down 7% in the past 3 weeks, from a very clear selling point. QQQ was down 11.5% from the recent new ATH to the low on Friday, March 7. That’s a substantial drop in 3 weeks, and it might be just the beginning. As always, you should be ready for a bottom and reversal, but it’s still advisable to be late rather than early, and then be holding on a gap lower and drop.
It’s also useful to consider the potential of another ‘lost decade’ on the horizon.

The above image is from the article, “From Bad To Worse: The Market's Sell-Off Signals A Darker Economic Storm”. As the above chart shows, the markets eventually move up. “The market may be falling now, but if there’s one thing that’s almost guaranteed, is that it will one day recover. It may take a while, and we can’t discard the idea that this could be the beginning of another lost decade, but ultimately, when stocks get cheap, you want to buy.”
My advice, don’t buy the dip. Be patient and wait to pay a higher price, but with more certainty that it’s a safe buy.
I think the SOXL idea is statistically better than UVIX since SOXL goes up most of the time while UVIX goes down most of the time. Buying early and setting a stop could be a very simple and profitable strategy for SOXL. However SOXL is known for wild volatility and will likely stop you out most days.
As for predictions of a market crash, I'll make one of my own but I don't plan on trading it. SPY is at a double top that is extremely obvious and the market has been going up for a long time. The market doesn't give obvious signs so I believe this is a bear trap. Any pullback will look like the beginning of a major crash, but will just lead to a new ATH.