

TQQQ/HQU - Leverage can be a useful tool.
Using leverage in many situations is beneficial. The same is true with investing.

Many investors immediately condemn the notion of investing with leverage. Buying a house is a leveraged investment, and it’s generally a good investment. You’re essentially making gains on the bank’s money while giving the bank a fraction of those gains in interest payments. Sure, it can backfire if you buy high and prices collapse, so you simply need to be careful. I don’t like using leverage within my trading account, since this can quickly go bad and you can get a margin call. Basically, you have to throw more money into the fire onboard a sinking ship. Buying leveraged ETFs is a completely different story.
I recently wrote an article, “$10k + 10min/wk +10yr = $1M“. When I got the idea, I had no idea what the outcome would be. I figured $1M was high with no leverage and low with leverage. As it turns out, I was right, but I guessed way too low for the leveraged number. Here are the 10 year returns for doing nothing. You simply bought QQQ, an ETF that follows the Nasdaq, or a leveraged version, TQQQ or TECL on Jan. 1, 2014 and sold the end of December, 2023.
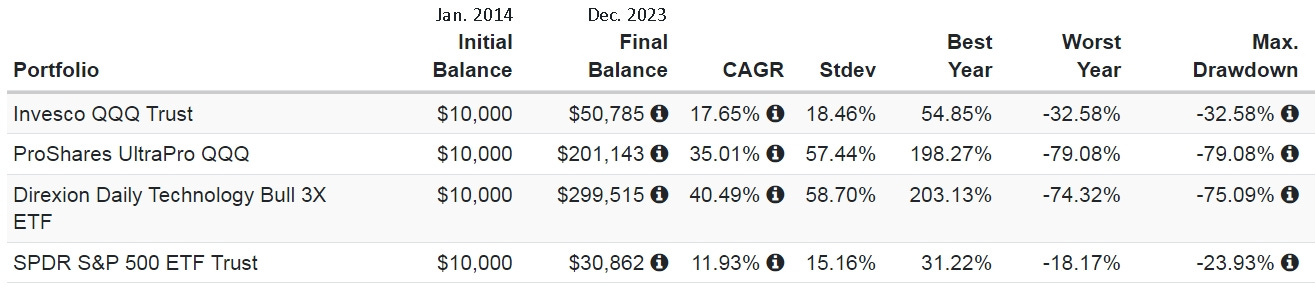
That’s an interesting result. TECL nearly hit $300k doing absolutely nothing, simply buying Wednesday, January 1, 2014 and selling Friday, December 29, 2023. In other cases where I went back in time and checked the returns from making a few trades, they generally gave a 3x higher final balance. In this case, QQQ yielded $153k on 7 trades, roughly 3x. TQQQ was a mind numbing $44.3M in Nov. 2021 with 16 trades. That’s a massive ‘lift’ using leverage, and just 16 trades over 8 years, checking once a week for 10 minutes or less.
Sure, you can say I’m armchair quarterbacking after the fact, but you can easily go back in time on a weekly chart, then click forward and make your own decisions, in advance, before you see the next week’s candle. You can even hide the dates and start at a random point, so you don’t have any bias. For me, I know for a fact it works, so I’m playing the game for real now.
To help you get a better idea of how the game can be played, let’s look at the 2020-2021 ‘season’. Then we’ll look at 2022 and 2023 to show that it works in both up and down markets. We bought the open on Monday, January 8, 2024, so you can follow the ‘live game’ as well. (Update to Fri. Feb. 9, QQQ +9.9%, TQQQ +29.9% if no trades.)
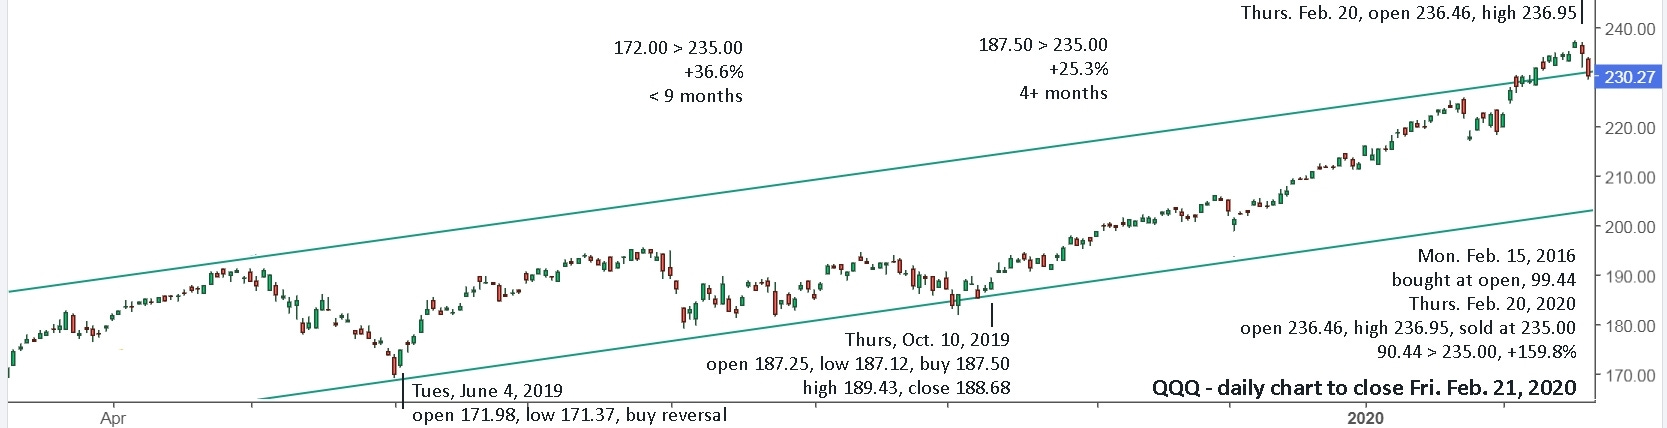
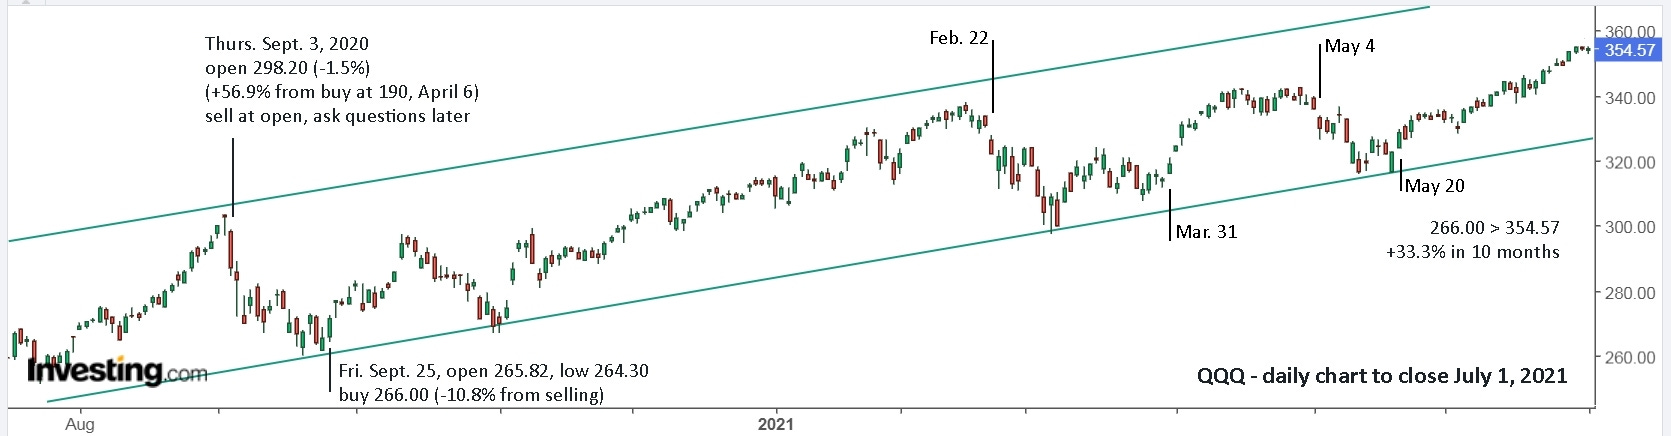
When trading leveraged ETFs, it’s important to watch the base, non-leveraged ETF. Here’s a look at QQQ to Feb. 2020. The trendlines clearly say sell, with no knowledge of covid or anything else.
Having watched the entire covid drop from the sidelines with all your money stuffed in your backpack, it was time to go shopping in March and April. After all, covid wasn’t going to be the end of the world and there was no reason for shares in major companies to be selling so cheap.
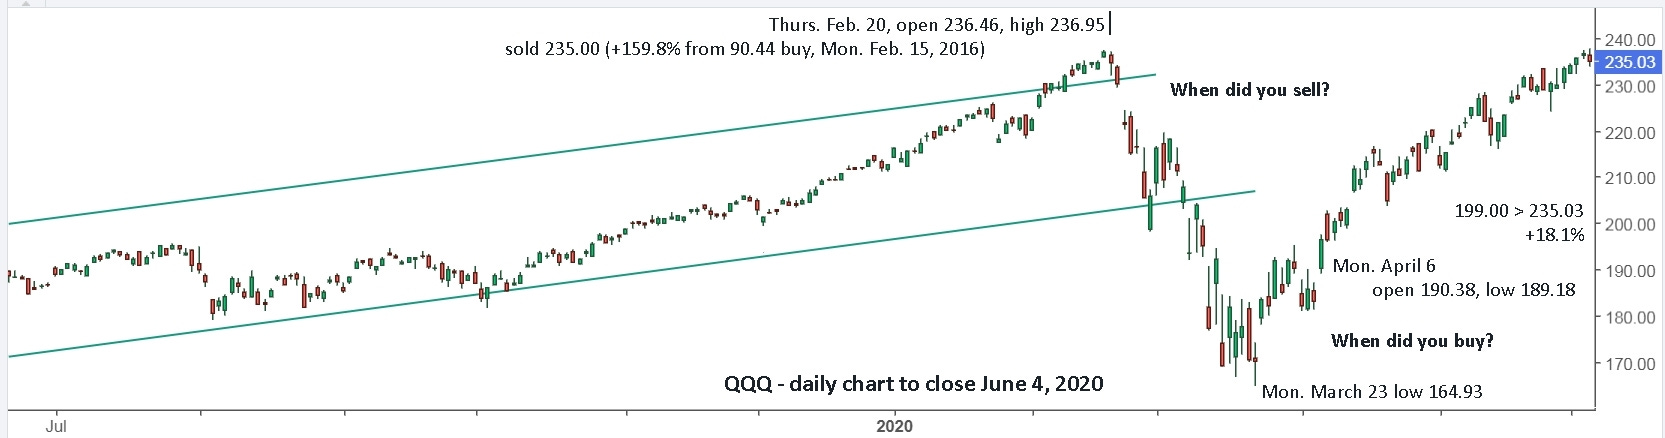
To present a conservative analysis, I assumed you waited until Monday, April 6, to buy TQQQ at 12.00, already up 48.7% from its Monday, March 23 low of 8.07 (-72.02% from selling at 29.00). Before we proceed, ask yourself some simple questions. Does it really make sense to buy and hold? Was it ‘obvious’ to sell in January or February, 2020? Was it ‘obvious’, or at least a good bet, to buy in March or April? Remember, you can sell soon after buying if it drops. Doing nothing had you back to even in just over 3 months. No drama. Selling and re-buying QQQ gave you an 18% return, which is more than many (most?) people get in a year. Buying TQQQ packed a return of 77% into your already stuffed backpack.
We’re going to continue assuming that you’re mostly watching QQQ and you don’t want to trade more than a few times a year. When it ramped up in August, 2020, most people would/should naturally start to wonder how high it was going to go, and were hopefully ready to hit the sell button at the open on Thursday, Sept. 3. No need to ask why it gapped lower, just sell and ask questions later. With QQQ you bagged 57% in 5 months, and with TQQQ a tidy 247%. Really! That’s the actual number.
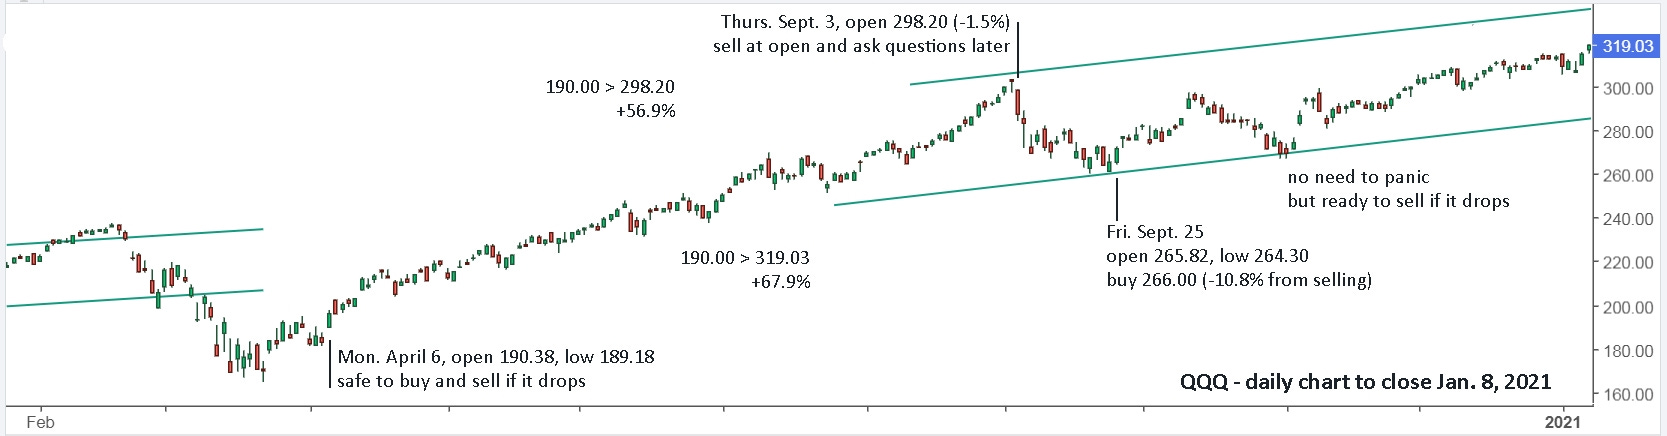
Once again, you decide if you want to sell and when, and you decide when you want to buy and which ETF you want to buy. For me, it’s no contest. I’m picking the racehorse, TQQQ. And remember, QQQ is a pretty fast horse compared to SPY, which follows the S&P 500. I think Friday, Sept. 25 was a good day to buy with it up from a possible double bottom the day before. If you didn’t buy then, you had another chance on November 3 at roughly the same price as it moved up after testing your support line for 2 days. That’s also when the line really gains some credibility, and can be trusted more going forward.
Fast forward 6 months, and you’re still cruisin’ down the highway. For me, when it gets close to the upper line and I’ve made terrific gains on paper, I like to be ready for a possible sharp drop, like the one on Sept. 3, 2020. When it gapped lower on Feb. 22, it made sense to sell TQQQ at the open (50.27), willing to re-buy if it reversed. Again, sell first and ask questions later.
Being conservative and patient on the re-buy, you might have waited till March 31 at 44.50, when it clearly broke the downtrend.
Remaining cautious, I would have sold the gap lower on May 4 and bought the gap higher on May 20. In the past, I generally tried to time the tops and bottoms, but it’s really not worth the time and effort. Again here, if you waited till April to buy, you still did fine.
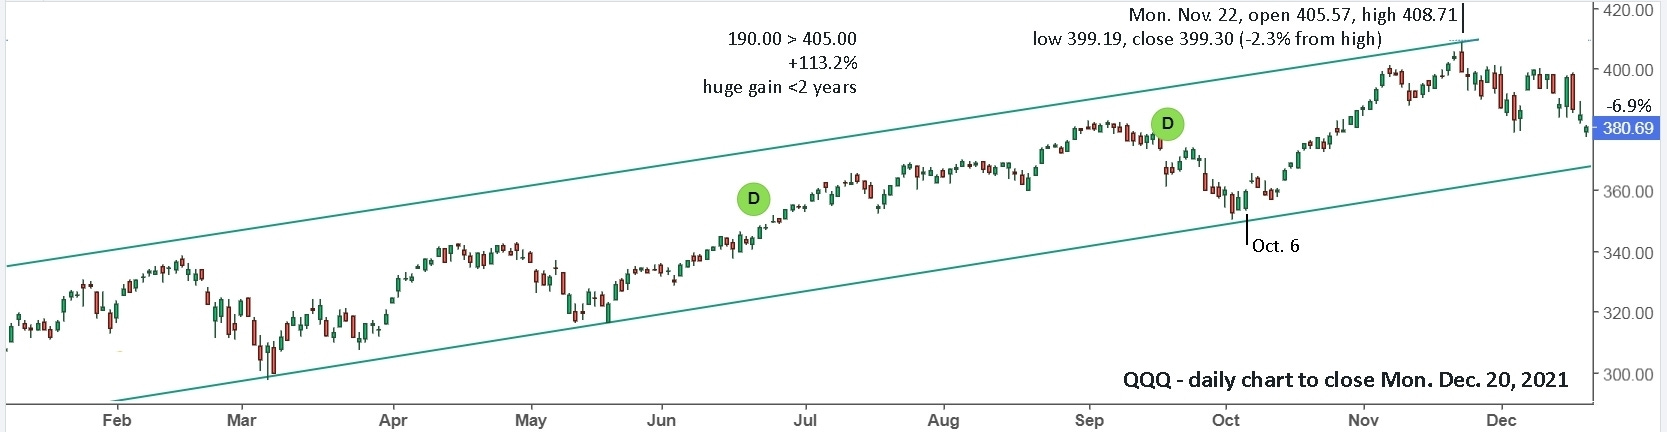
Staying conservative for this analysis, you would have sold the gap lower on Monday, Sept. 20, but in truth, I would have definitely sold on Friday since it was trending down for over 2 weeks. Selling early in the day and having it drop, leaves you comfortably on the sidelines for the weekend.
Without the trendline already drawn and extending into the future, there’s absolutely no reason to consider buying in early October. With the trendline, it’s very easy to confidently buy Oct. 6 at 60, as it moves up from a low of 59.63 on the day and a low of 58.24 two days earlier. As always, you decide when you would buy and sell. For this analysis, I picked the gap higher on October 14, to buy at the open price of 65.06. You could have also waited as it hit a low of 64.70, but that might have been in the opening seconds. You could have also used a stop buy at 65.50. Again, every jockey is different, but just about any jockey can ride TQQQ to stellar gains.
The run up from October 6 to November 5 was steep, +44.7% from buying at 60 to the high, 86.83. It’s also nearing the upper resistance line, so I’m ready and waiting to hit the exit. I would have likely sold November 9 at 85 as it fell from a high of 85.90 from opening the day at 85.63. It hit a low of 78.25 the next day, -7.9% from selling at 85, so a good decision to sell, then it roared up and I likely would have bought Nov. 12 at 80. For this scenario, we’ll keep it simple and sell on Nov. 22, where I am also definitely selling, as it falls from an early blow off top of 91.68.
That conservative scenario was 5 trades from April, 2020 to November, 2021 and turned $10k into $140k. Certainly worth the time and effort of 10 minutes a week.
To be fair, that was an exceptional run, worthy of a Secretariat comparison. The question one might ask now is whether TQQQ has finished racing or not. As you likely know, 2022 wasn’t a good year for anyone long the market. It was a great year for anyone going short, which is exactly what I advised over Christmas, 2021.
For years like 2022, you need a good barrel racer or cutting horse. It’s a completely different game. It generally requires a lot more effort, but it can also be extremely profitable. The alternative is to take the year off and wait for the next possible ‘racing season’.
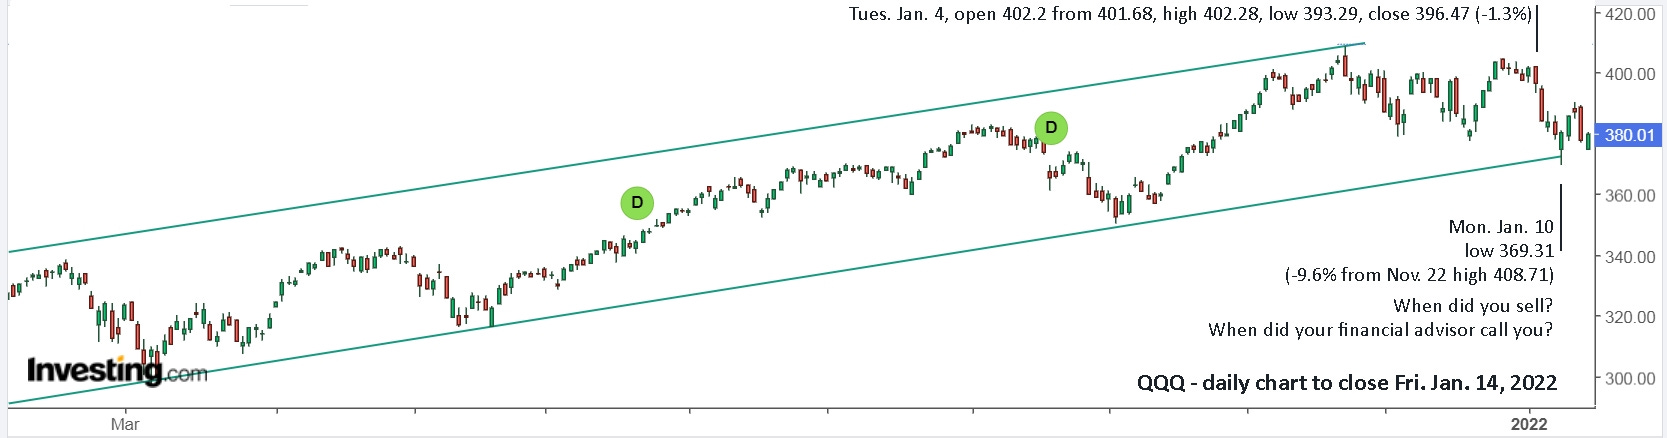
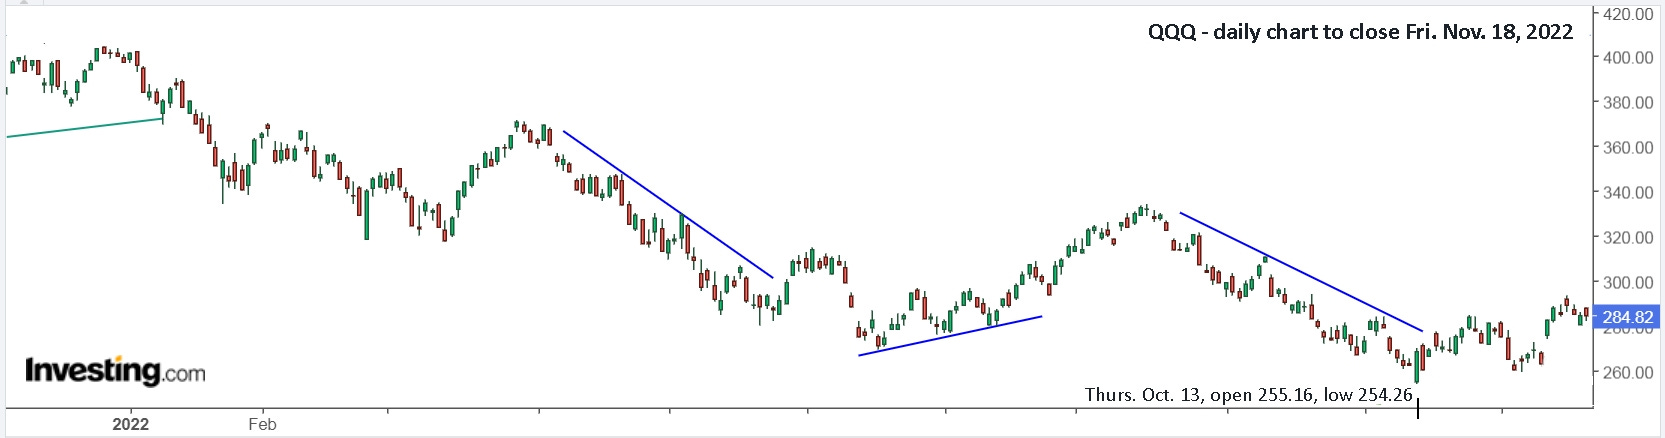
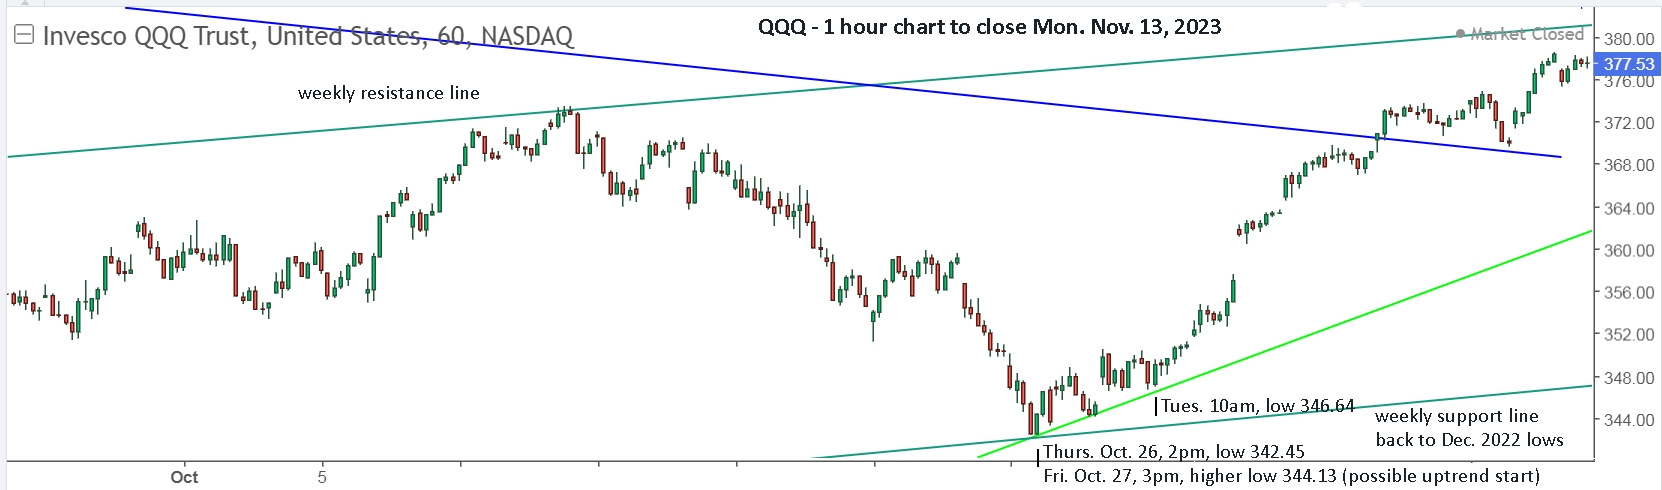
Before moving on to 2022, let’s check to see who took my advice over Christmas and sold QQQ at 400. If you didn’t sell then, did you sell the drop or are you still holding? What’s your plan for Monday? This is your weekly review. You passed on 2 weekly reviews suggesting you sell around 400, what’s your decision now?
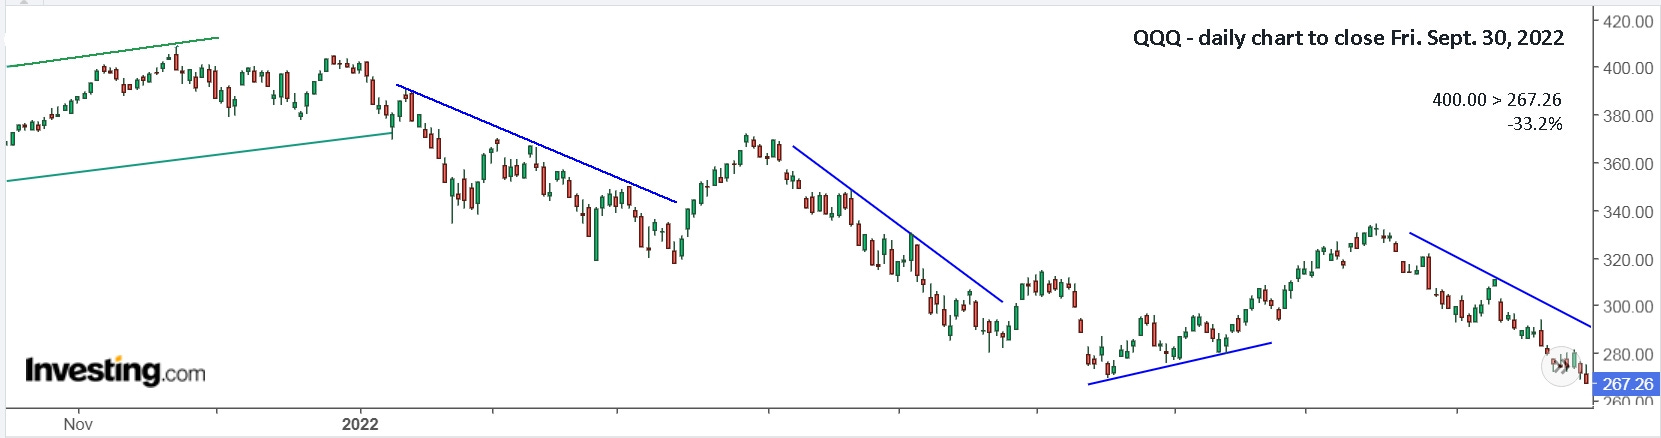
This is what the ride down looked like. For anyone who doesn’t want to trade often, you’re still on the sidelines from selling at 400. The markets are clearly in an extended downtrend, so just sit back and let it fall. For those that enjoy a little rodeo, you can see pretty clearly where you might have bought and sold.
Now let’s see when you might have gotten off the couch and back in the game with your racehorse.
Since the Oct. 13th low, there have been consecutive higher highs and higher lows. You can also draw parallel upper and lower trendlines moving up. Let them be your guide. I suspect some jockeys were already out the gates on November 10, when it gap opened higher and moved up. Let’s see if the race is on, or if it was a false start.
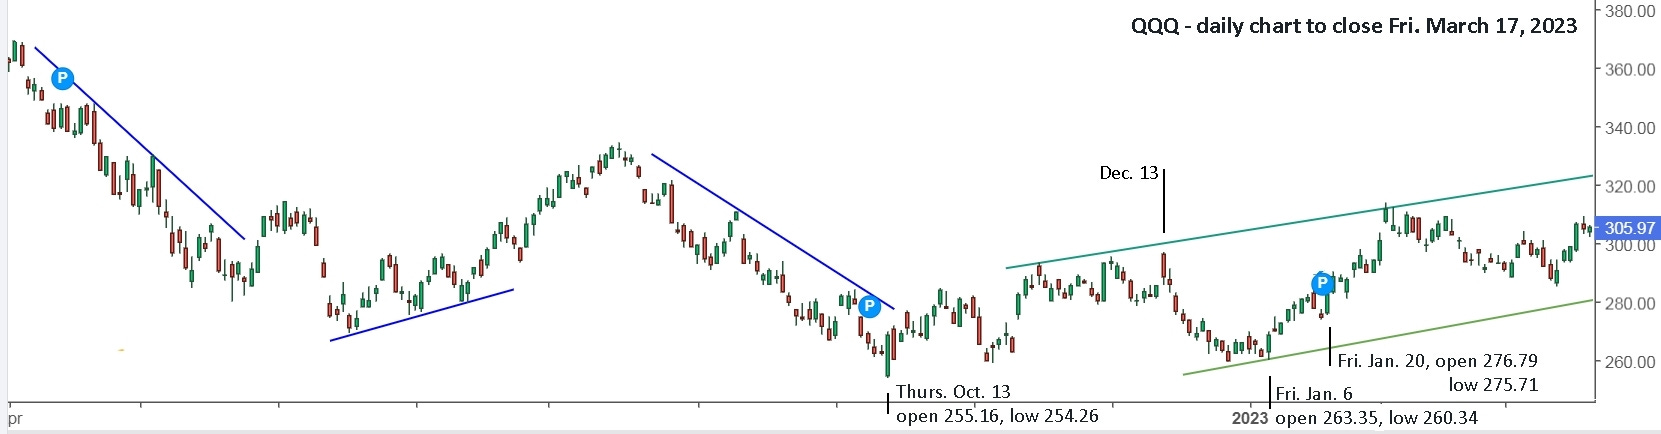
All the jockeys who jumped early made gains buying and selling, then the lights went out from a big gap higher on December 13 and it was almost all red after that till the end of the year. The starter pistol was finally shot on Jan. 6, and all the good jockeys were ready and waiting. The day before gave you a second point for a new trendline, parallel to the upper trendline through the November and 2 December higher highs.
When you’re up 61.6% on Feb. 2 and hitting the upper trendline, every good jockey is ready to rein his horse in and take the winnings off the table. Once you’re comfortably back in the middle of the track, time to get back in the race.
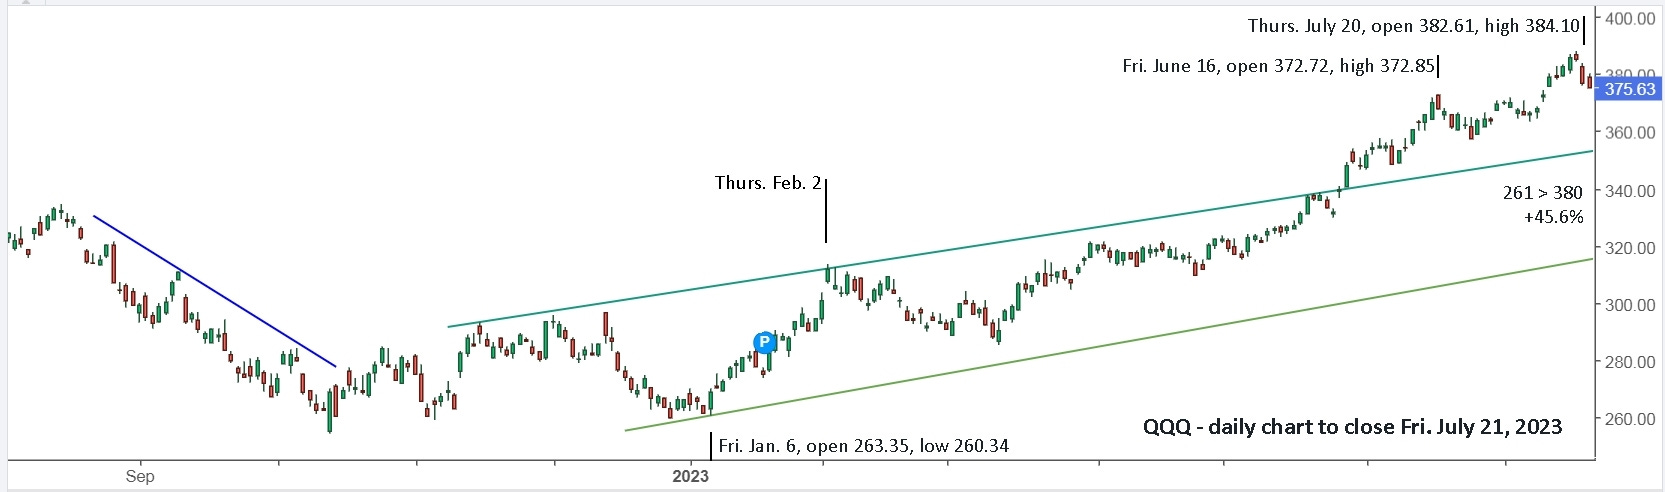
The week of June 12, as TQQQ (and all the other racehorses) flashed higher and higher, I was ready and waiting to sell the gap higher on Friday, June 16. I also went short with SOXS, my preferred ‘cutting horse’. Over the weekend I wrote, “Are you ready for a market drop?” And note that I wasn’t expecting a crash, just a drop. All ‘jockeys’ should have sold the gap lower open on July 20. I mean, no horse can run up forever without a rest. Staying on a ‘horse’ as it rests and falls costs you money. Get off the horse and keep all your winnings safe.
Once again, there are good gains to be made when the markets drop, and my favourite trade is with UVXY. My last article is “Volatility can be super safe and life changing.” For most people, still on the Merry-go-round, it’s a pretty wild horse to try riding. QQQ is a better first step for them, but if you’ve gone back in time, tried it and are confident you can ride QQQ, then you might as well ride TQQQ.
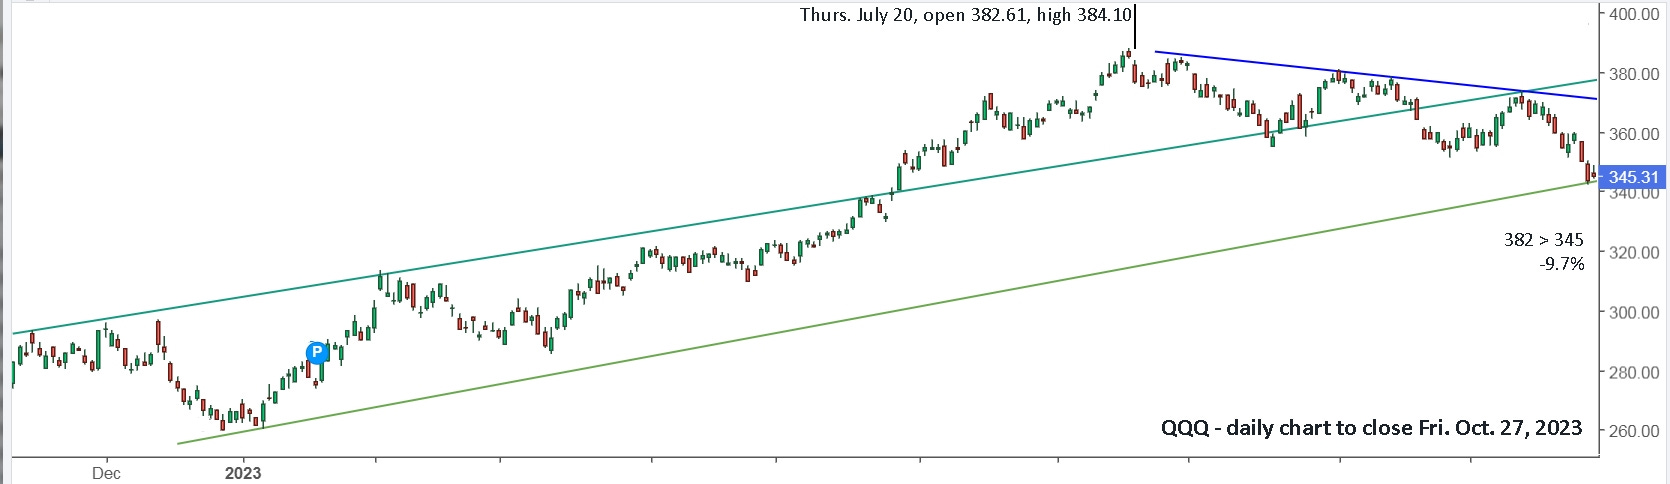
Note also, that without a lower trendline visible on the active chart, all you see is a cliff in front of you. There is absolutely no reason to even think about buying. With the trendline showing, it’s a completely different picture. For me, that was my ‘missing piece to the puzzle’. In my weekend update, I noted the higher high and higher low on Friday from Thursday, and I was ‘ready’ to buy the following week, and did, but not with confidence.
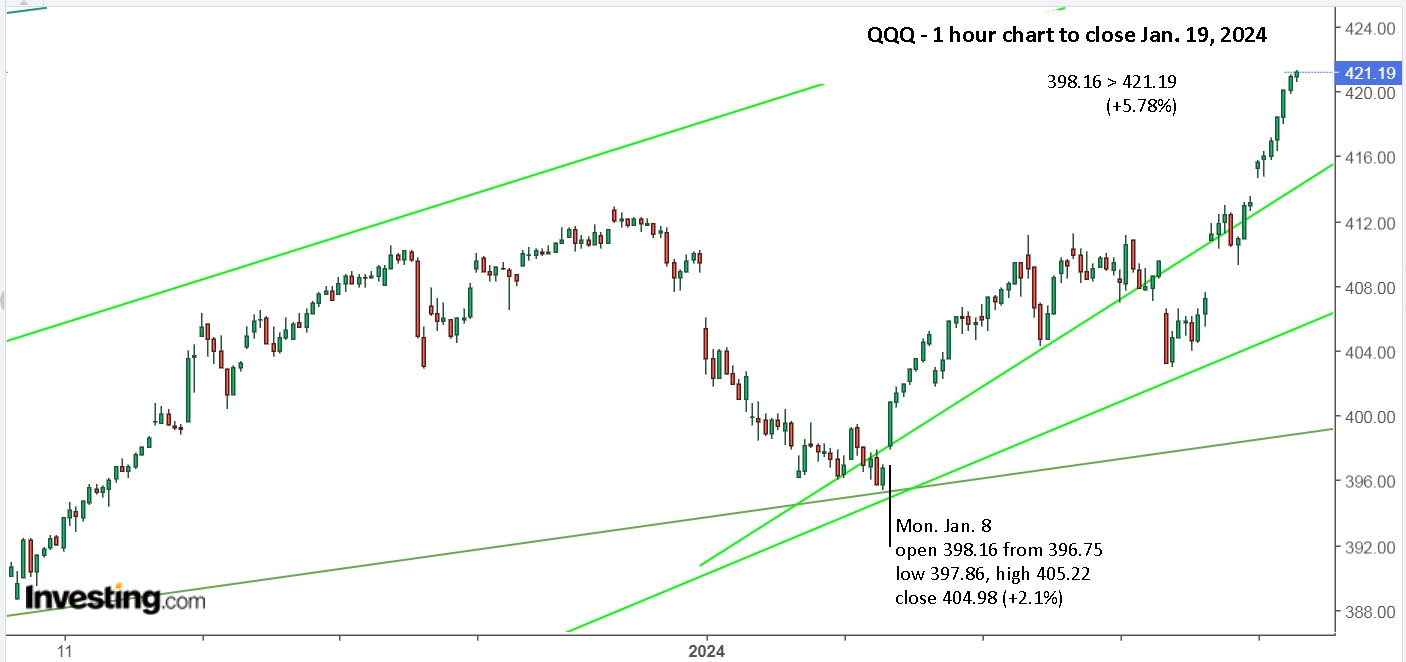
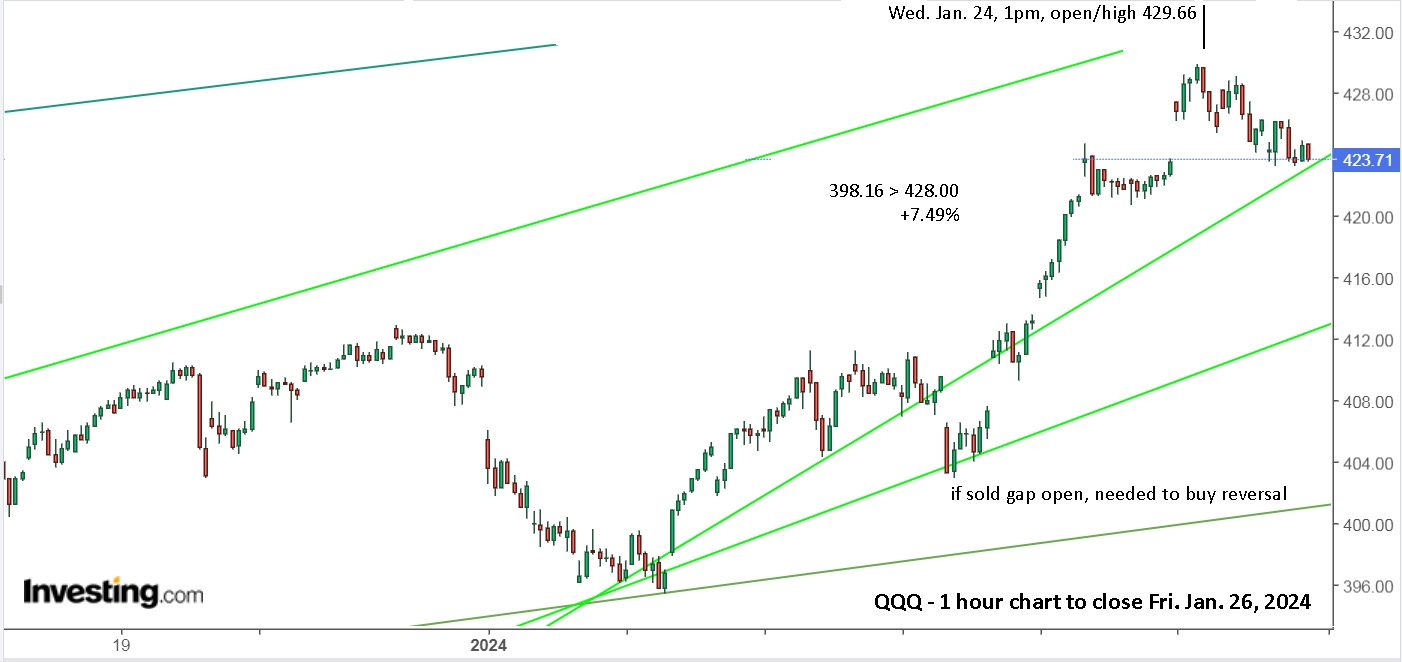
Zooming in to a 1 hour chart, you can see what a difference the active trendline can make.
I was worried about a further crash following the FOMC meeting on Wednesday. Of course I also knew it might just as likely shoot up after it, but I was guessing, instead of just keeping my eyes on the lane in front of me. Without the past trendlines showing, and the new light green trendline, your mind might see a steeper falling trendline through the higher close on Tuesday. That has you watching for a reversal. Seeing the light green trendline changes everything. With that line showing, I would have confidently went all in again early on the Tuesday reversal. No need to wait and buy higher with it touching support. Buy at support and, if it breaks lower, then sell for a small loss. As it continues up each hour, you’re totally relaxed and enjoying the ride, knowing you can sell for a small gain or breakeven if it suddenly heads south.
It continued up and then held flat, gradually approaching the trendline, as opposed to a sharp drop back to the trendline. Keep that in mind for similar conditions in the future.
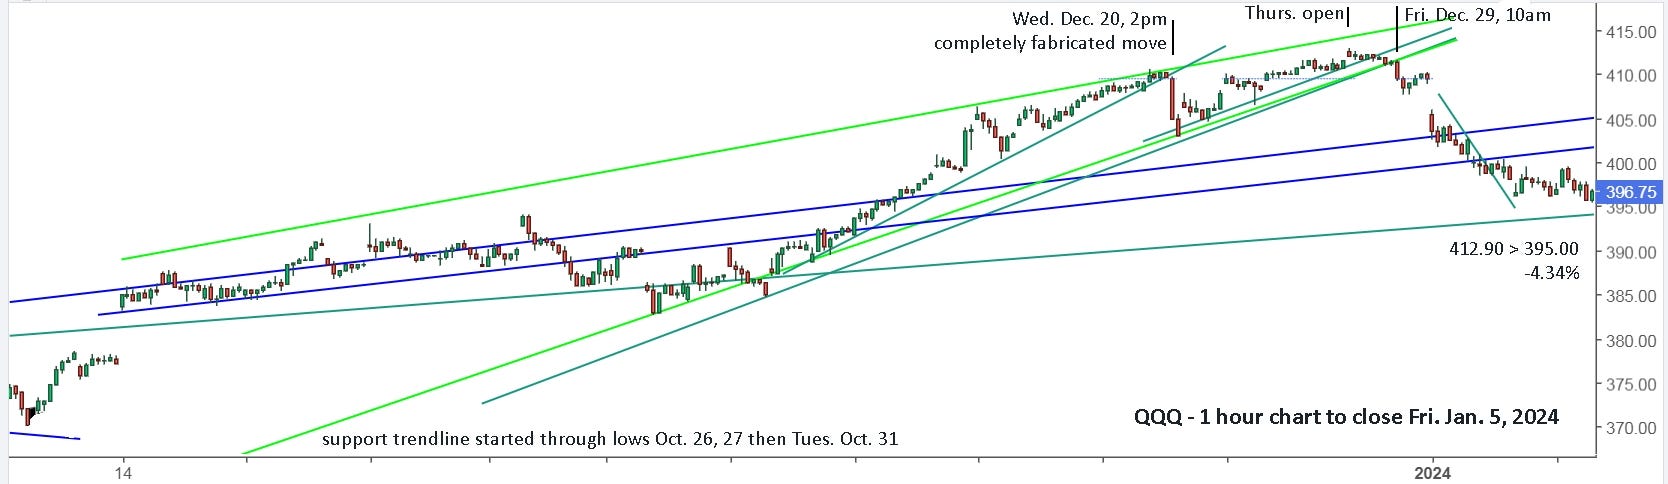
Having finally put lines on an active chart, I could almost see the future coming and it made my trades infinitely easier and more relaxed. On Wednesday, Dec. 20, I sold around noon, deciding that was enough for me. At the end of the day, after the sudden drop at 2pm, it was back to my ‘amazing’ light green trendline. I suspected the sudden drop was bogus, caused by traders during the holidays, so I gambled and bought back in. The next day I took the win as it slowly slipped from the gap up open. I then bought back in as it touched the light green trendline and held. When it gapped higher on Thursday, Dec. 28 and fell, I hit the exit, done for the year.
The above chart shows up to the close on Friday, Jan. 5. You then come up with a plan for Monday, Jan. 8 and that week. What's your plan?
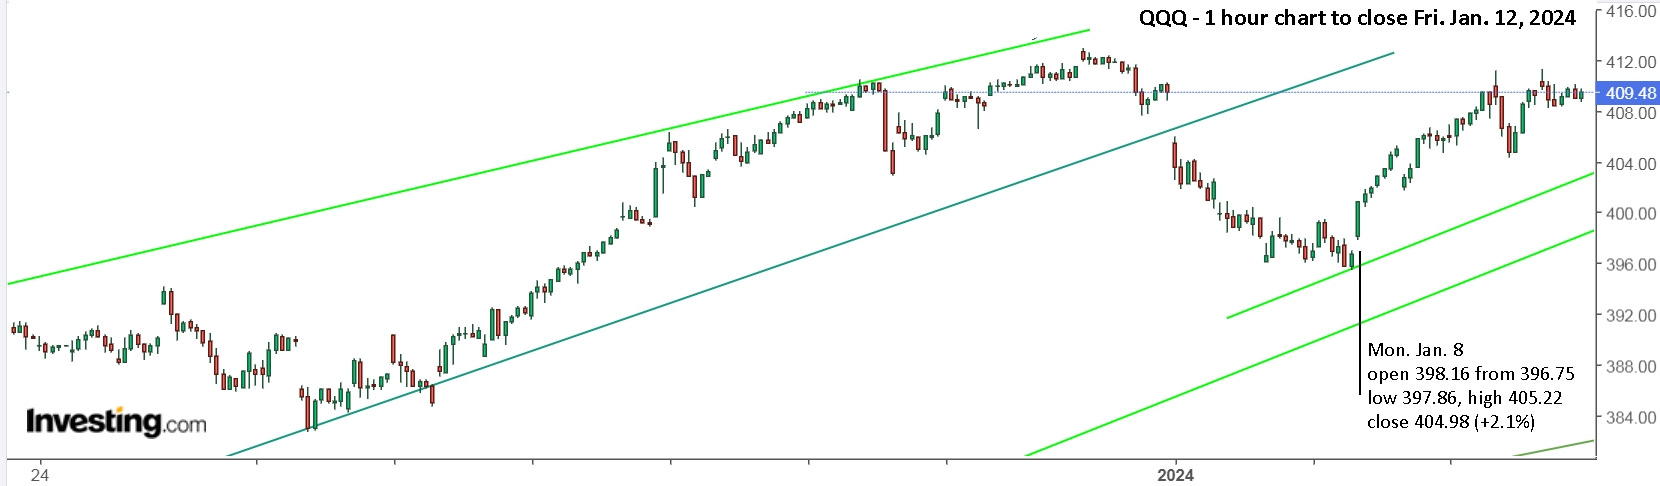
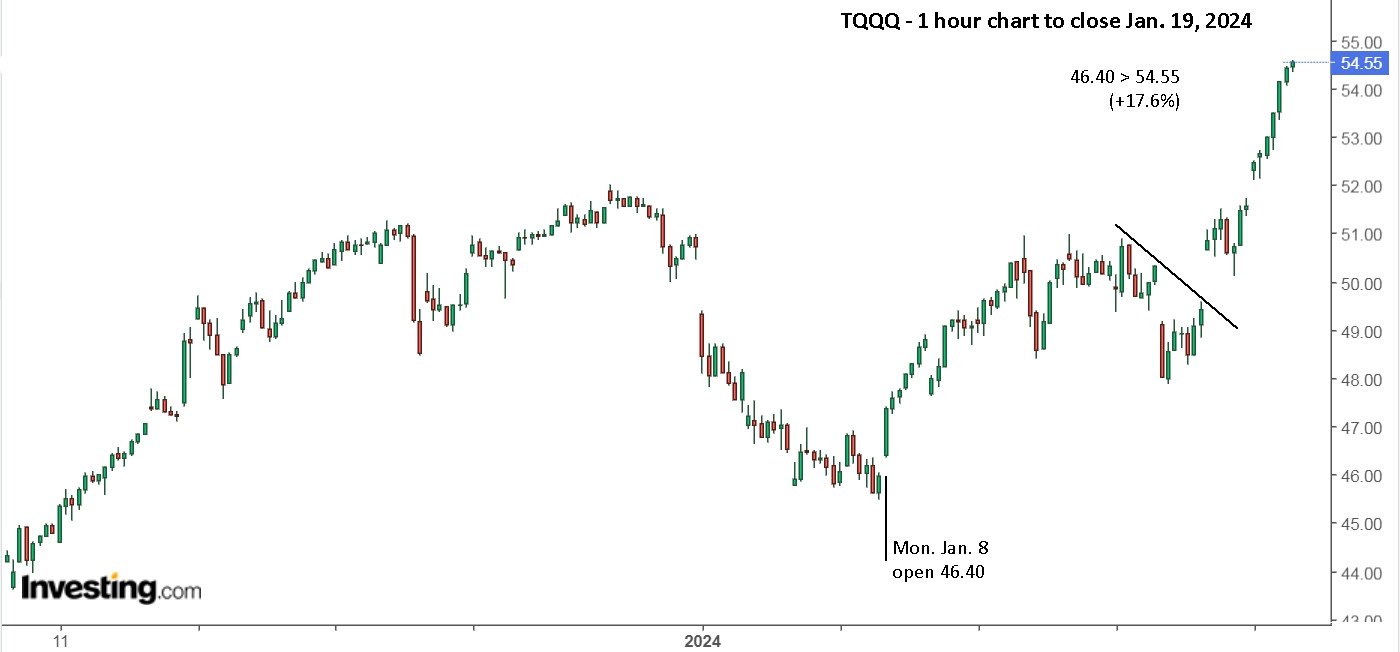
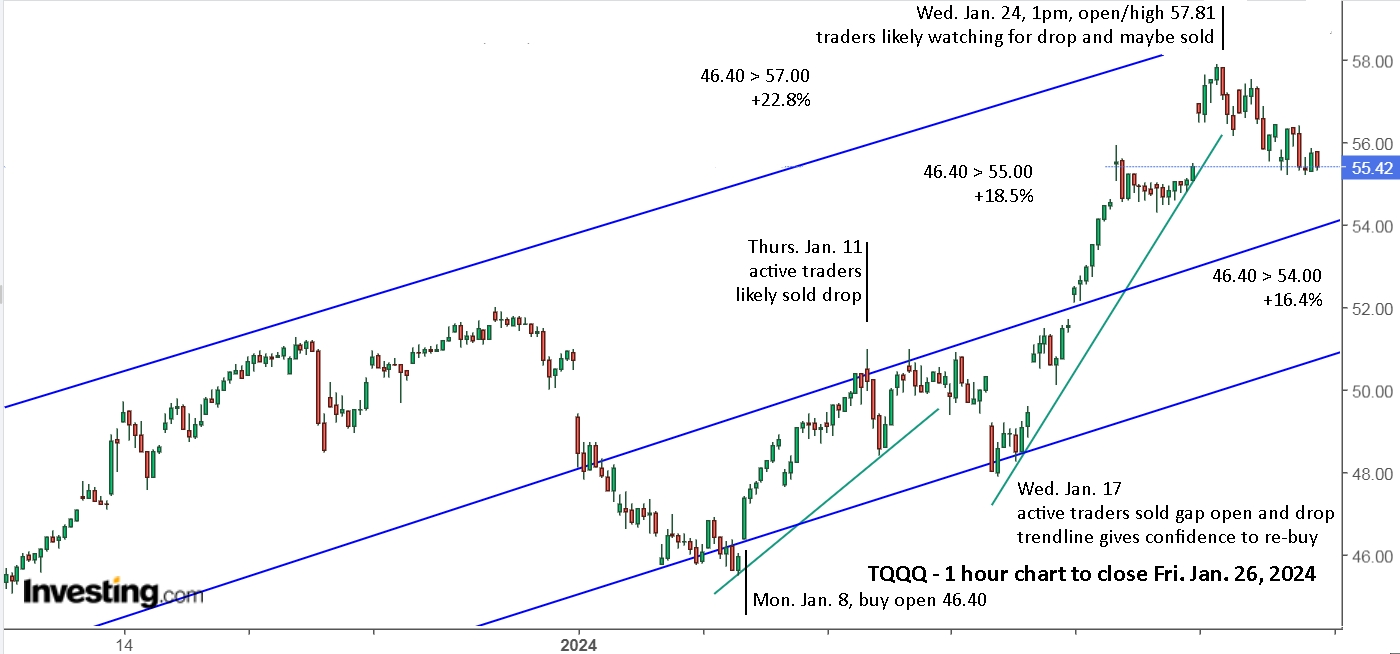
Did you act on it? Did you buy the open? With TQQQ, you’re now up 8.5% and enjoying the U.S. holiday Monday. I presume you also have a plan for Tuesday.
For me, as I said earlier, the missing piece to the puzzle was the active trendlines. Without them, I was constantly looking the wrong direction during trading hours. I would have a plan in my head from the weekend review, but that plan often went out the window and I hit the ditch because I couldn’t see the lines on the road. This is an absolute game changer for me.
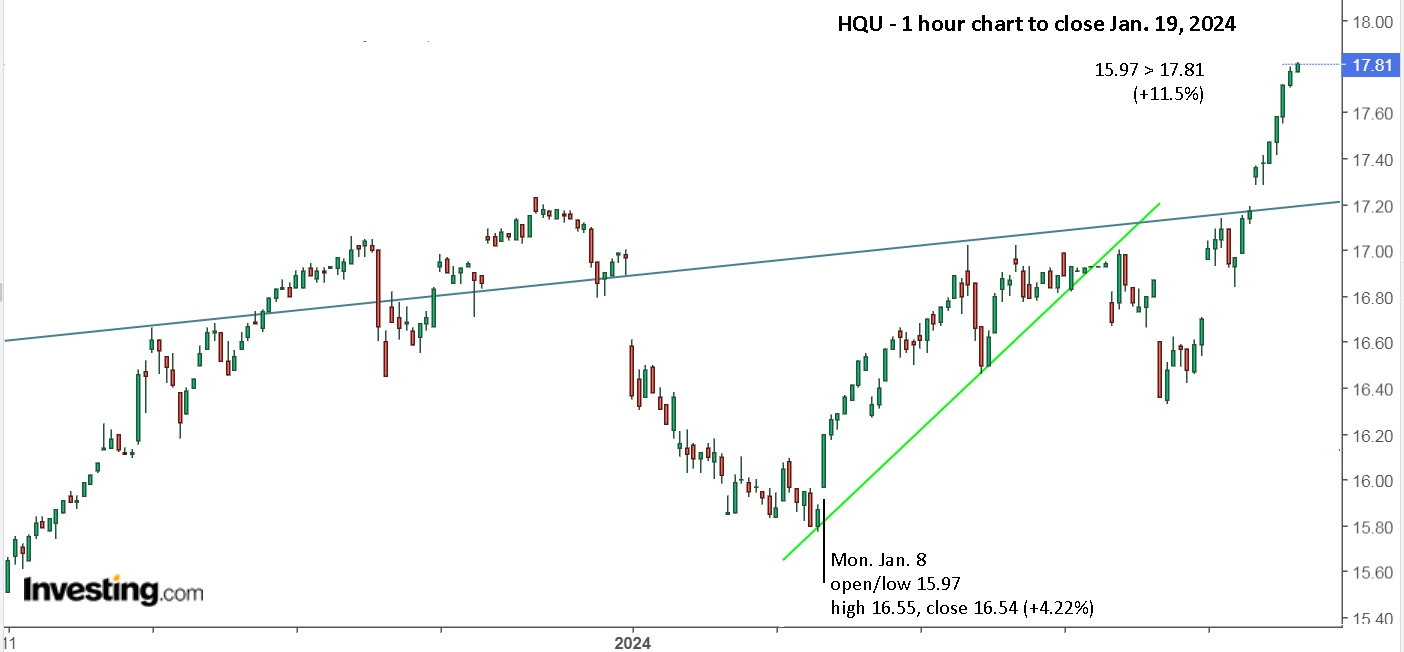
For Canadians, an equivalent but slower horse is HQU. It’s 1.5x versus TQQQ at 2x. Obviously, more ‘horsepower’, better returns, but racehorses aren’t as easy to ride. They’re jumpy. HQU is practically an old nag, barely moving through much of the day, yet, like the tortoise and the hare, it always finishes ahead of QQQ. Here’s a look at today, Monday, Jan. 15.
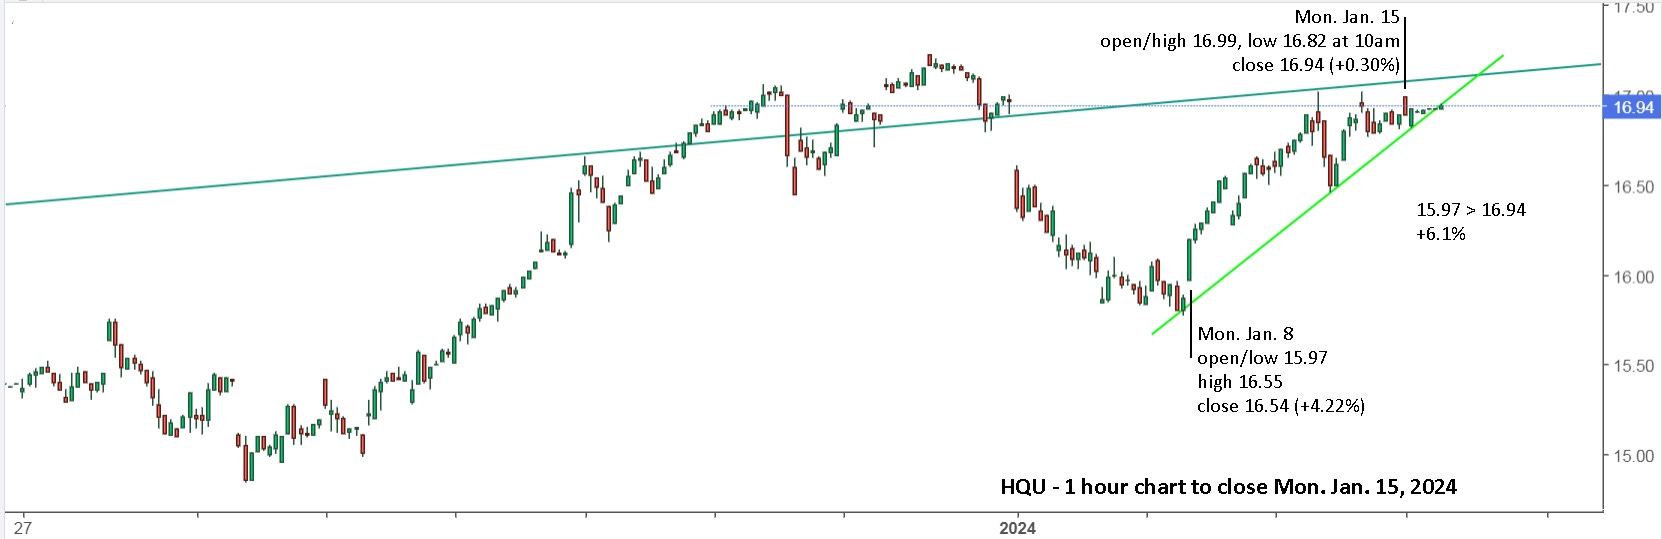
A gap up open and fall for 30 minutes that might cause concern, but it touched the support line at 10am and moved back up. So simple.
As it might run into some overhead resistance from the dark green line that goes back to the Sep. 9, 2023 high, and we’re WAY up from buying Monday, Oct. 30 at 12.30 (+37.7%), it would be prudent to be ready to sell. I actually sold Jan. 11 and re-bought at noon when it reversed. Make your call for tomorrow and the rest of the week, then come back here for a new chart along with my thoughts.
Before closing, I’d like to add that I’m not sure TQQQ will be an all star racehorse in 2024. It you pay attention to the trendlines and trade accordingly, I’m sure you’ll do well, but there might be a lot of sideways action. The beauty of trendlines is that you don’t make any predictions, you simply follow them. I’ll be watching some other horses, but I wouldn’t put a greenhorn on any of them.
Update to Fri. Jan. 19 : Well, that was quite a week if you were watching the markets, or it was a complete non-event if you had alerts set and didn’t check it at all. Last weekend, with TQQQ, you were up 8.5% and enjoying the U.S. holiday Monday. This weekend, you’re up 17.6%, after a 4.8% drop on Wednesday from a gap down open, that might have thrown you off your horse. Since it was still above the main trendline, there was absolutely no cause for alarm.
Note that without the extended trendlines showing and providing a reference, you may have sold the Wednesday gap open lower. If you’re trading more actively, you may have re-bought the reversal at 10am. Late in the day, you may have noticed a possible new downtrend line forming and decided to sell and take the extra win.
Then what? When it gapped higher on Thursday, you could and should be watching to get long again, but that wasn’t easy with the afternoon drop. It was also back to the December highs so the safe trading decision was to sell. All that effort, watching and wondering what to do. Simply checking on the weekend and setting alerts, left you blissfully oblivious to all the bouncing around.
HQU was also difficult to stay long, even with the trendlines. That’s why I recommend following the QQQ chart regardless of what you’re actually buying.
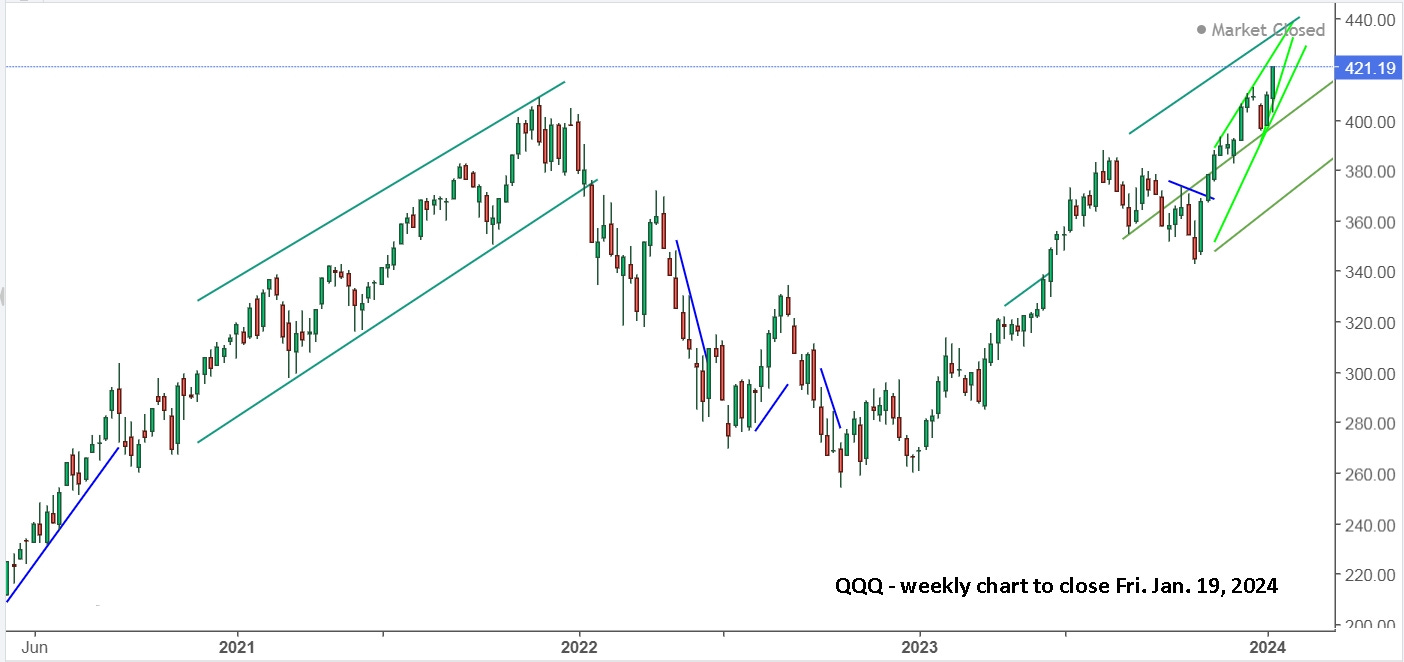
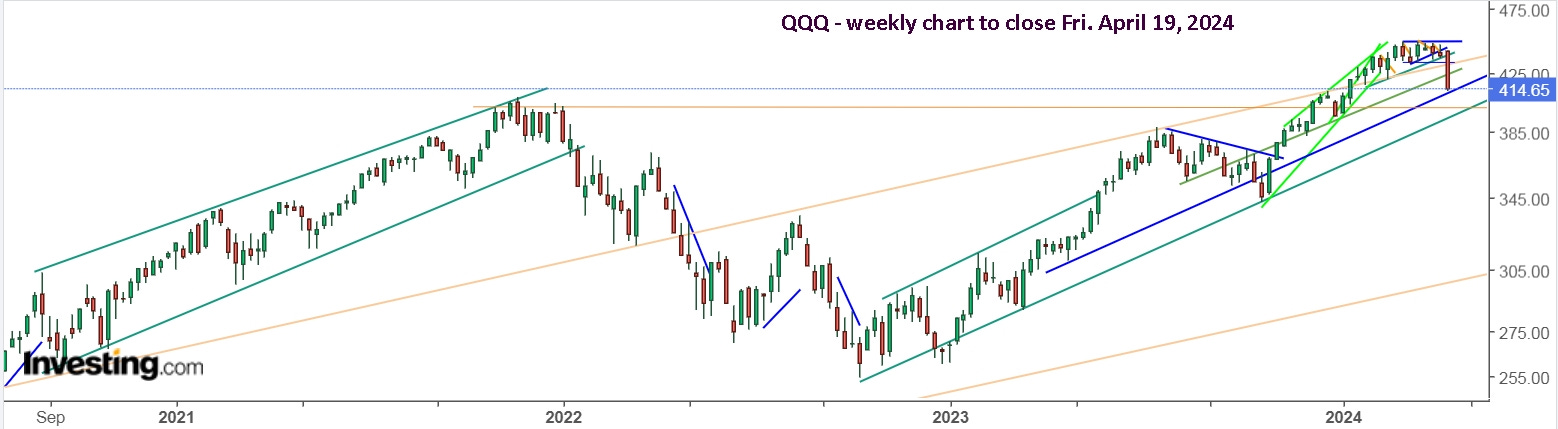
Here’s a weekly view for perspective.
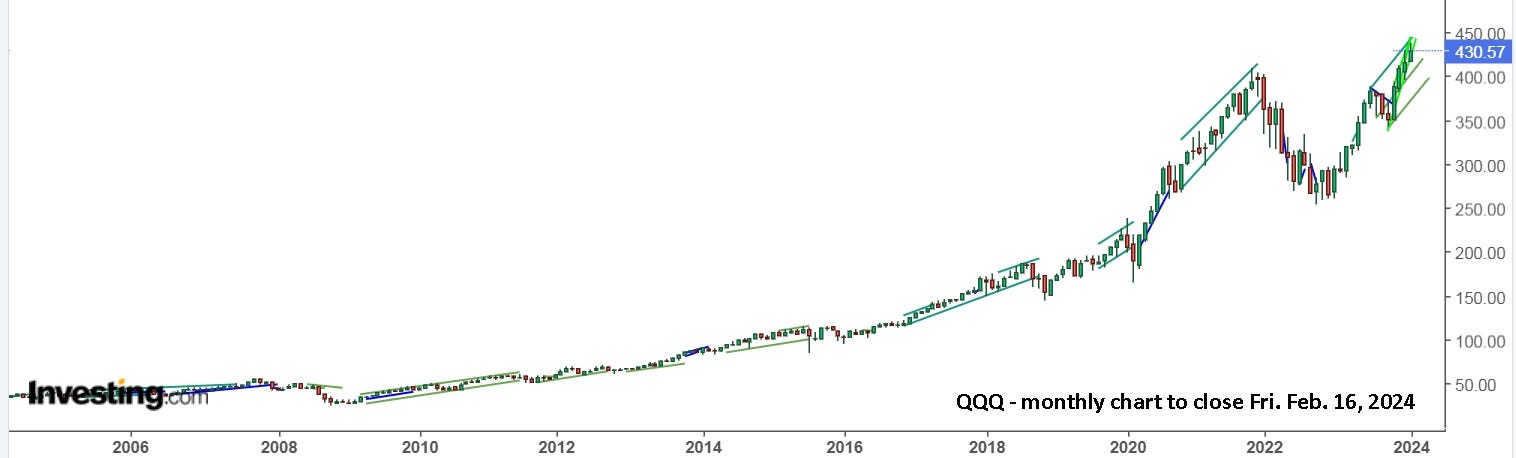
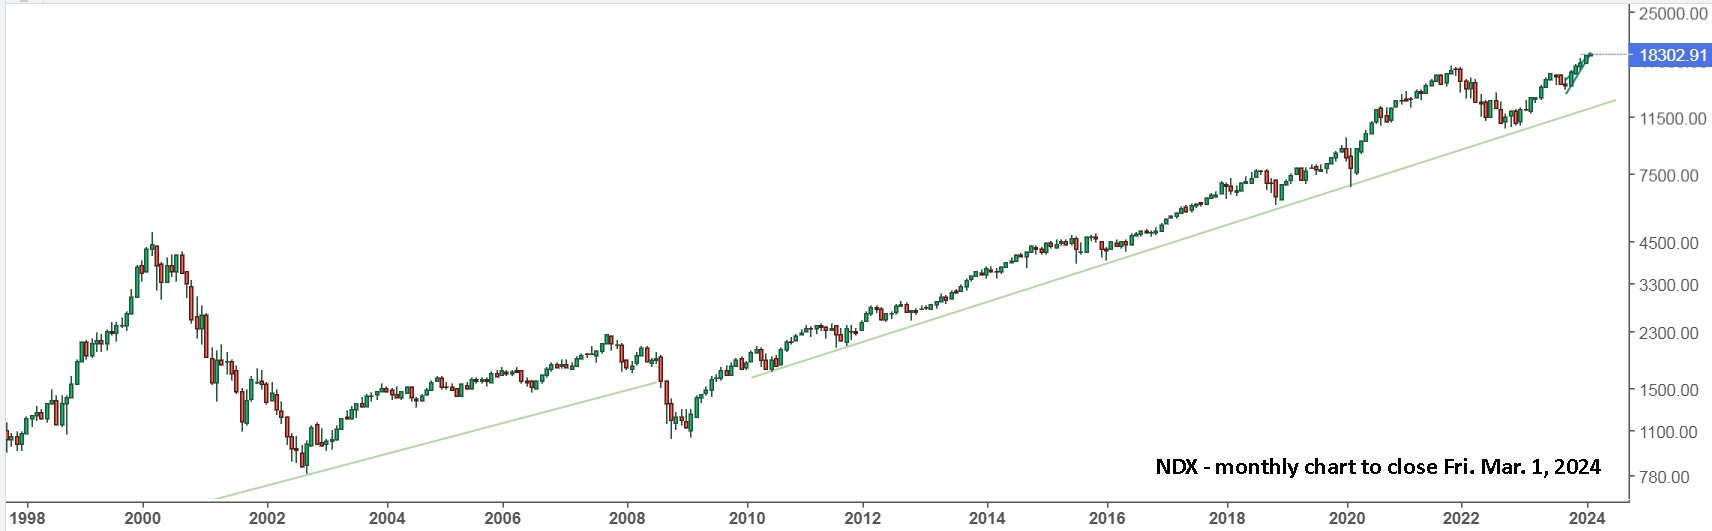
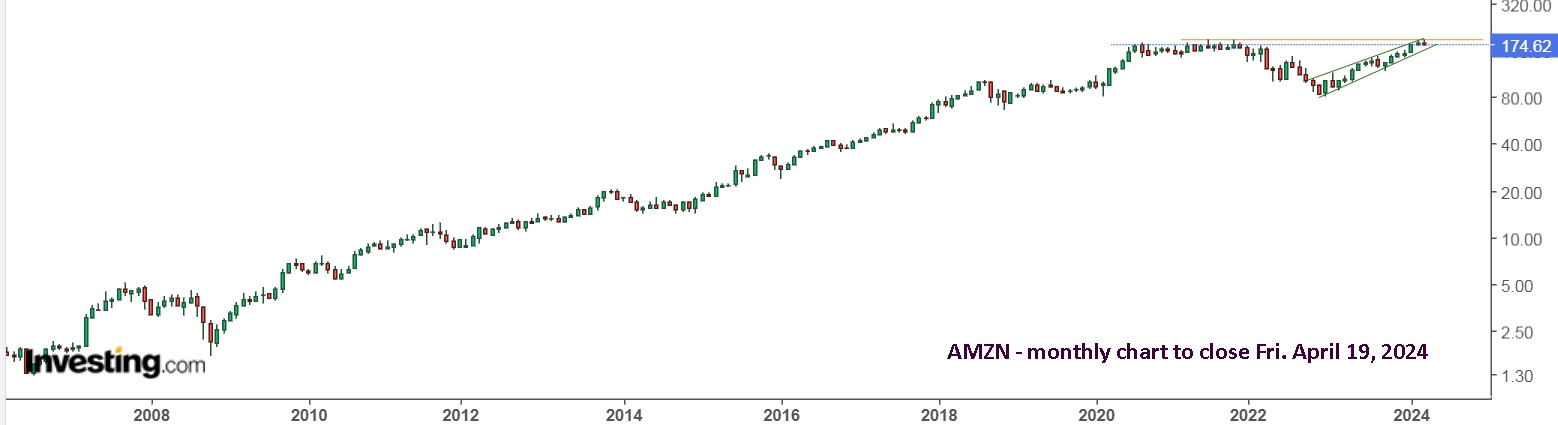
And a monthly view.
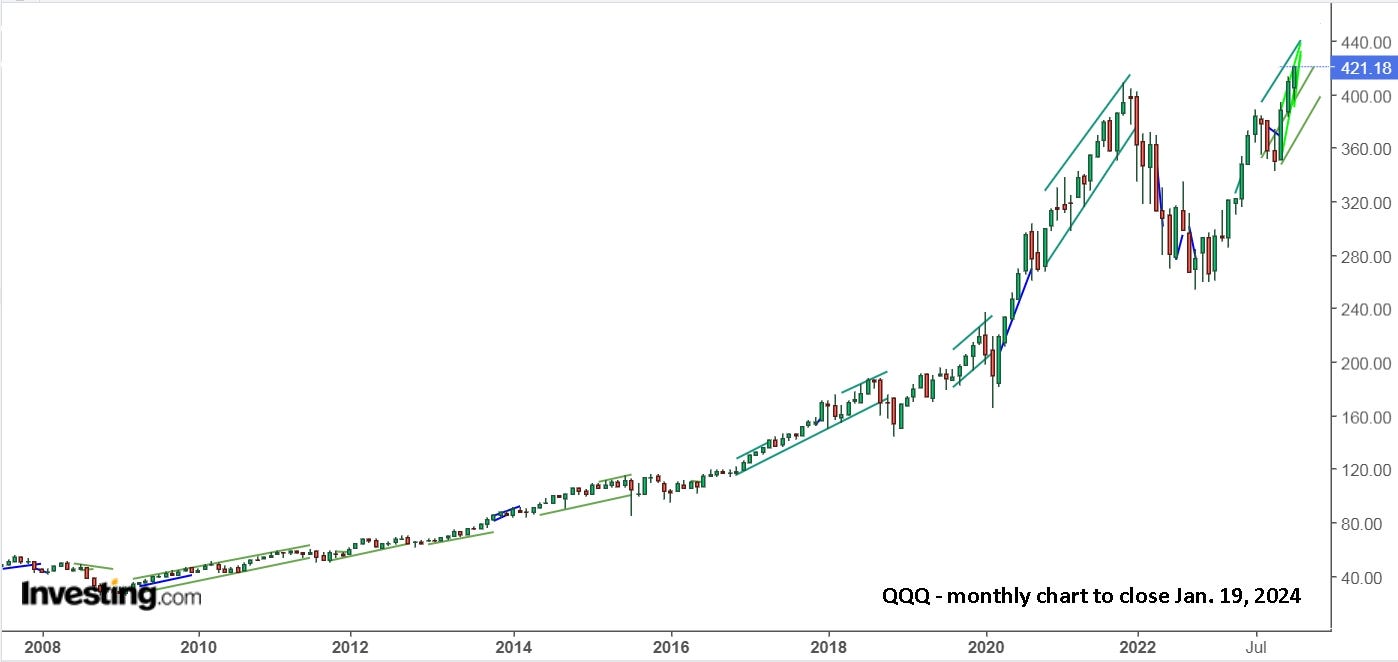
Rational minds might conclude that it’s looking rather parabolic and likely to make a big drop. Some people, in particular Steven Kaplan, an author on Seeking Alpha, has been calling for a drop since June, 2020. This is from his June 10 article, “Euphoria To Panic To Euphoria”. “It is as important to sell now as it had been at the most extreme stock-market peaks in history including August 1929, January 1973, March 2000, and October 2007. Whenever assets are dangerously overpriced, they are far more vulnerable to above-average percentage losses.” You conservatively went long QQQ or TQQQ in April, 2020. With just 7 trades, $10k turned into $600k with TQQQ. Even if you agreed with his analysis, but trusted your trendlines, that’s the return you achieved. Going forward is the same, simply trust the trendlines and don’t be influenced by what you think is going to happen.
It’s also good to remember QQQ dropped 54% in 2008. A similar drop would take QQQ back to 210, but Kaplan is predicting an 80% drop, like in 2000 (-83.6% from March, 2000 to October, 2002), taking QQQ back to 80. In the monthly chart above, the 54% drop in 2008 is a tiny blip. The weekly chart below looks a lot different.
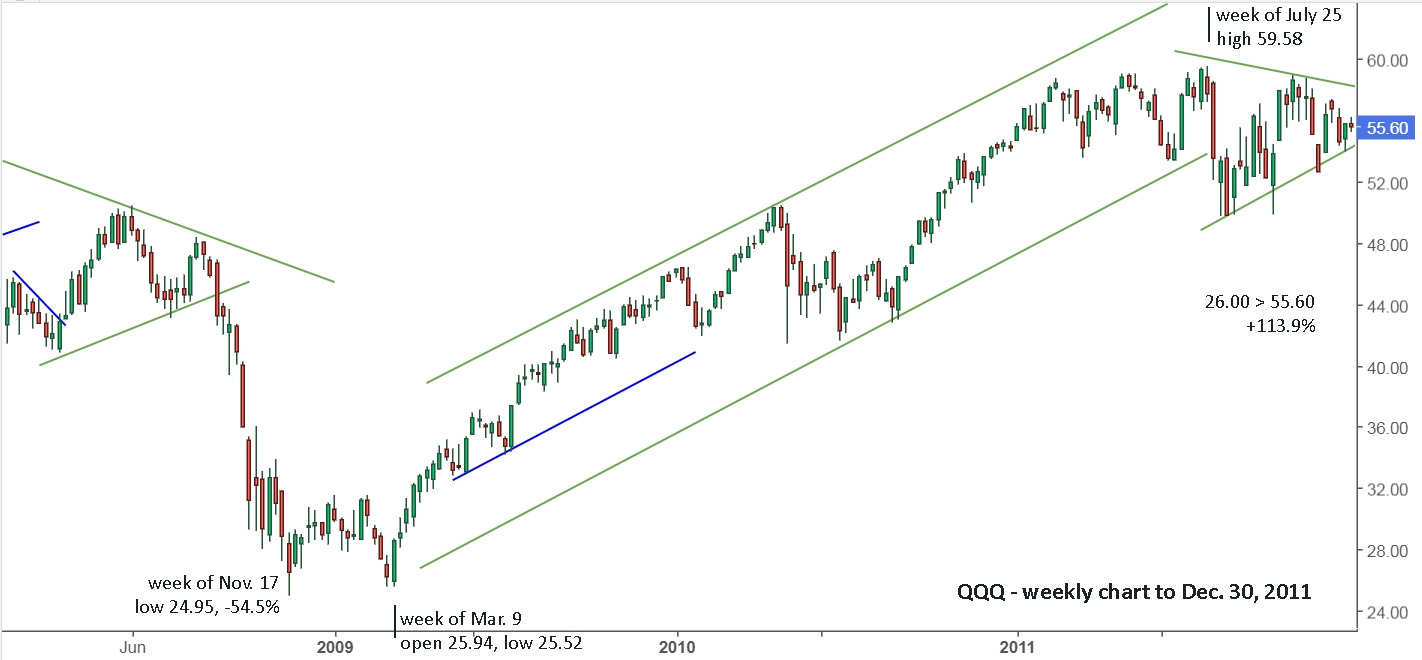
Buying in March, 2009 at $30, I doubt there were many people predicting or expecting it to be $420 in January, 2024. Going forward, it might fall to $80 as Kaplan claims it will, or it might go on to $5000 in 15 years, matching the last 15 years. There’s simply no way to know in advance, so simply draw the lines and check them once a week.
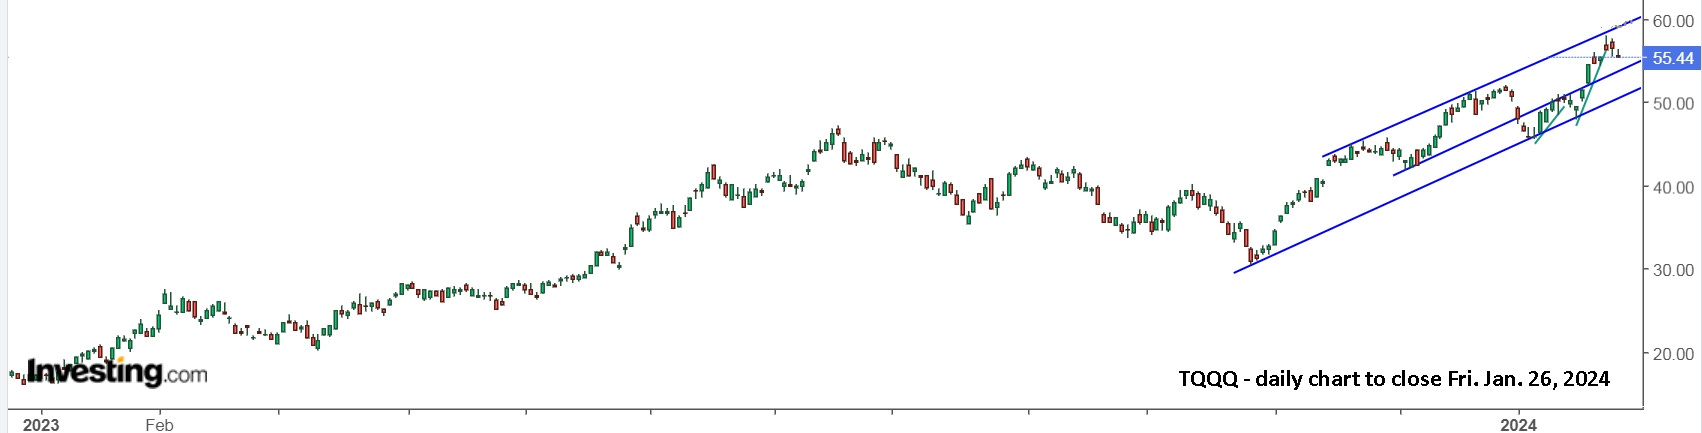
Update to Fri. Jan. 26 : I’m still learning the power of doing less and trusting the trendlines. It’s often said it’s more difficult to unlearn things than to learn things. I completely agree. Old habits are hard to break.
This past week had new highs in the market, but without it yet reaching the resistance trendline, it wasn’t a clear sell to lock in profits. For those holding QQQ, then there was definitely nothing to do.
For those holding TQQQ, it’s been more difficult to do nothing since buying the open Monday, Jan. 8.
My conclusions, for my own style, is to continue buying and selling early moves, especially when it’s stretched. I simply hate giving up gains and can always re-buy. The further it drops, the harder it is to sell and the more likely you’ll sell at a temporary low and then possibly get whiplashed, buying higher and selling a reversal drop.
If you’re still holding, you need to decide if you will sell a gap lower on Monday, and if you’re willing to re-buy a reversal. If you’re not holding, then you need to decide if you’ll be watching to buy a gap up or down on Monday. For me, I’m fairly content on the sidelines with more focus on natural gas. I would however be willing to buy a gap up or down with a stop sell entered right after buying. Here’s a daily view that might provide some additional perspective.
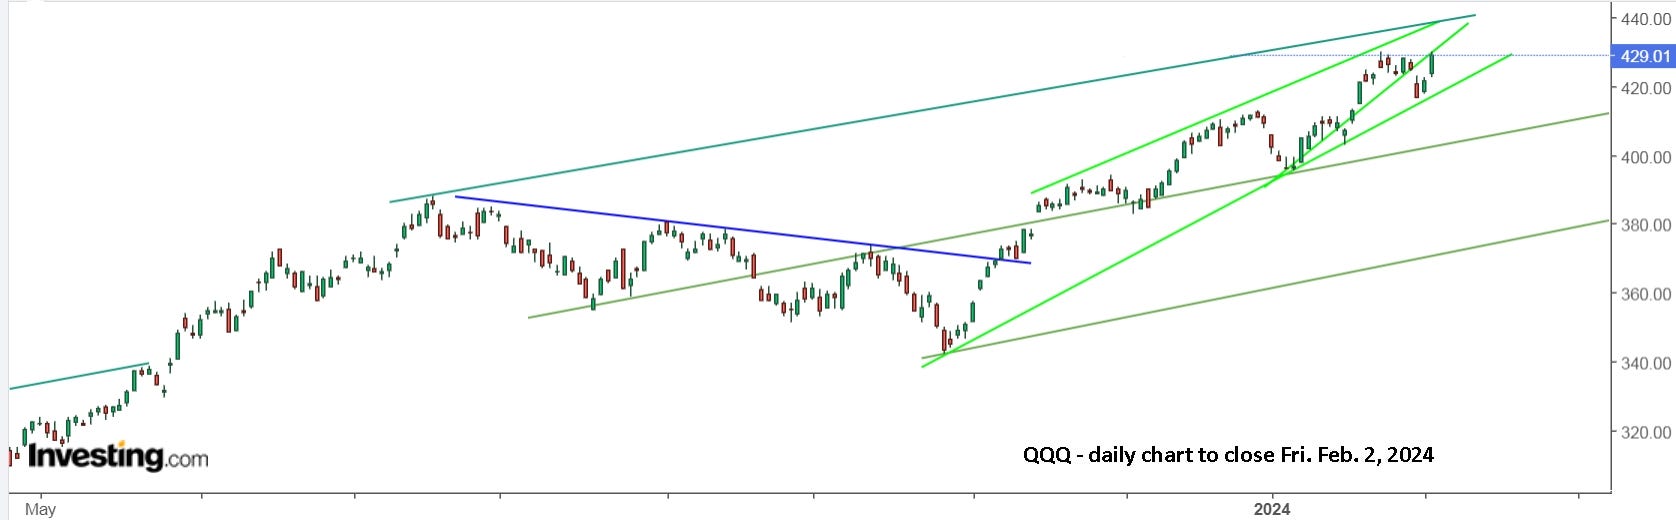
Update to Fri. Feb. 2 : If you had sold last week, then Monday was a buy and Tuesday was a sell for a small gain. The drop on Wednesday could be attributed to the FOMC meeting, but that doesn’t explain the gap open lower. The rally through Friday is generally attributed to the strong jobs numbers, but the logic could have also been used if the markets had dropped further. Essentially, people try to explain market reactions after the fact, and the arguments are often used regardless of the direction of the reaction.
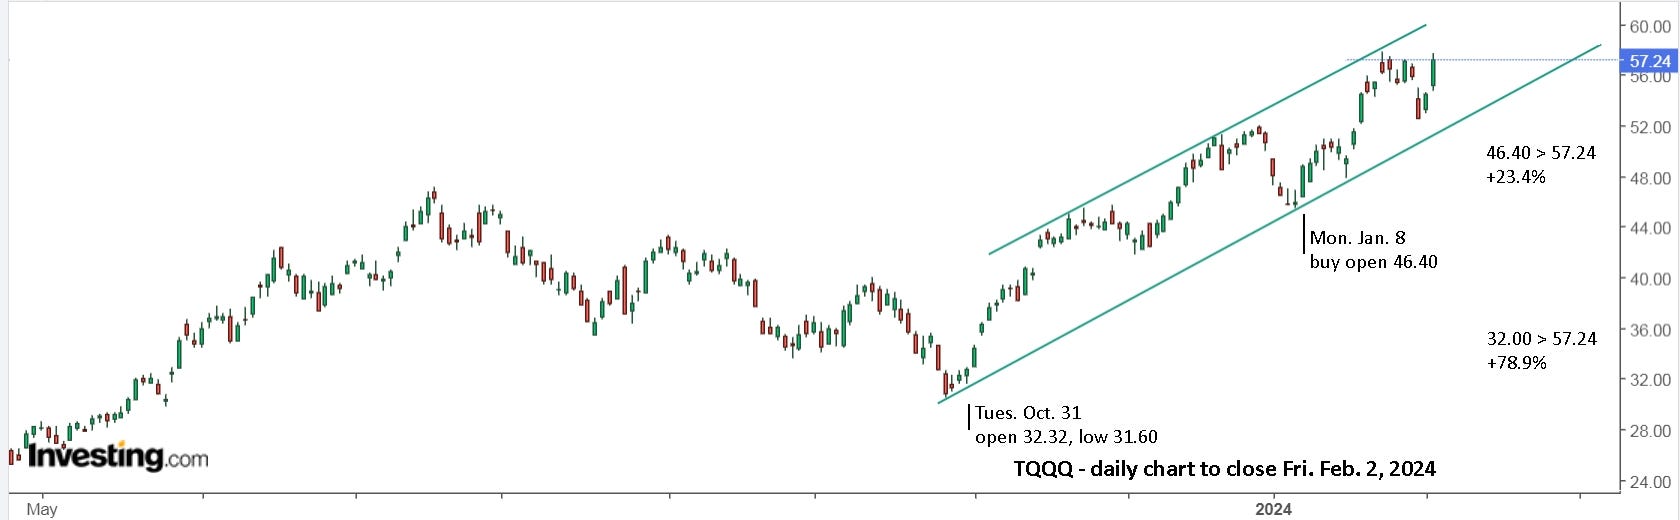
The above chart for TQQQ should convince anyone still doubting the potential for trusting the trendlines and using leverage. In 4 weeks, you’re up 23.4% with no trades and 78.9% in 3 months. If you had chosen to sell at the upper trendline and re-buy the pullbacks, then your gains would be even higher. Now, make a plan for Monday and next week, set your alerts and enjoy your weekend.
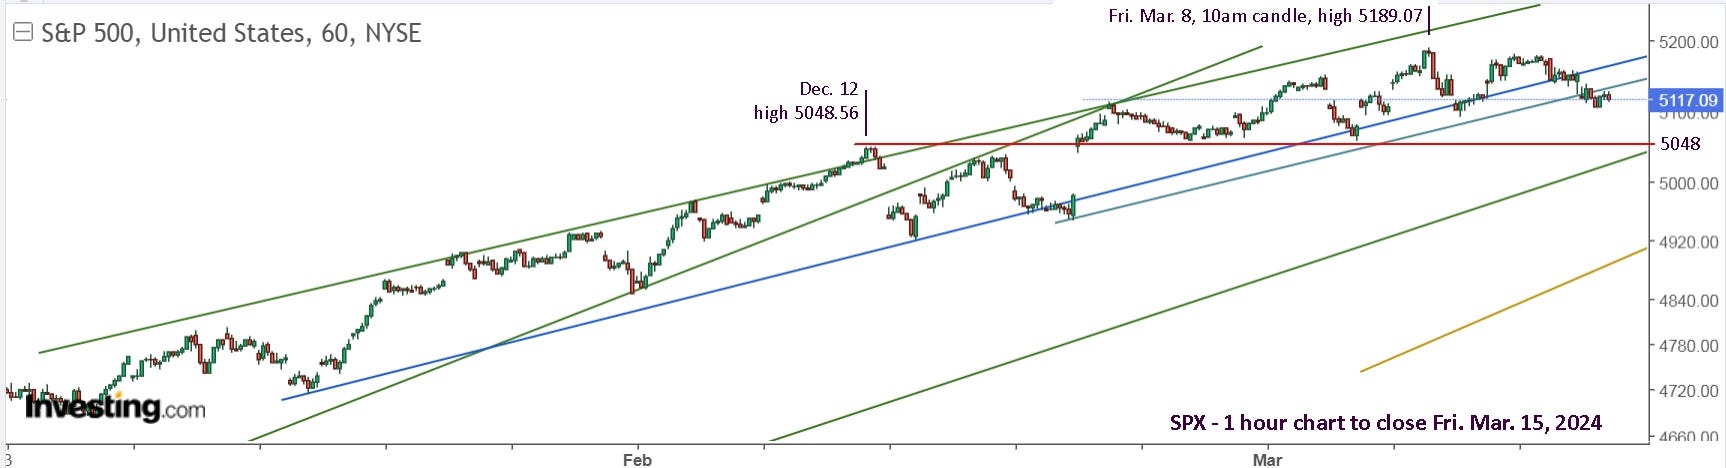
…I decided to add a note of caution. Here’s a look at the S&P 500, which shows clearly why I was cautious Jan. 30 and even held some UVXY overnight. On the 1 hour chart, it was dancing with the upper trendline. Jan. 31 gapped lower, but for some strange reason, UVXY opened even, instead of gapping higher, which was actually fortunate, if you had your head on straight and bought within 5 minutes of the open, before it took off higher.
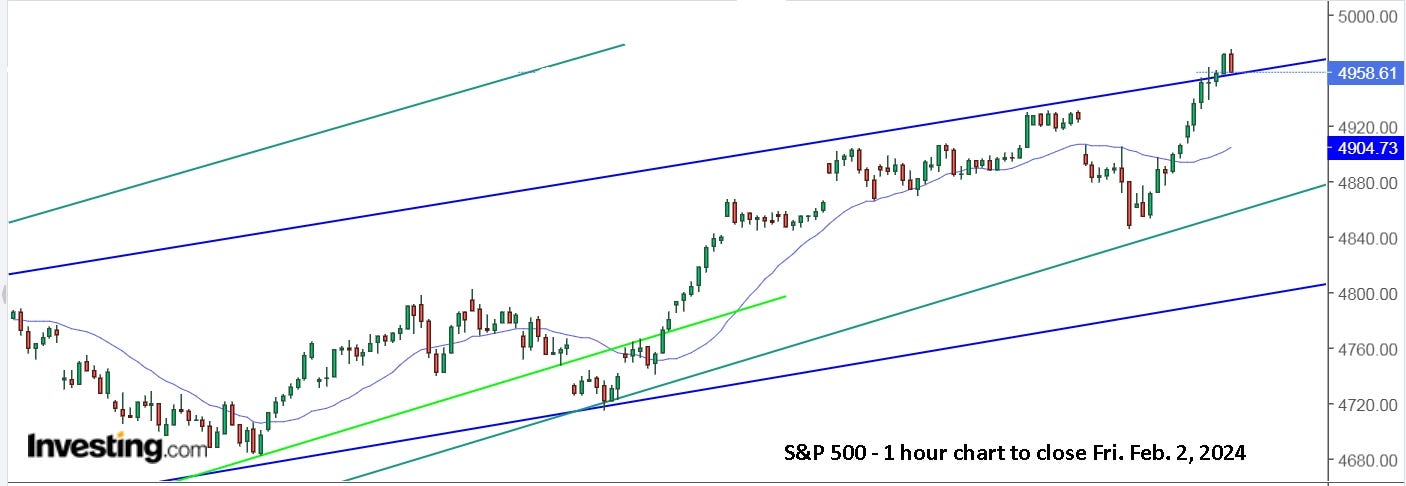
You can also see the swing up and down on Wednesday, after the FOMC. It could have easily continued lower Thursday - Friday, then selling on Tuesday would have looked like genius, and it still was, since you were able to re-buy cheaper on Thursday.
I avoid making predictions, but the markets could move higher this week and then gap lower on Tuesday, Feb. 13 ‘based’ on the CPI report. My main point is to encourage you not to let your recent TQQQ gains slip away. Selling after a break of the lower trendline can make life difficult if it then reverses and you want to be long. If you had sold at the upper trendline, then buying the reversal from breaking the lower trendline is easy. Good luck!
Update to Fri. Feb. 9 : The week of Jan. 29 might have had you looking for a drop. You bought back in Monday, Jan. 29, then sold on Tuesday as it headed lower, thus avoiding the gap open lower on Wednesday, Jan. 31. Once the risk of a drop passed, you bought back in on Thursday, Feb. 1. You may still be holding from that buy.
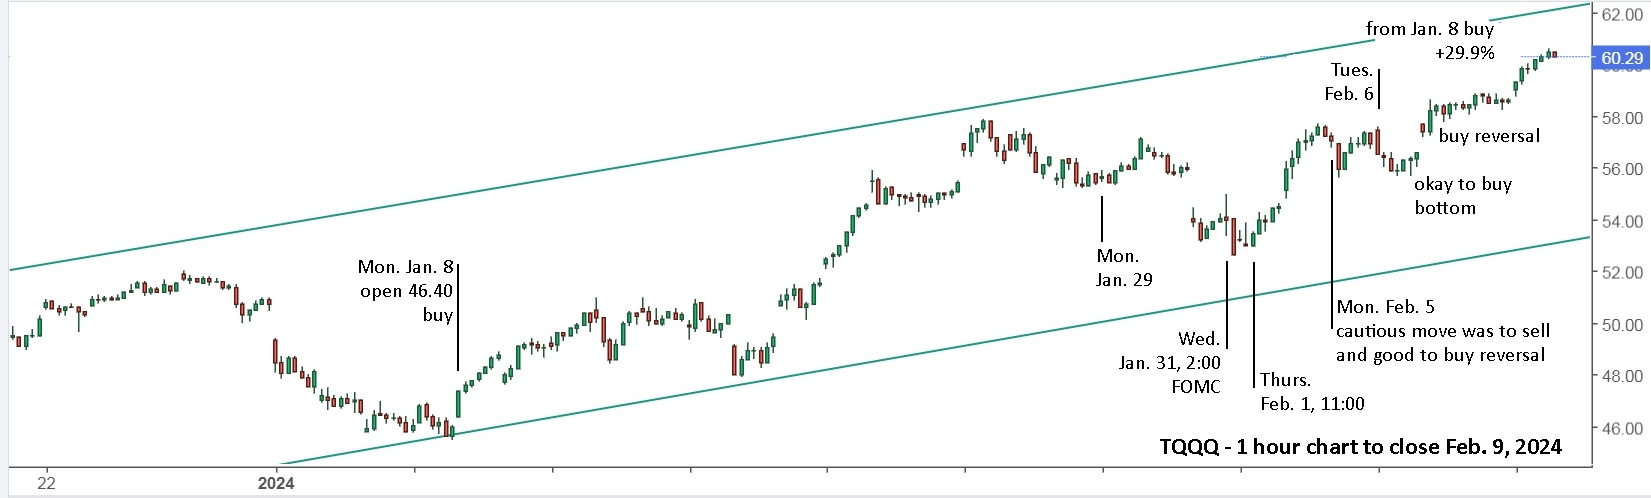
For me, this past week, I was still watching for a drop, even though I wrote last weekend, “I avoid making predictions, but the markets could move higher this week and then gap lower on Tuesday, Feb. 13 ‘based’ on the CPI report.” That had me selling Monday and re-bought, then sold Tuesday and could have re-bought but didn’t. If you didn’t buy Tuesday, you needed to buy Wednesday, perhaps higher than you sold. Or, you decided not to buy.
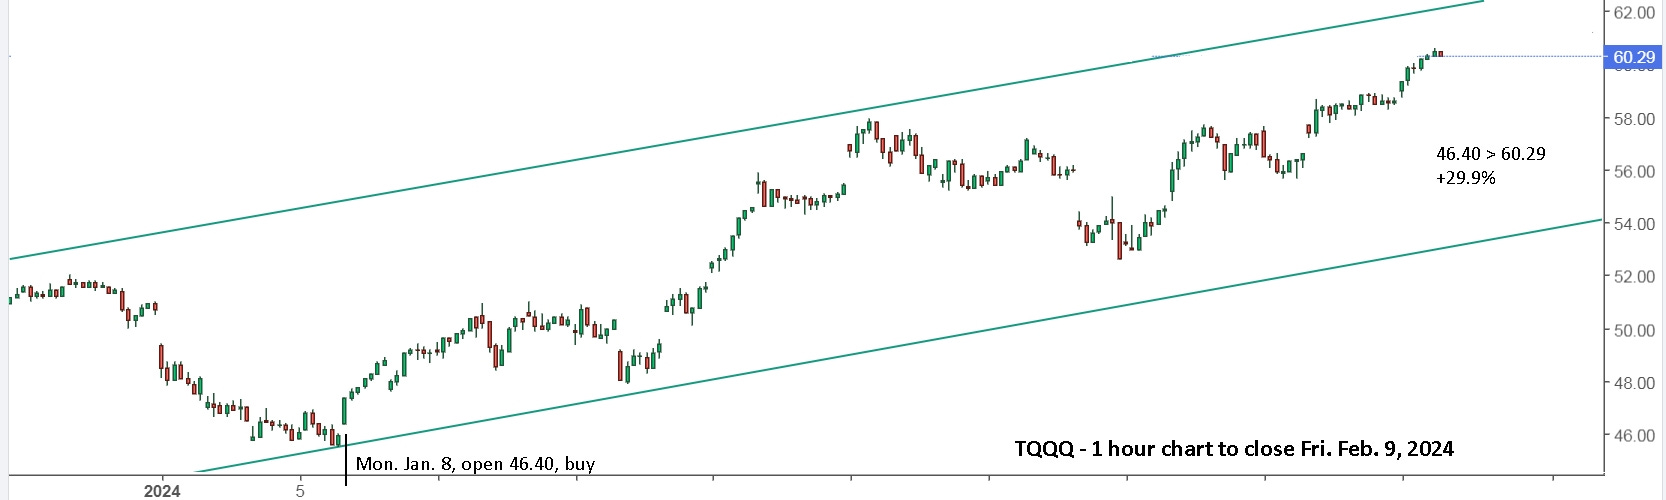
Each of you need to decide how active you want to be. From Jan. 8, you’re up 29.9% with no trades. More if you traded. That’s a lot in 5 weeks, but from the high of 57.89 at noon on Jan. 24, you’re only up an additional 4.2%. For me, if it gets near 62 on Monday, I will sell to avoid a possible gap lower on Tuesday following the CPI report.
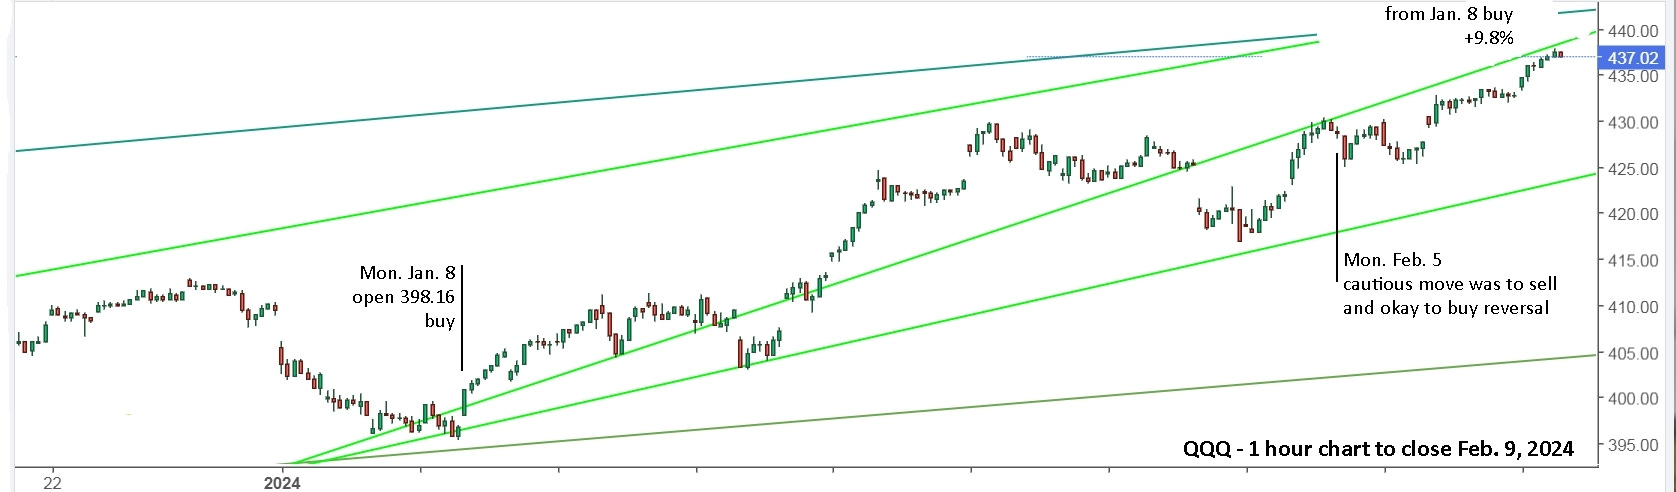
Looking at QQQ, it’s approaching resistance on multiple levels.
Now that I’ve thrown up all the caution flags, here’s a look at January, 2023.
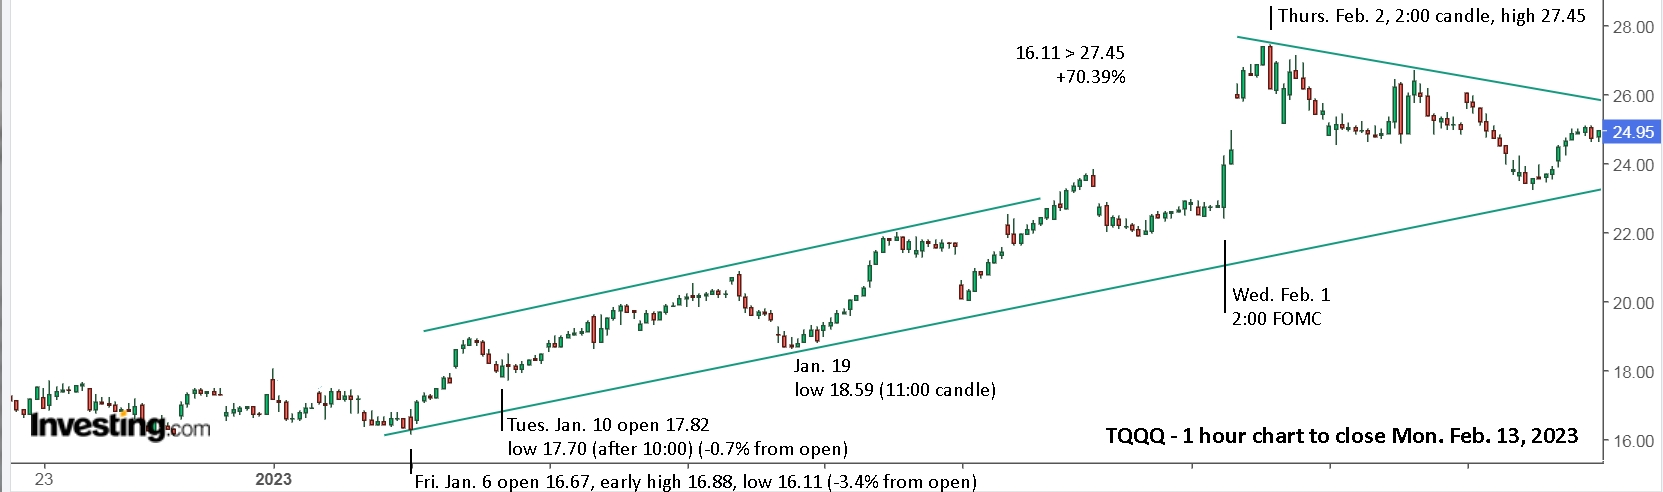
This year, TQQQ is up a measly 29.9% versus 70.4% in 2023, with a big spike higher in early February after the FOMC meeting. That says a gap up after CPI on Tuesday is entirely possible. Either way, the trendlines have been extremely helpful in deciding what to do. Good luck next week! A final caution flag, from Jan. 6 to Feb. 19, 2020, TQQQ was up 38.1%, then fell 72.5% to 8.18 on March 18.
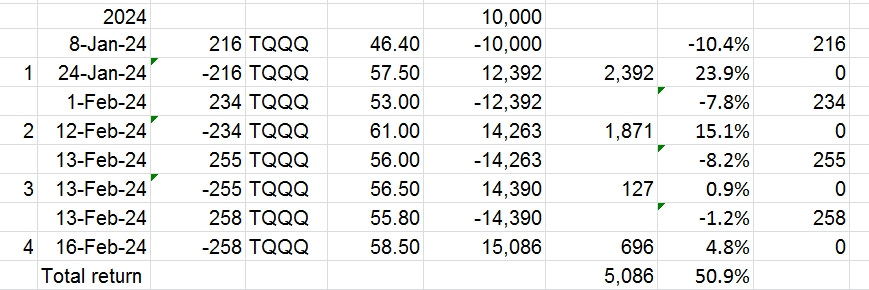
Update to Fri. Feb. 16 : Last weekend, I suggested selling on Monday, in advance of CPI on Tuesday. After hitting 61.14 at 11:35, it held a hard ceiling of 61 for nearly 2 hours. I sold at 61. When it gapped lower on Tuesday and moved up, I bought. When it reversed, I sold for a small gain, then when it held the support line and rallied late in the day, I bought. Without the line showing, there’s absolutely no reason to have bought.
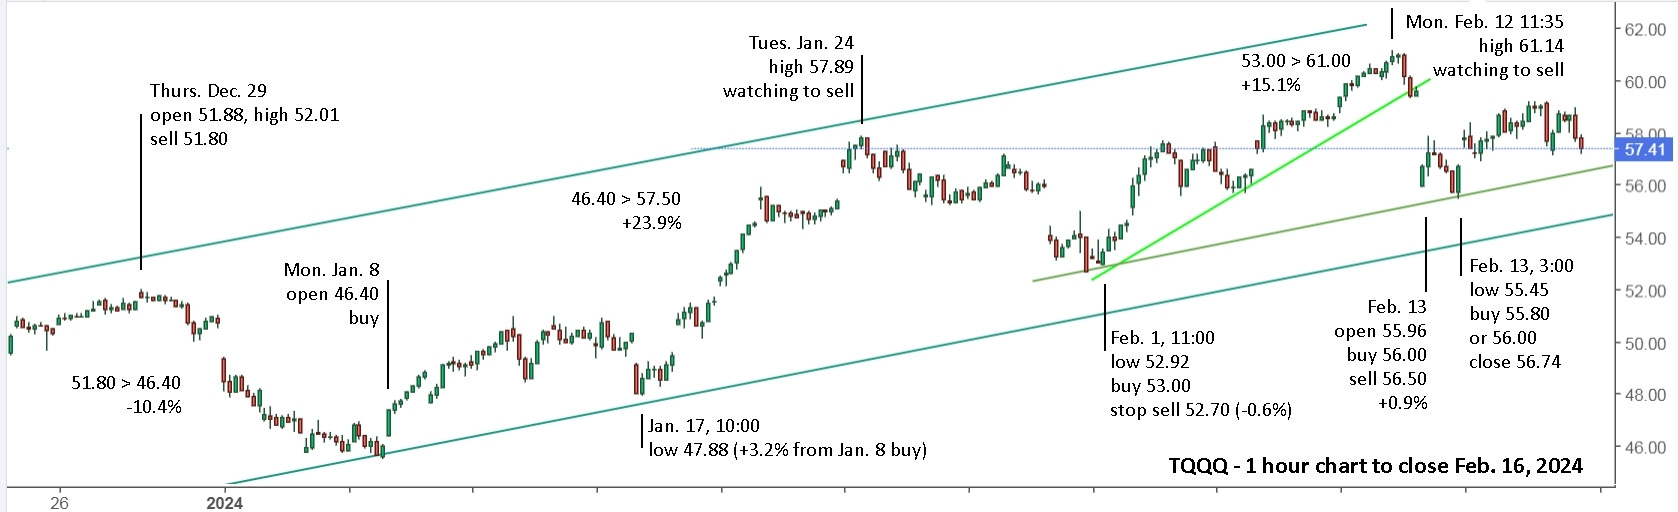
When it hit 59.13 off the open on Friday, matching Thursday’s high and then fell hard in the first minutes, you could have sold or put in a stop sell at 59.80 or 59.50 or whatever number you thought best. You’re now safely on the sidelines with all your original investment and 50% profit in 6 weeks on 4 trades.
You might wonder why I sold Friday with it still above the light green support line, but hopefully you know the answer. There could be a new downtrend line forming from the high on Monday and the hourly view doesn’t show how steep the light green uptrend line actually is. The markets are hitting new all time highs and are really due for a pullback. I’m not expecting a major market crash this year, but it could happen. Will you be ready if it does?
I also don’t want to be greedy, sort of. A gain of 50% in 6 weeks is great and caution is advisable. Friday’s closing price was also back near Friday, Jan. 24 levels, so without trading, you’ve made no gain since then. There are also other opportunities if you want to be greedy and continue pursuing profitable trades.
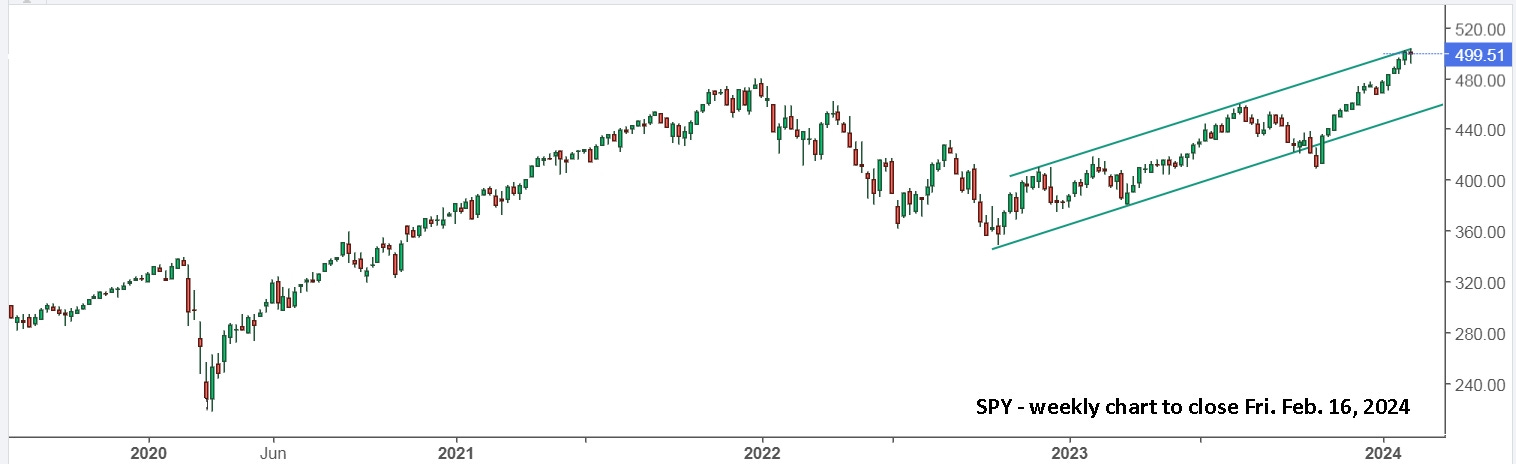
Clearly, the S&P 500 is due for a pullback, so you can either go short with SPXU (-3x), or with UVXY. For some background on UVXY, you can read “Volatility can be super safe and life changing.” Once again, trendlines can be extremely helpful.
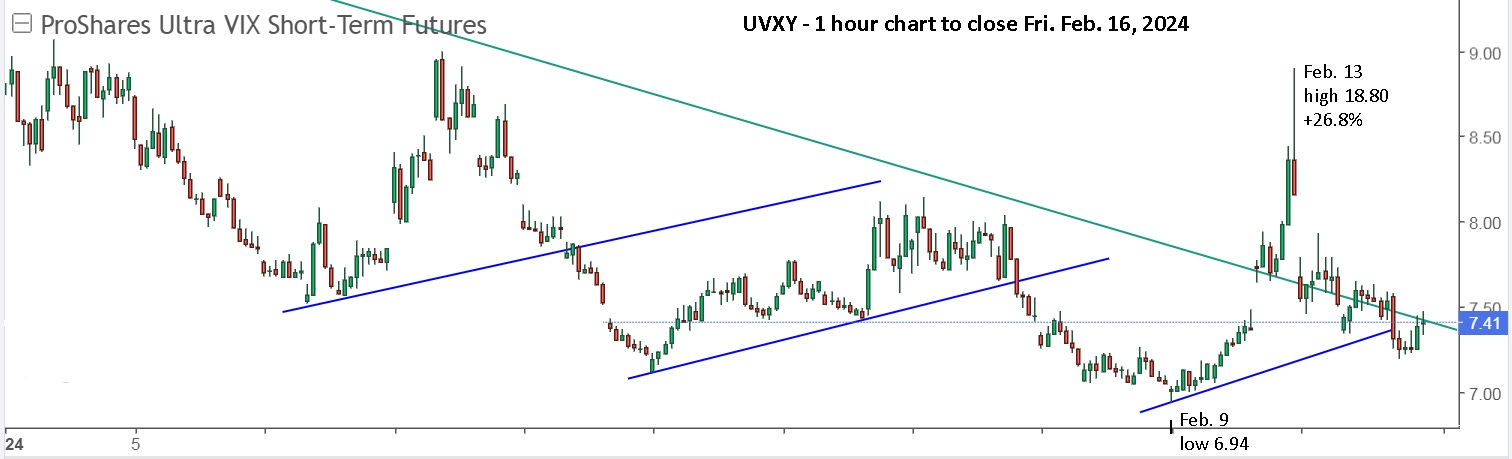
The attraction of UVXY (1.5x) and UVIX (2x) is the enormous gains that are possible in a short period of time. On sharp drops, like in 2020, it can give 1000% gains in a few weeks.
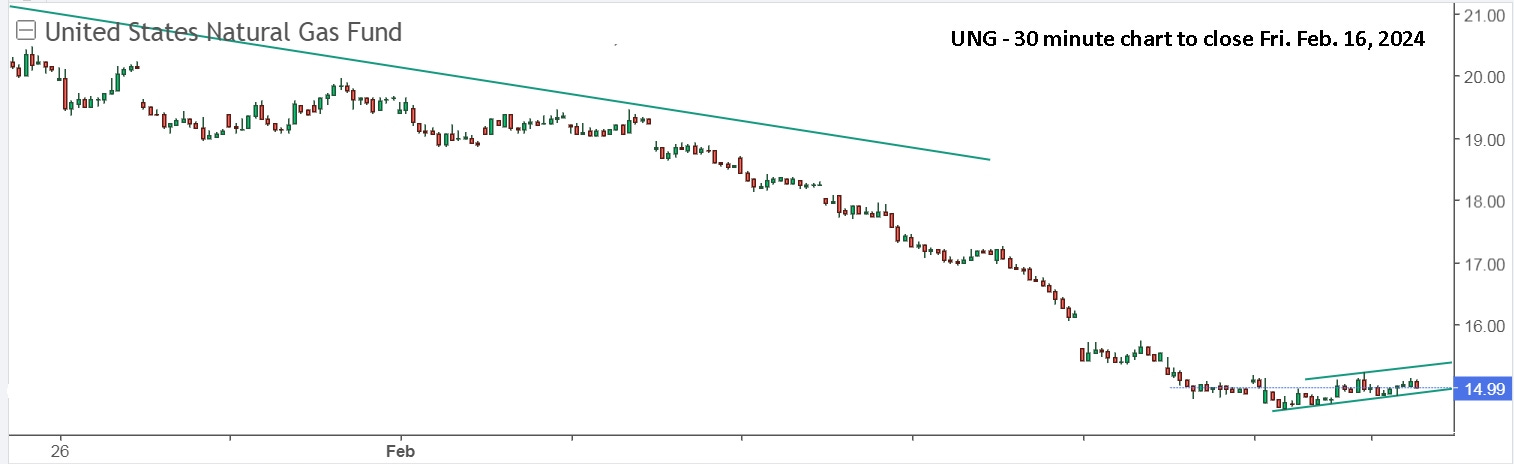
Another current option is with natural gas, NG, which is at the lowest price in years. You can read all the details here, “Compound returns with NG can be huge.” The trendlines suggest it may have started up, but caution is still advised.
Enjoy your long weekend!
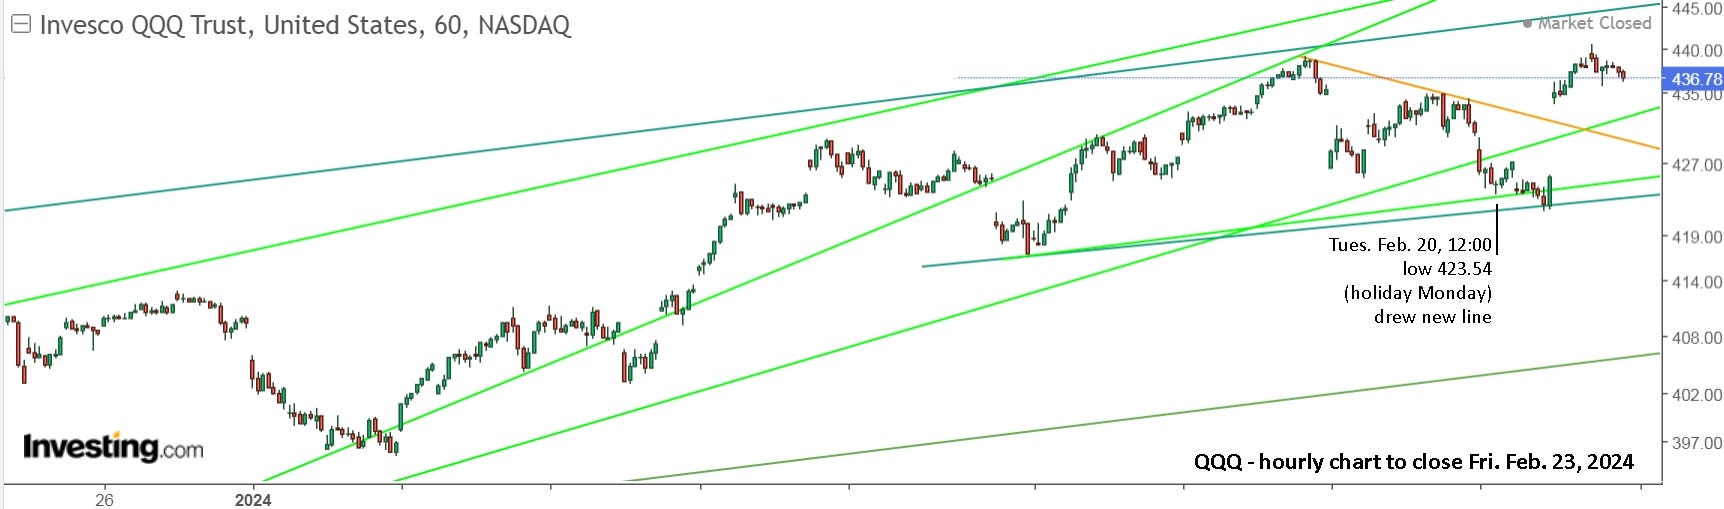
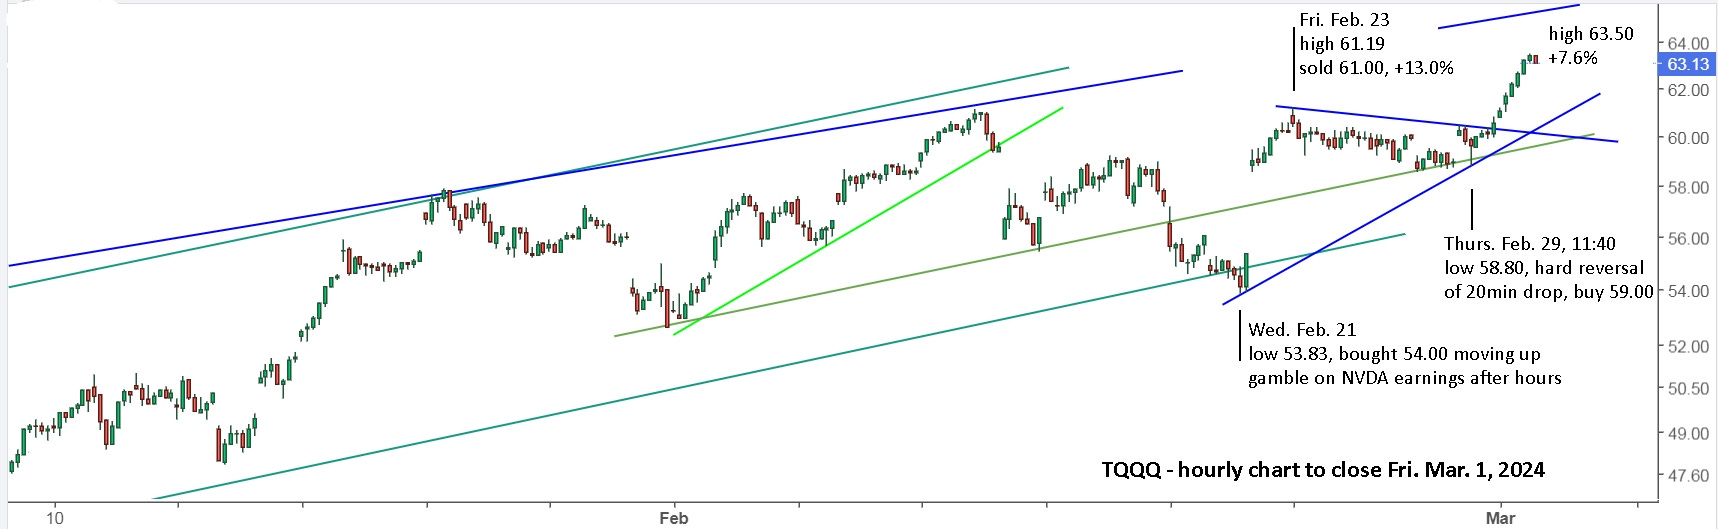
Update to Fri. Feb. 23 : If you had sold on Fri. Feb. 16, you were watching to buy on Tues. Feb. 20 (holiday Monday). If you were still holding, you were watching to sell a gap open lower and drop. It opened lower, rallied a few minutes, then fell hard, so you would have sold. Once it neared the support line at 10:30 and reversed, you might have bought and then stopped out for breakeven when it fell. When it hit the support line at 12:30, then take another swing. No reason to sell at the end of the day.
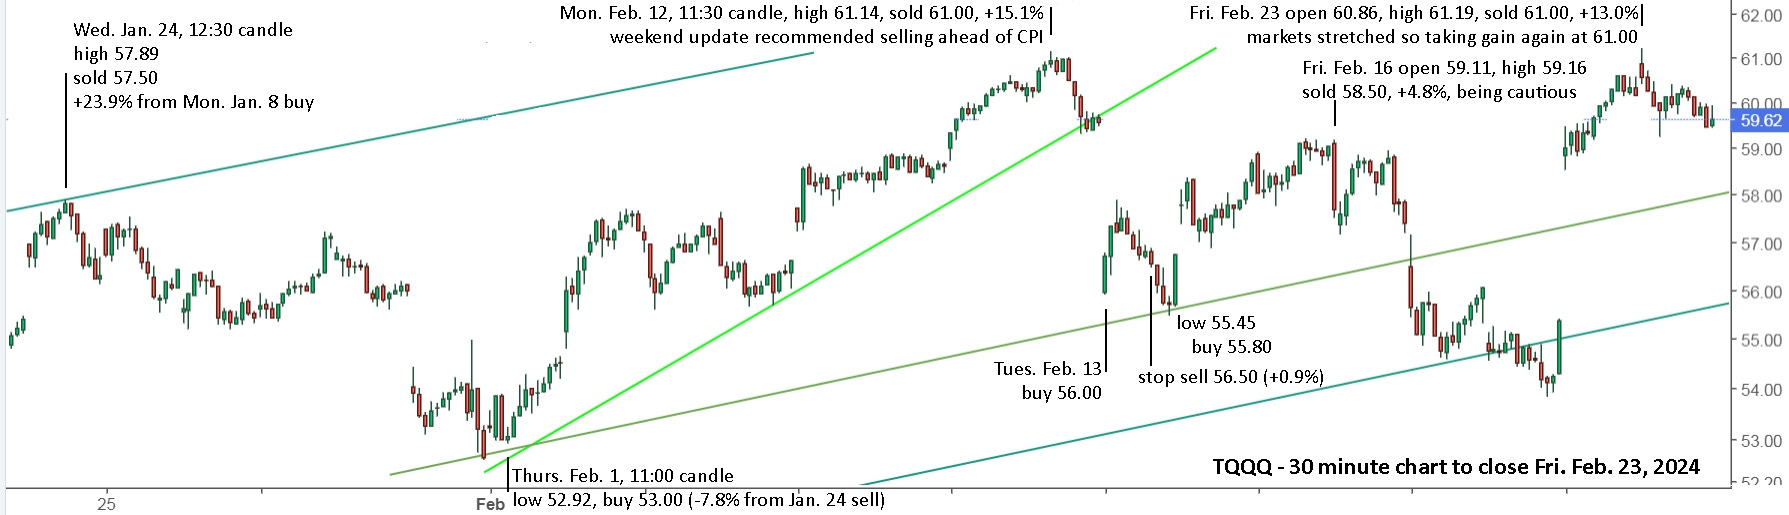
TQQQ gapped lower on Wednesday and held support. Now it was tricky, but the safe option is to sell for breakeven or on a stop for a small loss. Later in the day, there was no real support line, but you might have gambled and bought, knowing that NVDA was reporting earnings after hours. As it rallied hard in the final 30 minutes, you had a cushion and could watch the move after hours and be ready to sell.
NVDA reported blowout earnings again so it and the markets gapped way up on Thursday. Off the open on Friday, TQQQ hit 61.19, held a hard ceiling for 15 minutes, giving plenty of time to sell at 61.15 with a stop buy at 61.30 or 61.50, or not at all. The Feb. 12 high was 61.14 and you sold at 61.00. Since then you bagged 2 trades for 5% and 13%, so no need to be greedy. Yes, both QQQ and TQQQ are safely within the trendlines, so you wouldn’t normally have been looking to sell, but zooming out tells a different story. And note that I switched the chart to log scale so that the percentage change is much more clear.
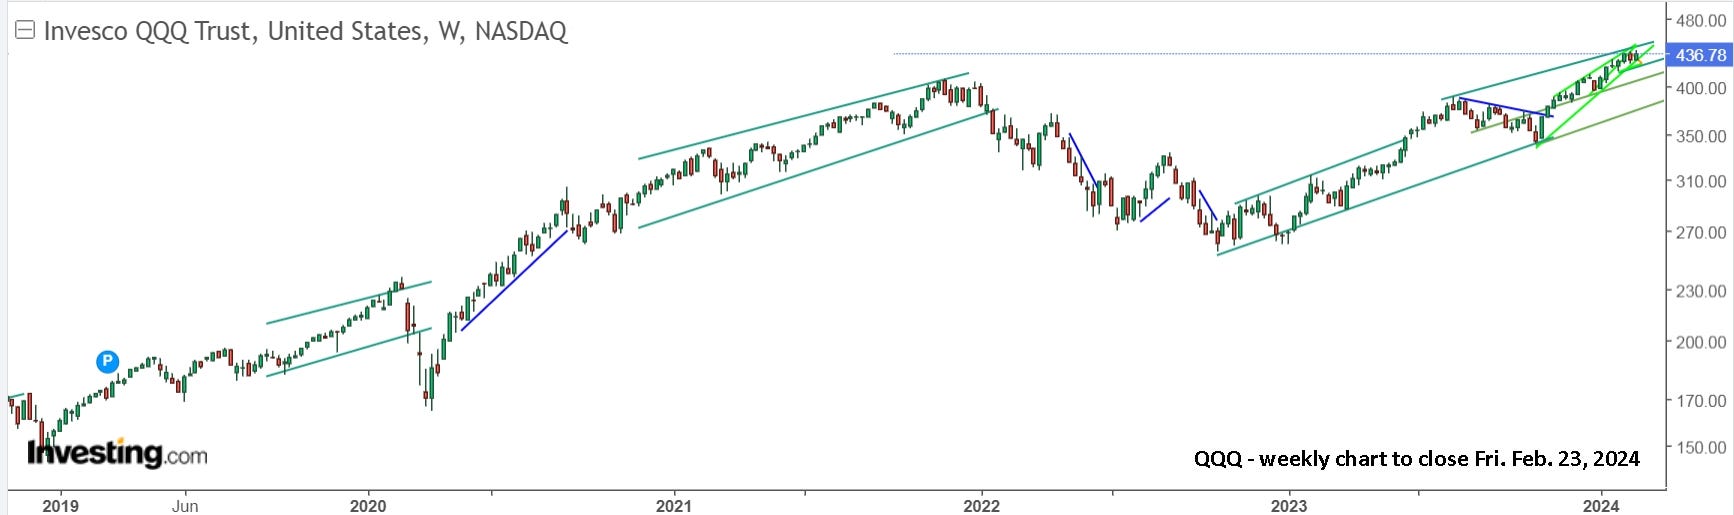
The weekly view shows that QQQ is stretched and due for a pullback. Like the signal in June, 2023, it may be a month or few before there’s a more significant pullback, but it’s time to be cautious.
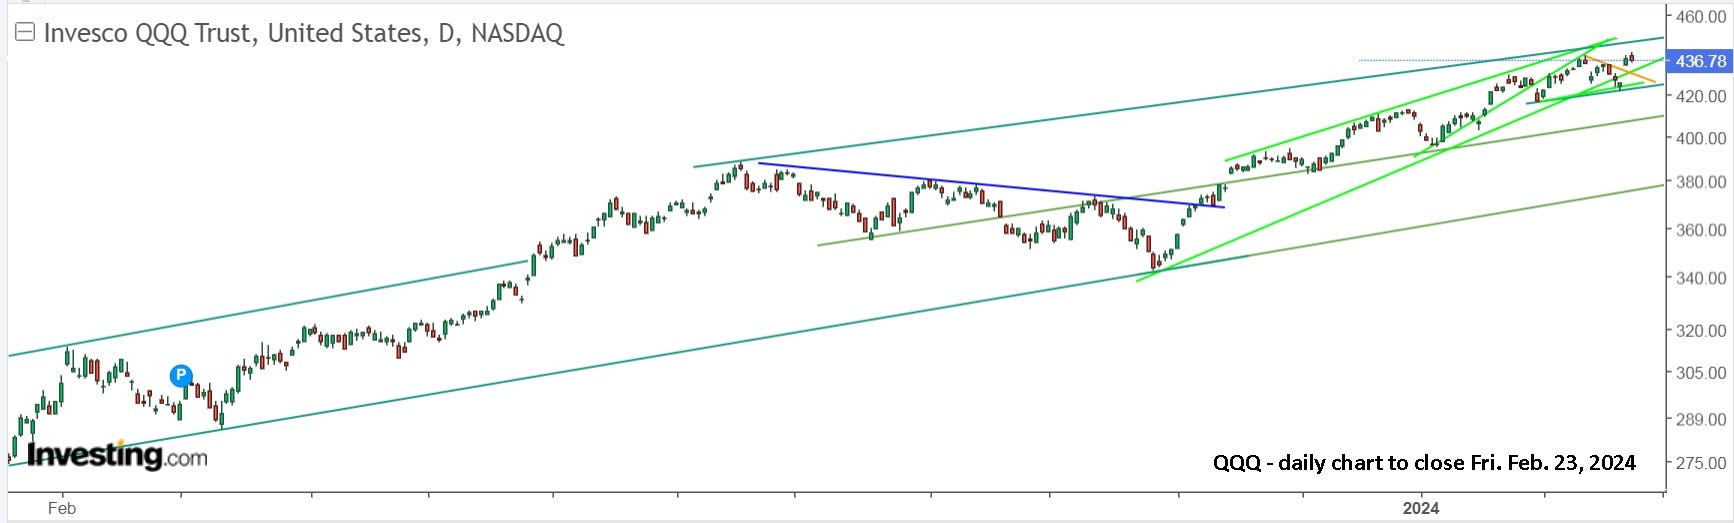
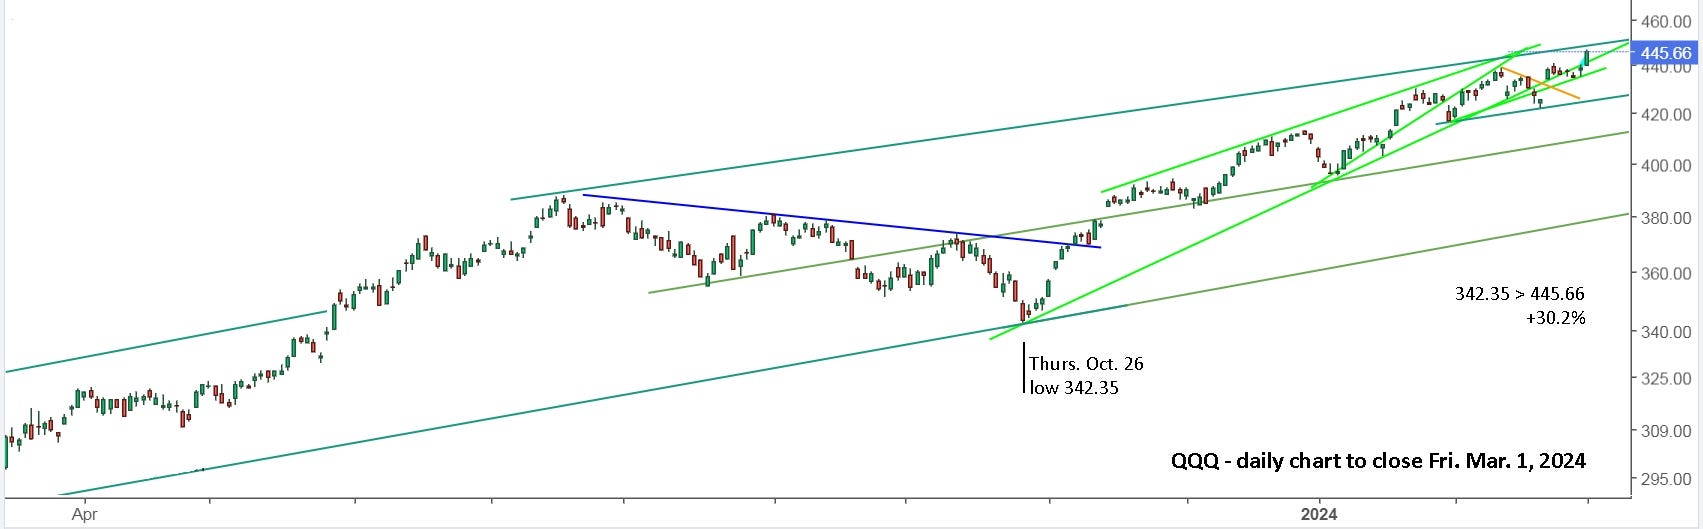
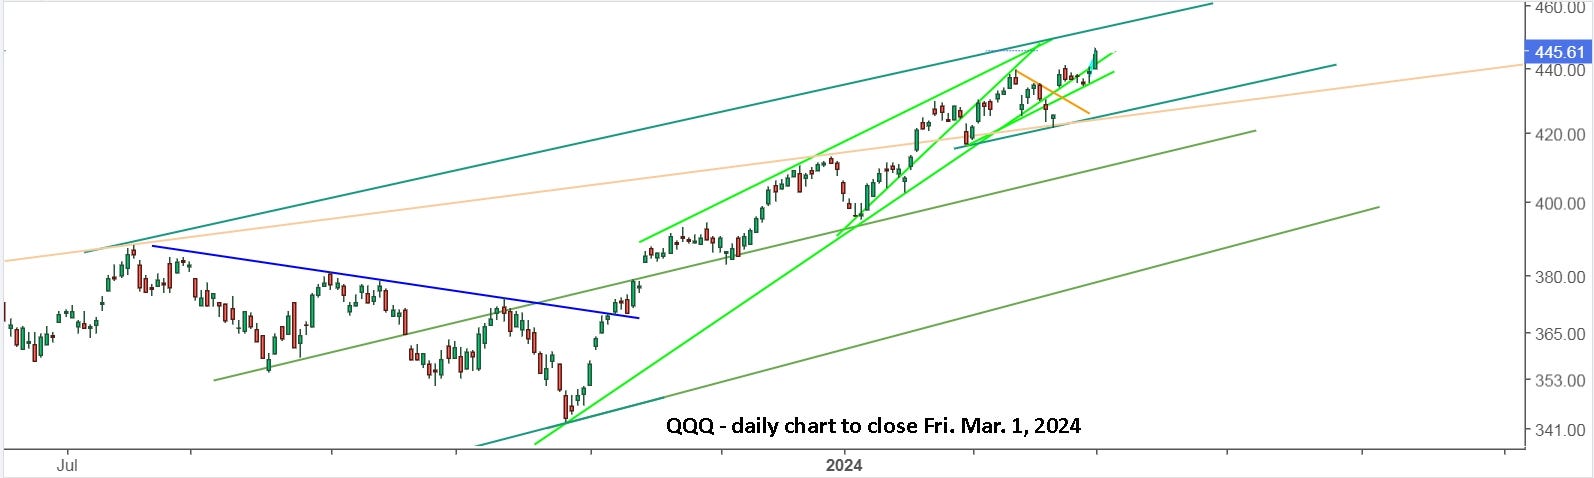
The daily view indicates that you could have stayed long on Friday. Everyone has to make their own decisions and take action themselves. I’m just the coach providing a game plan.
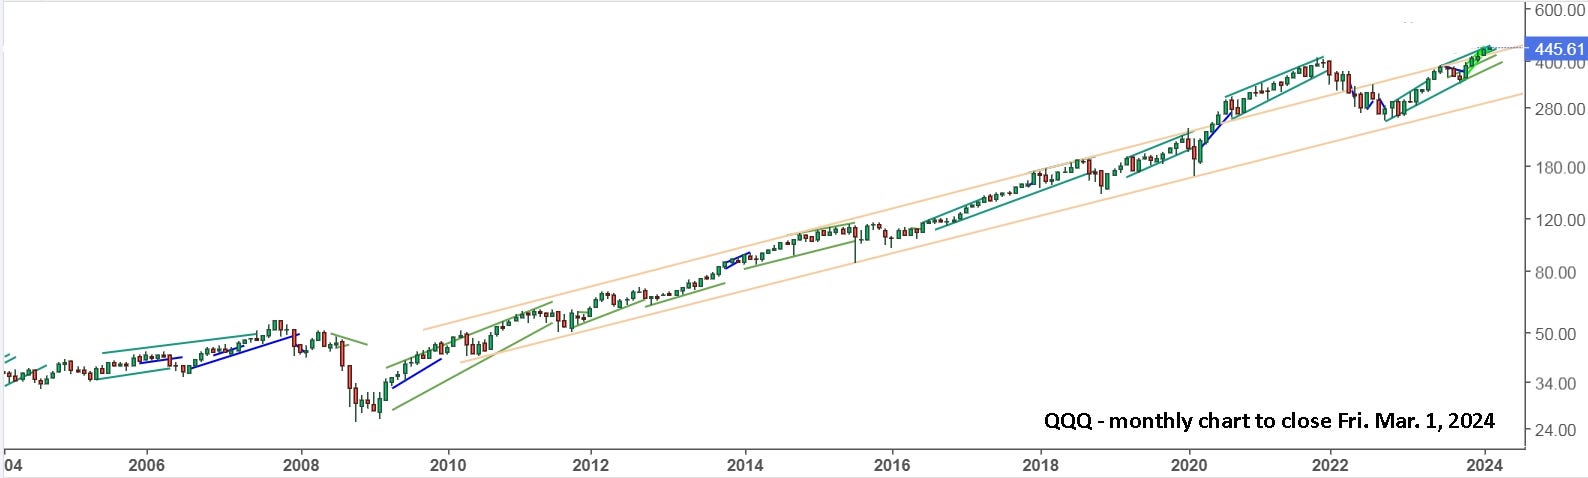
A new twist this week is using log scale on the charts, which presents a completely different perspective on the monthly chart. Without it, the recent months look parabolic. With log scale, it’s clear that the percentage gains since November aren’t extreme, and the pullback last year from August through October wasn’t severe. The drop in 2022 was pretty significant. The drop in 2018 and 2020 don’t look very severe either, but all those drops were significant and avoiding them made a huge difference to your investment portfolio.
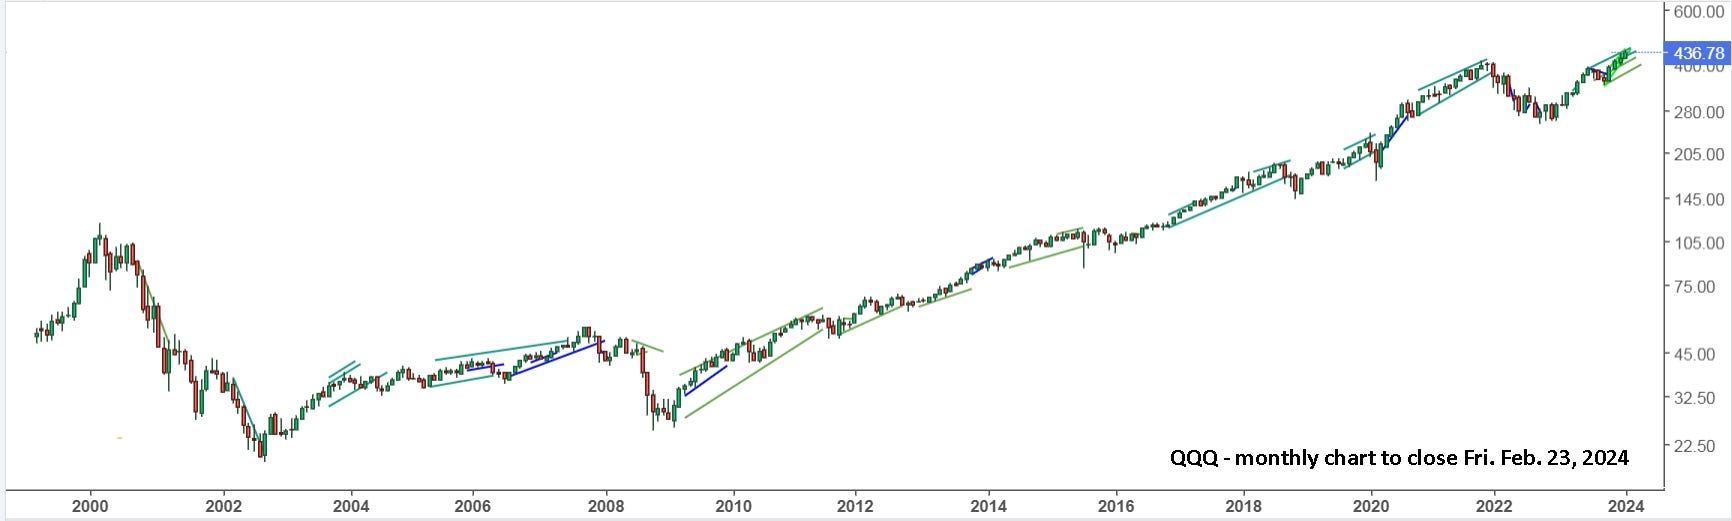
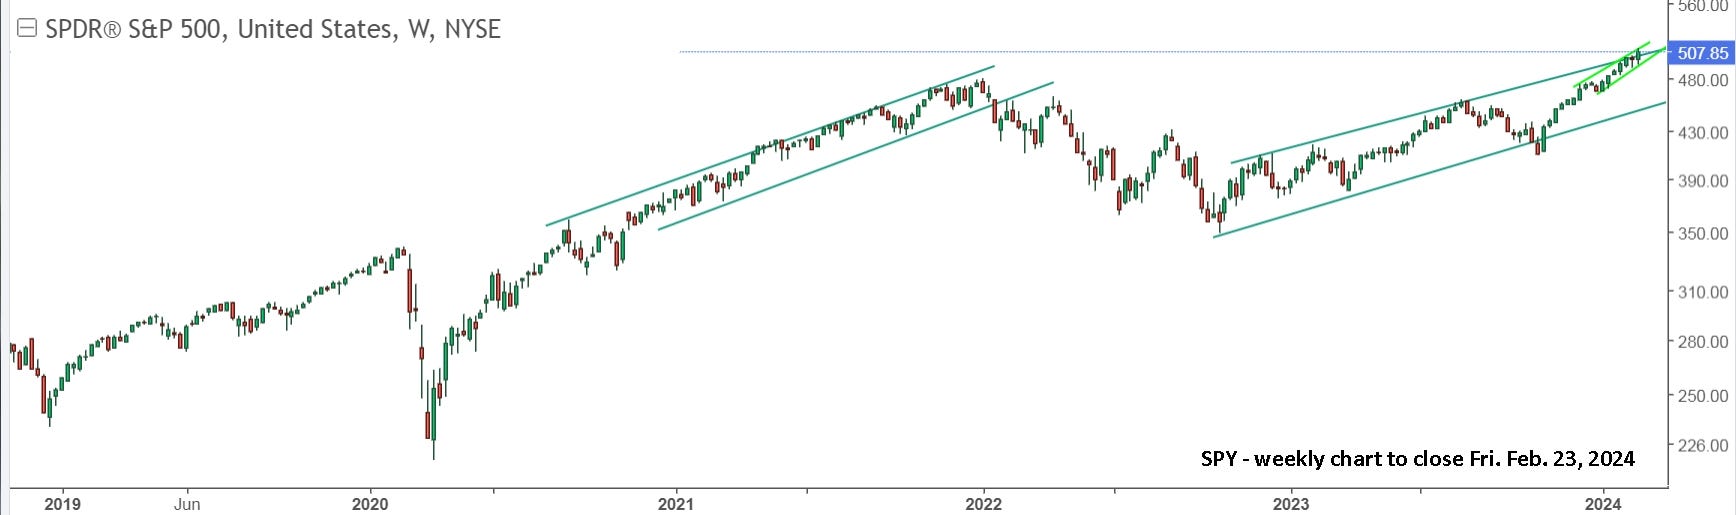
My main take away, is the severity of the drop in 2000-2002 and in 2008. Everybody really needs to have a plan for avoiding the next one of those, and it is definitely on the horizon, sometime in the future. Here’s SPY, the S&P 500 ETF.
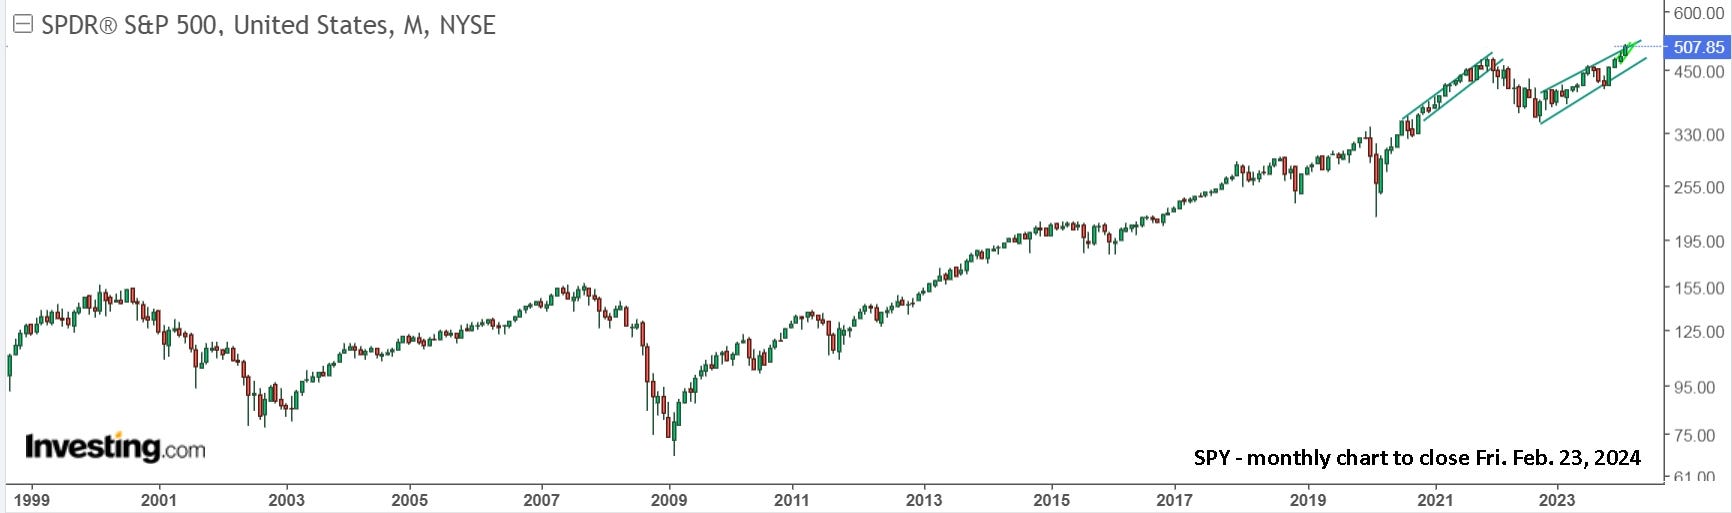
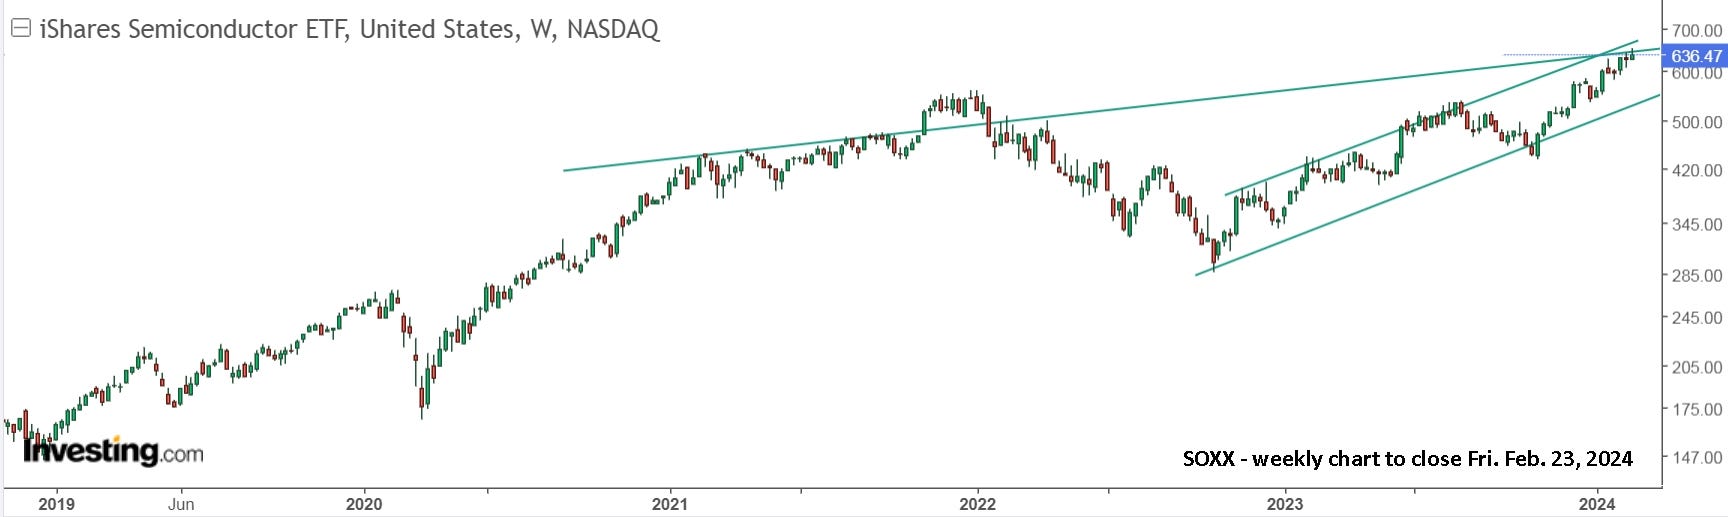
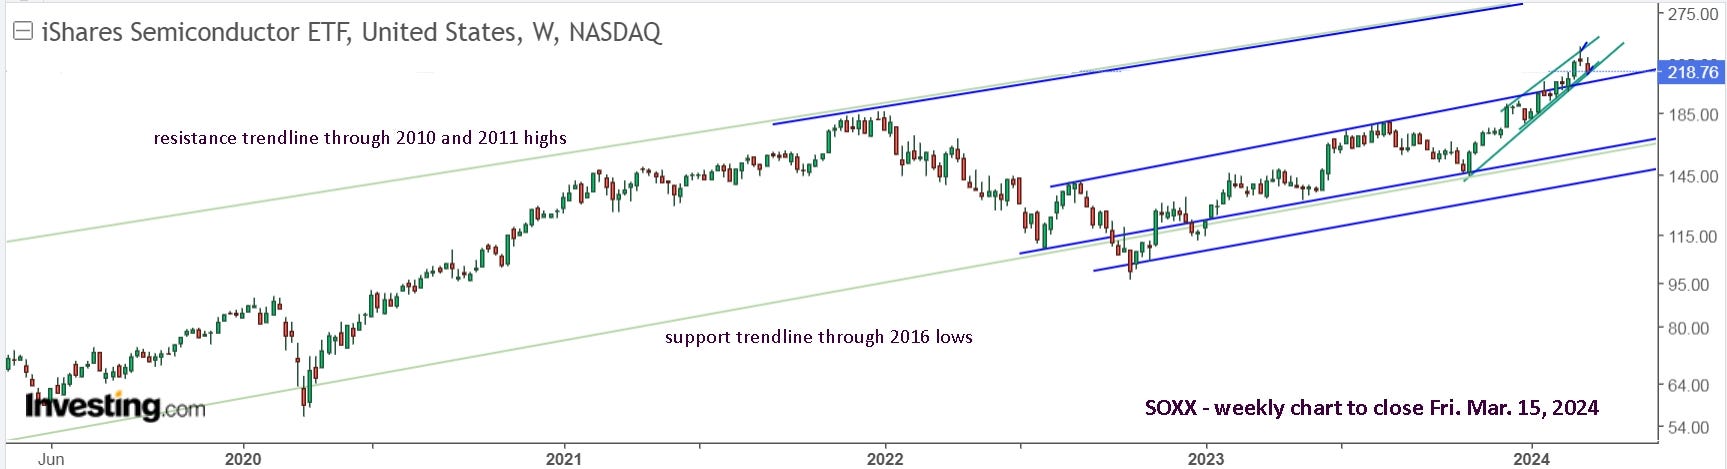
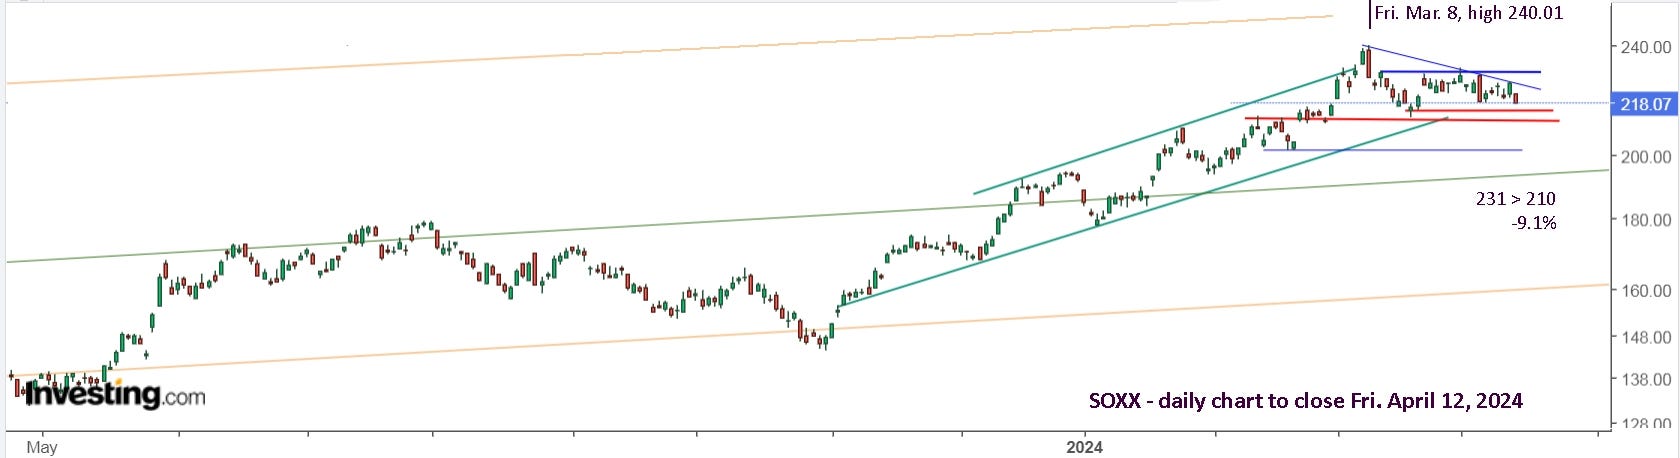
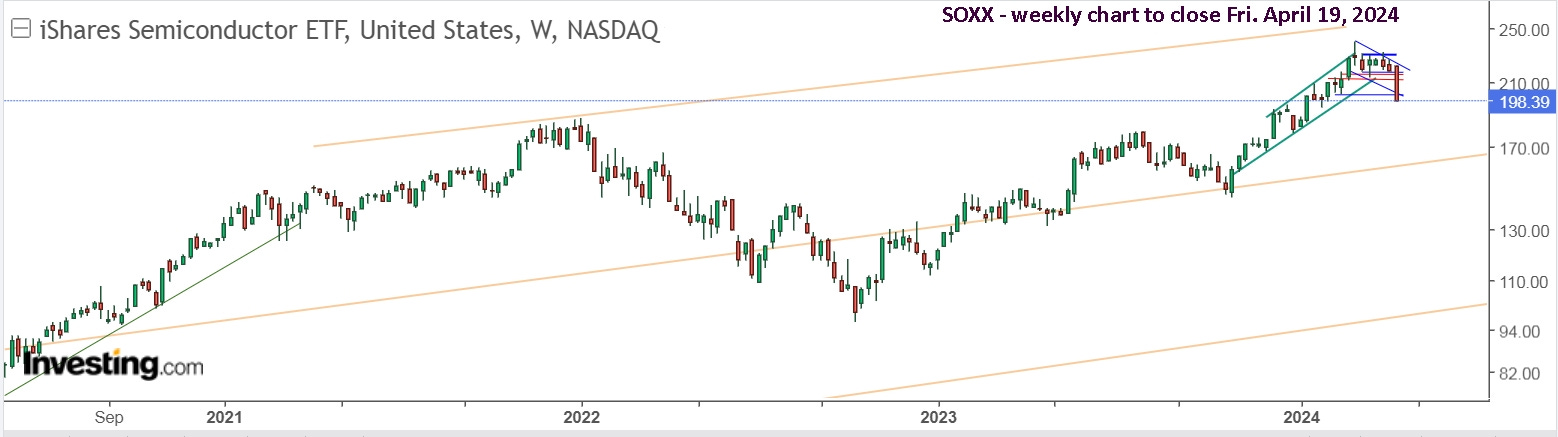
It’s definitely stretched in the weekly view, as is SOXX.
The Feb. 21-23 TQQQ trade for +13.0% puts your 5 trade total to +70.4%. Last week, after 4 trades it was +50.9%. That’s the incredible power of compounding returns. And that’s why you continue to go ‘all in’ and ‘all out’. Nobody that I know of applies this strategy and nobody that I know of gets such incredible returns. You’ve now seen it work, first hand.
Last week I suggested VIX and NG as possible trades, but they’re much more difficult than TQQQ. You can read my NG update here, “Compound returns with NG can be huge.”, but best to remain cautious. It can make nasty gap open moves, and even when it’s in your favour, decisions after that are difficult. For some background on UVXY, you can read “Volatility can be super safe and life changing.”, and starting with VIXY might be a good idea.
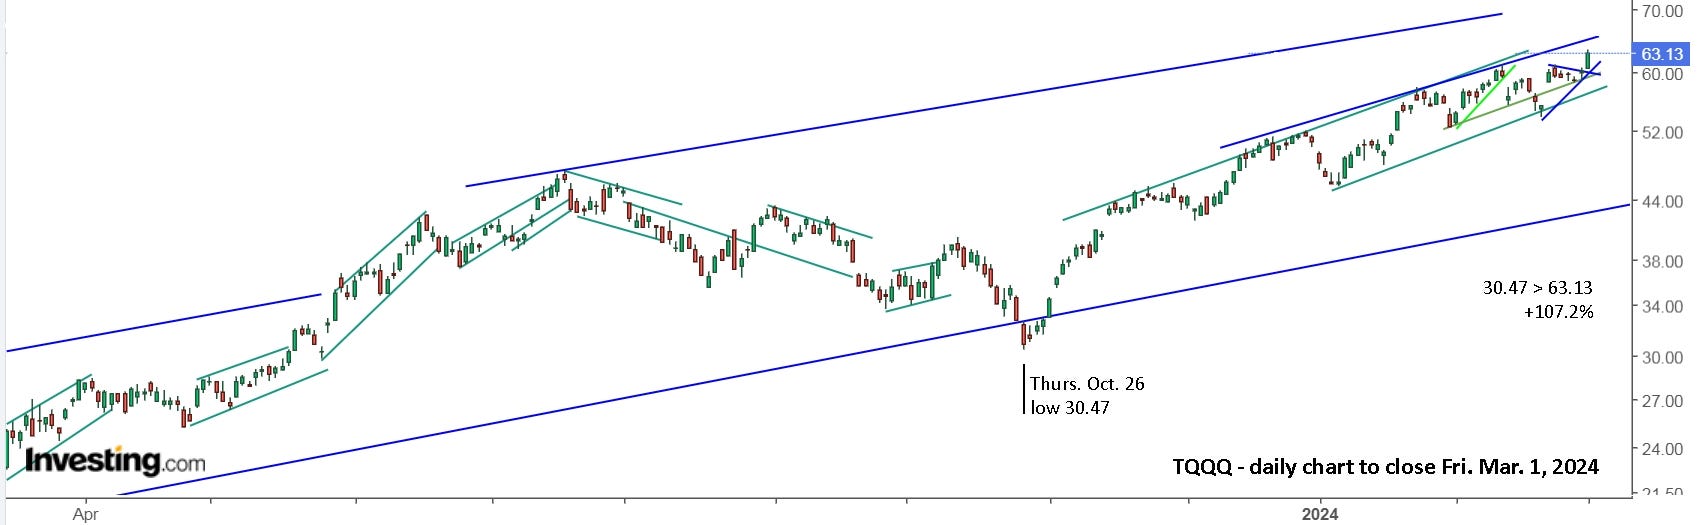
Update to Fri. March 1 : Selling Fri. Feb. 23 was again a good decision and buying the dip on Wed. or Thurs. this week gave a trade gain of 7.6% at the Friday high of 63.50. Once again, the chart isn’t suggesting a necessary sell, but I’d be out, taking the win. I was looking short Thursday early and I failed to pull the trigger long on the reversal, unfortunately. Now, I’ll be watching short but once it hits support again, I’ll be going long.
QQQ is up 30.2% from the Oct. 26 low and TQQQ is up 107.2%, more than 3x and a clear example of why it makes sense to hold TQQQ when the trend is with it.
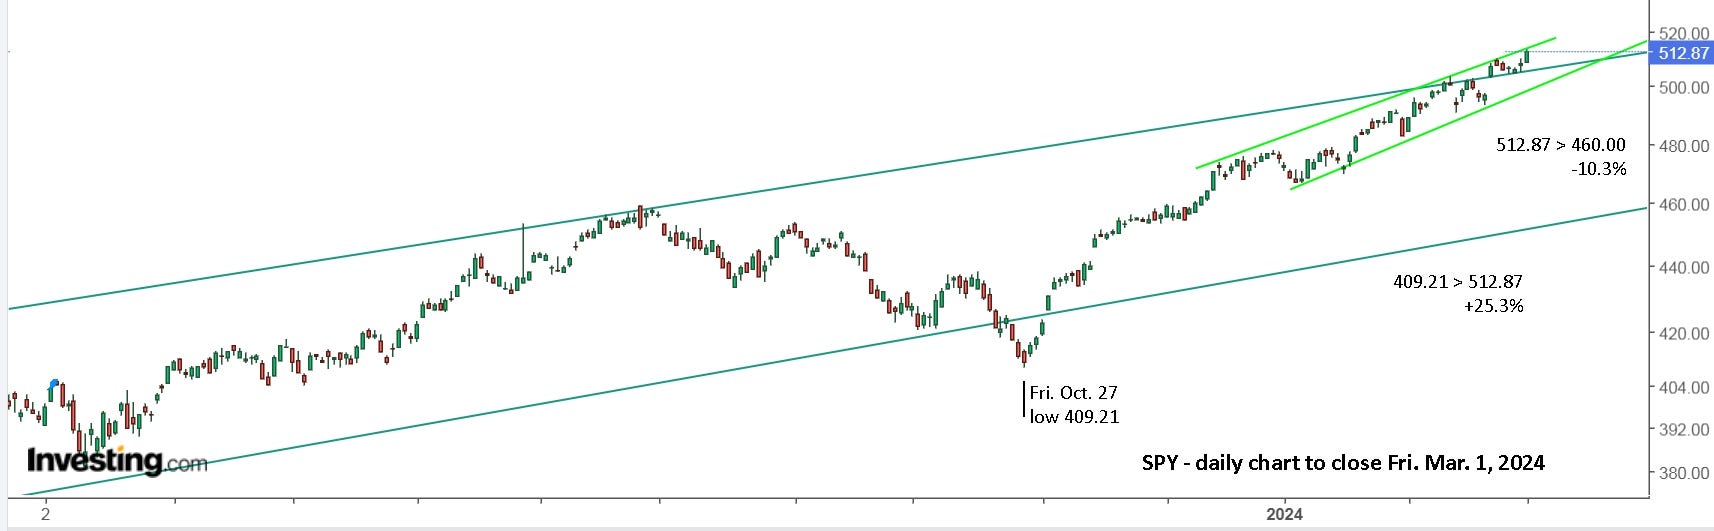
A look at SPY and SOXX also suggest the markets are stretched.
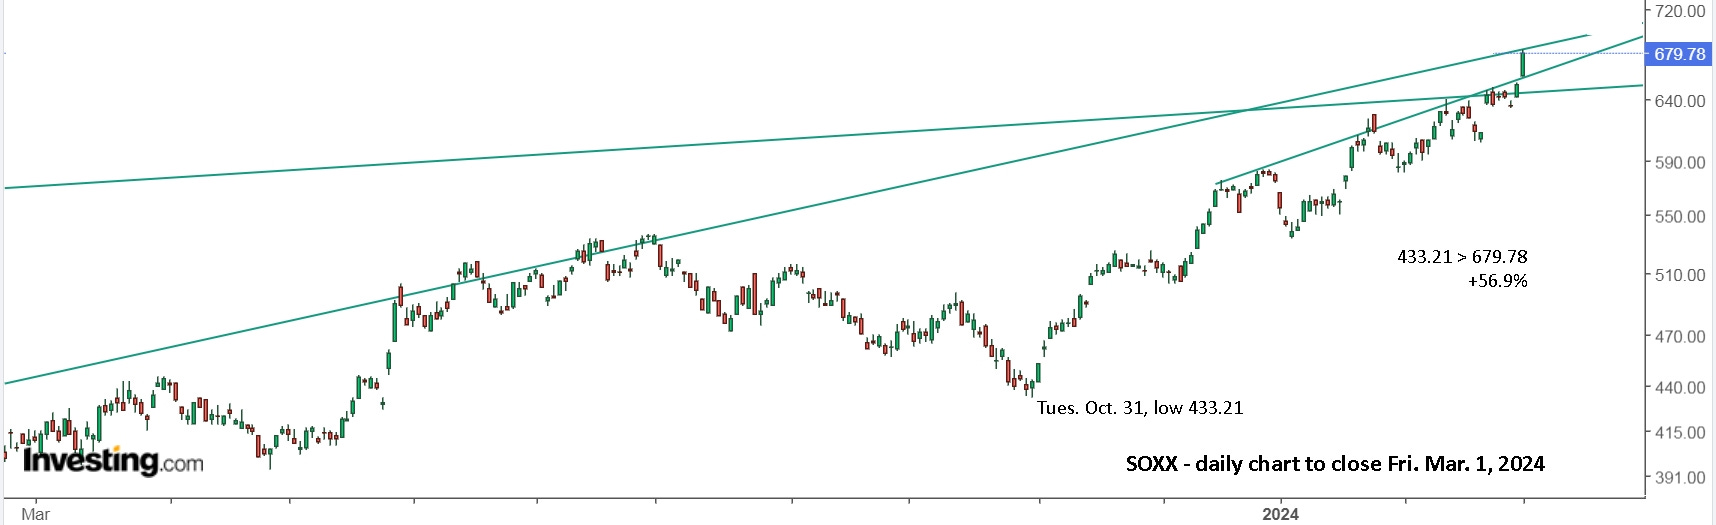
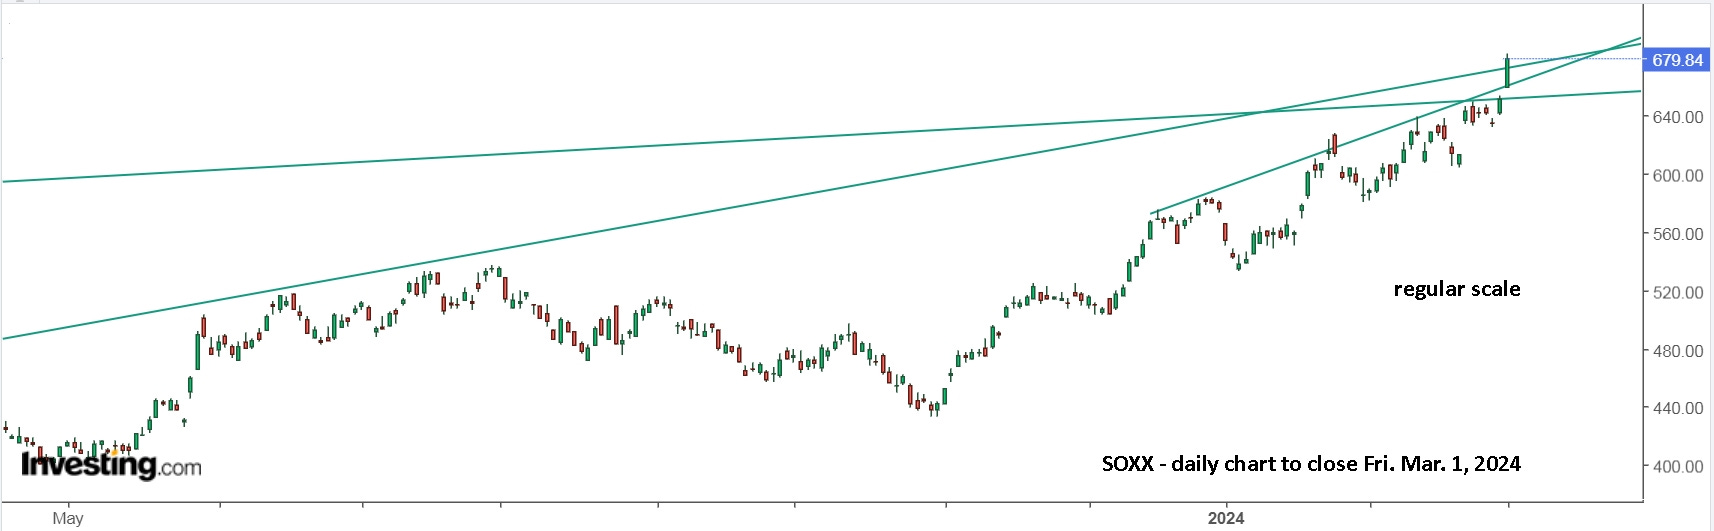
It’s interesting to note that the log scale can change perspective on the lines. Above, with log scale, SOXX is at resistance, and may hold resistance for the next several weeks as it did in 2023. Below, with normal scale, SOXX broke resistance Friday at about 670. I don’t know which is more ‘trustworthy’, but I’m going to continue using log scale since it keeps a better perspective on a monthly basis.
Now, let’s go back in time to 1986 through to 2008. Notice how high prices were in 2000 and, after hitting support in October, 2002, the uptrend resumed. That’s amazing!
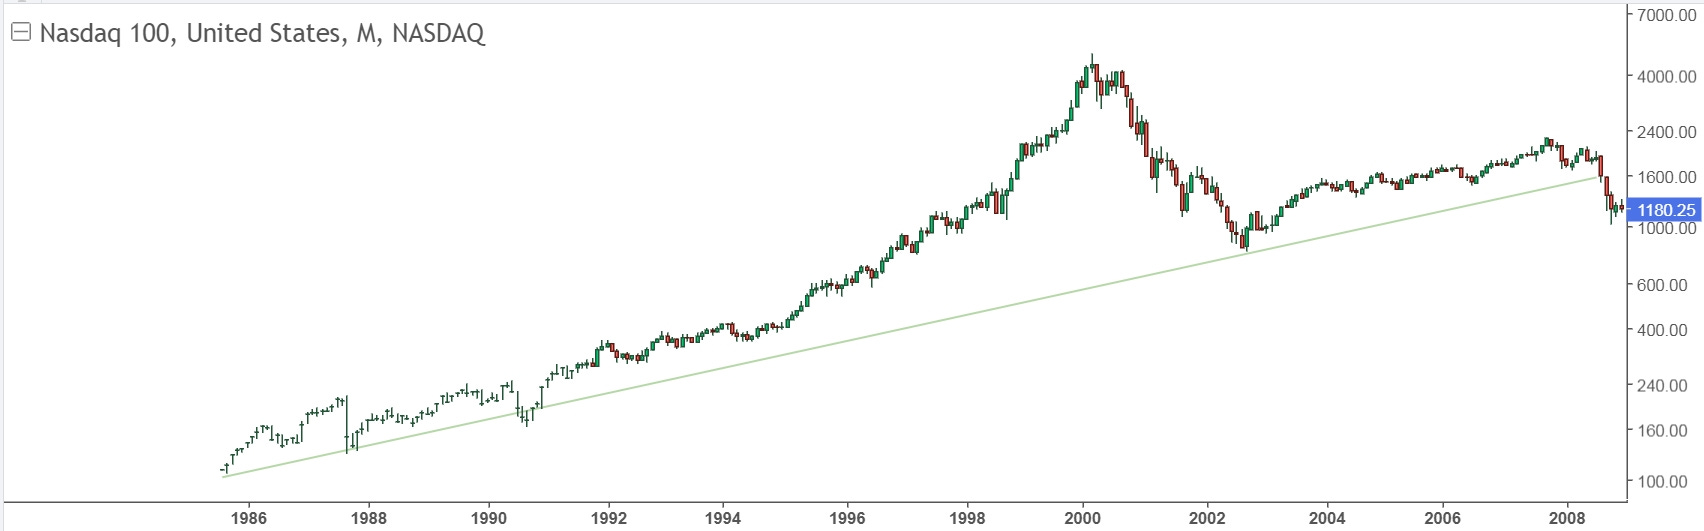
A similar trendline has held since July, 2010 and was touched multiple times, including 2020. Seeing that line at the time would have been extremely helpful. As you can see, the current level isn’t nearly as extreme as in 2000. That should provide some confidence to stay long while the daily chart suggests the uptrend is intact, and confidence to get out and avoid a 30% drop to the support line.
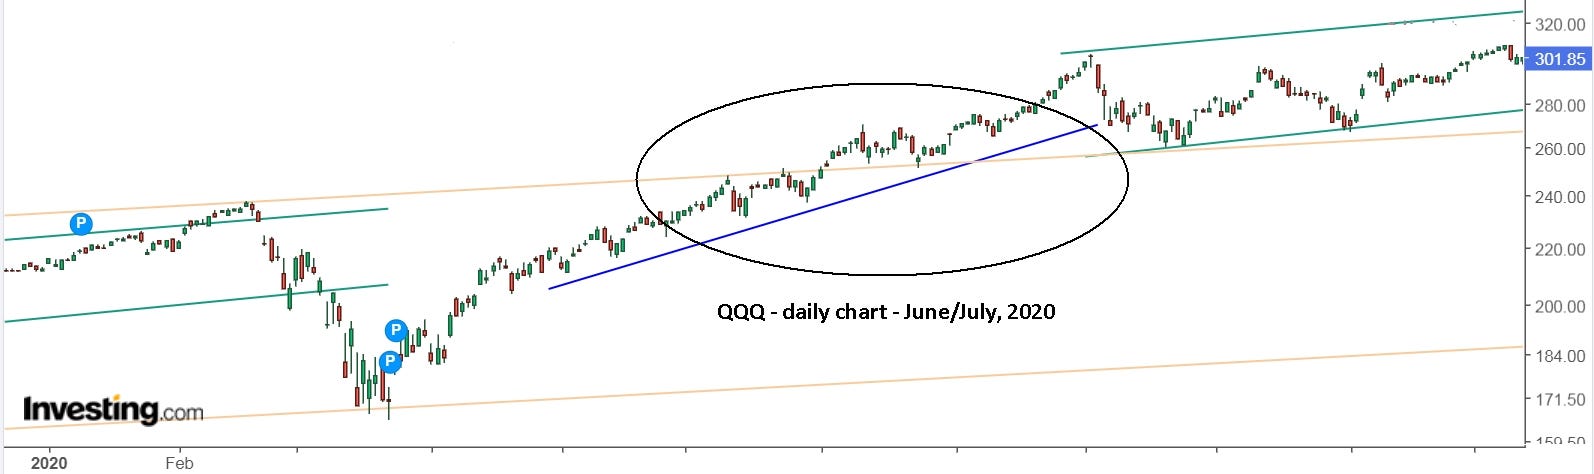
Sunday, March 3, update: Wow!!! After reading Sandimas’ comment on QQQ, I checked my chart and realized it was back to normal scale and not log scale. It completely didn’t show what he was saying. Once I reset it to log scale, the ‘picture’ changed completely. I then looked to see how the current setup compares to June - July, 2020. Amazingly, the parallel resistance line from 2010 was touched on Wednesday, Feb. 19.
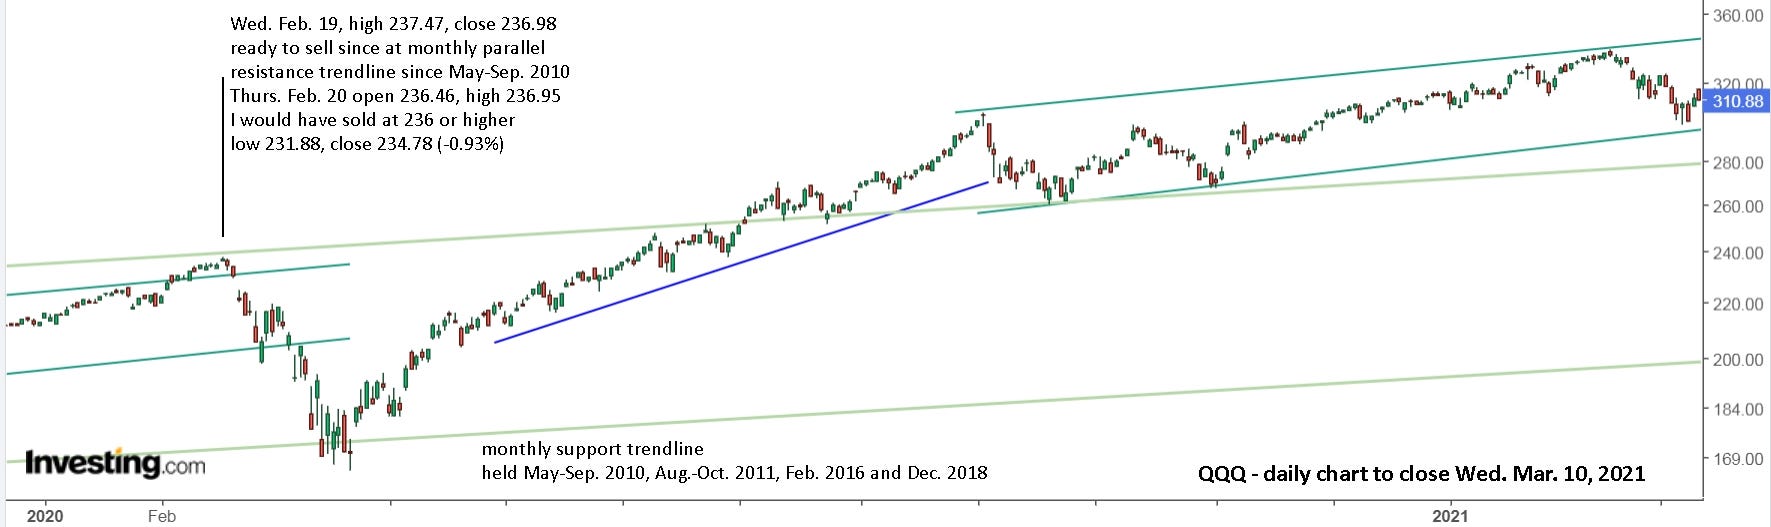
With it above the dark green resistance line, you should have been watching to sell anyway, but with the light green resistance line which extends back to 2010 getting touched, it was clearly time to exit. Equally amazing, is that the support line from 2010 broke slightly and held. That was a clear signal to go long again. Here’s a monthly view with the colour changed on the longer term trendline.
Here’s a weekly view. The precision of the 2020 covid move, hitting 2 lines that were on the charts for the past 10 years, is simple amazing! As Sandimas indicated in his comment, the resistance held in mid-August, 2022. It then held in July, 2023 as well. I get goose bumps thinking I could have seen that line in June, 2023 when I wrote, “Are you ready for a market drop?”
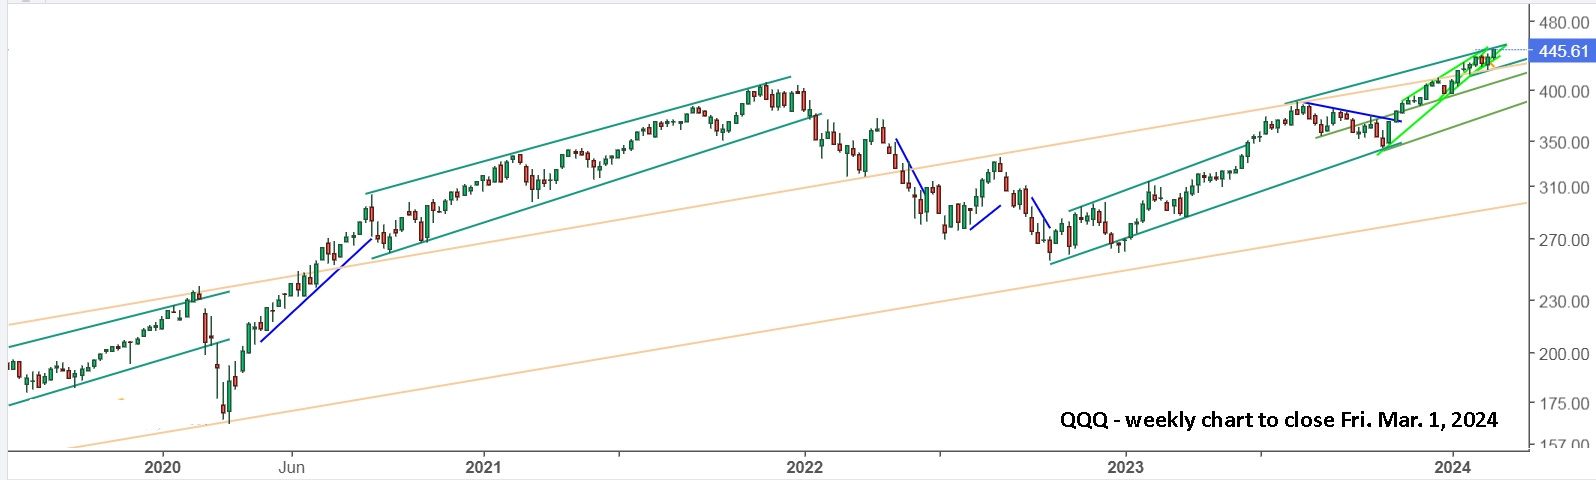
The current setup is very much like July, 2020. In June, 2020, the resistance held, like December, 2023. In July, the line became support, much like it is now.
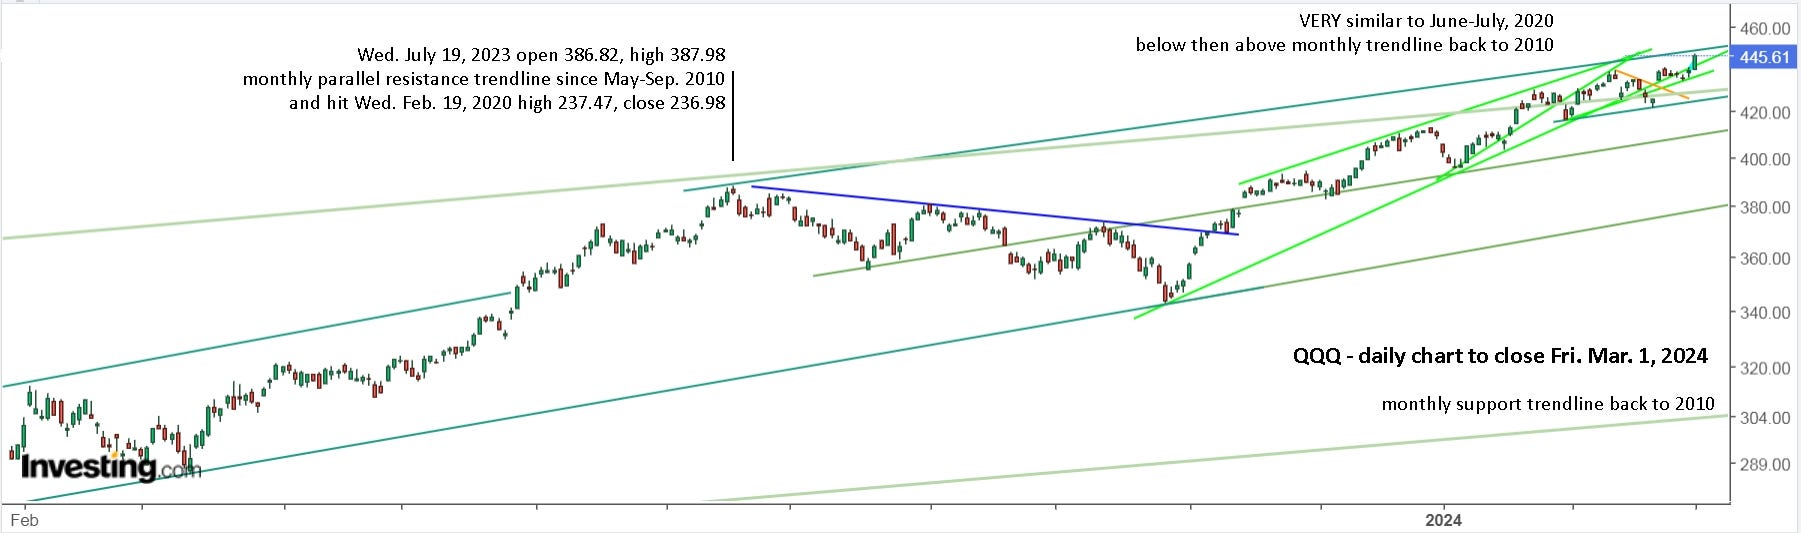
Here’s the current chart again, roughly lined up to 2020.
This is a great example of a picture being worth a thousand words.
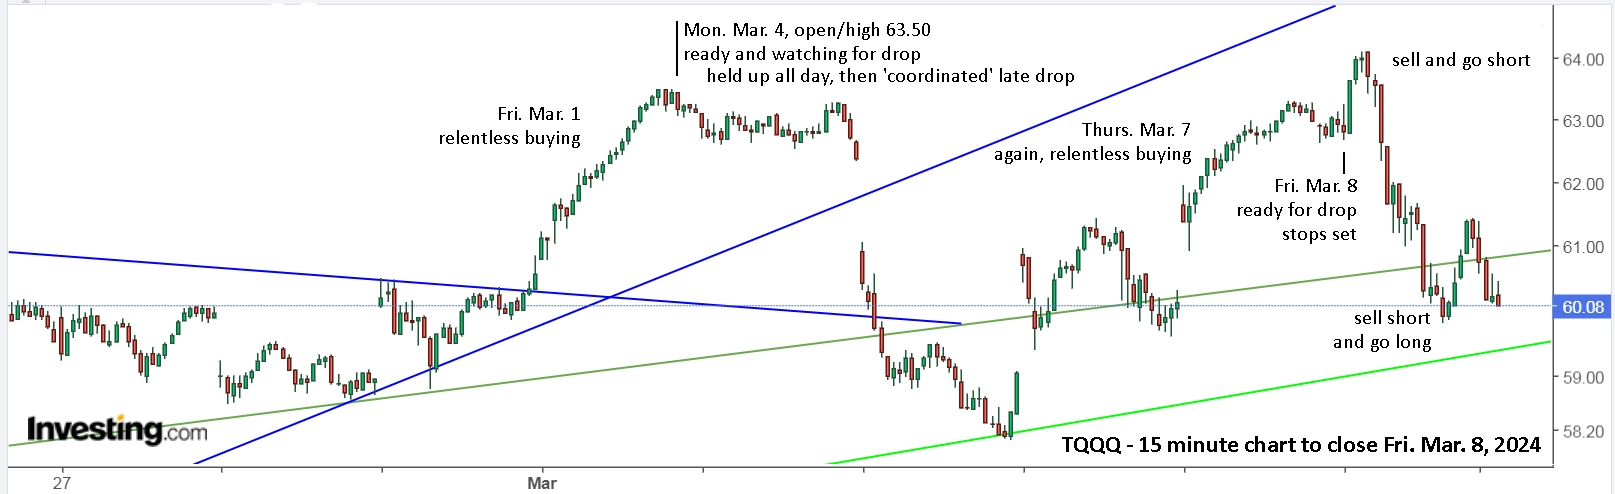
Update to Fri. March 8 : Selling on Friday continues to be the trend, only this Friday, you might have re-bought, 6% lower than you sold and back near support.
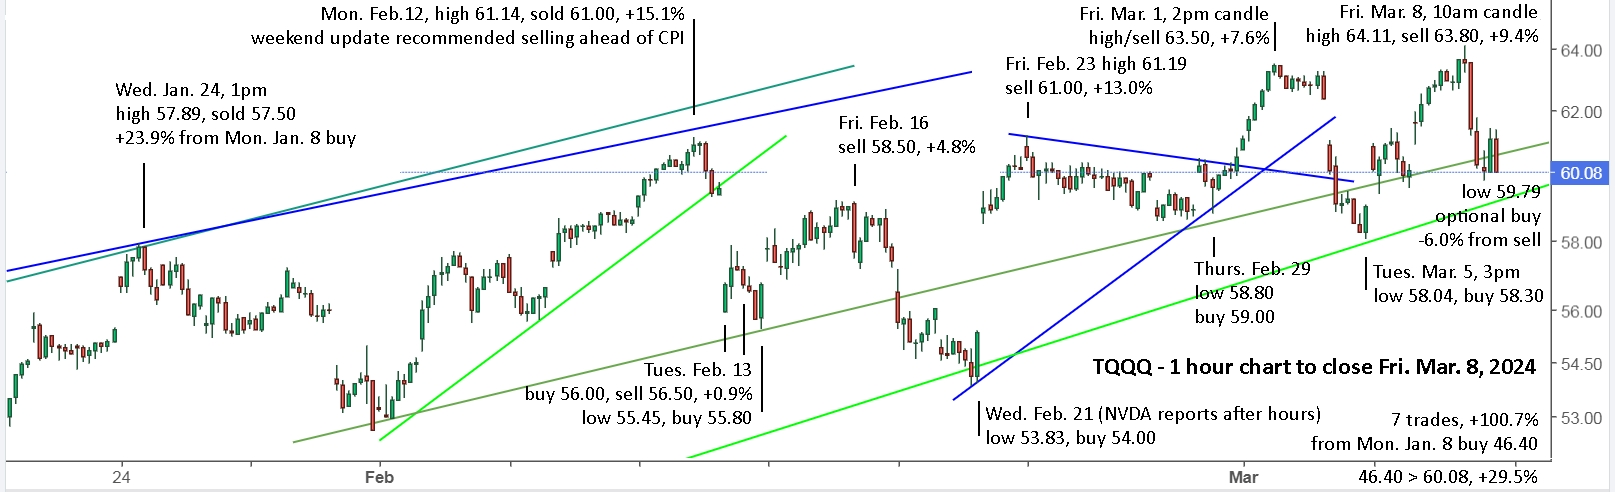
The buy at the open on Monday, Jan. 8 at 46.40 was sold Jan. 24 at 57.50 for a gain of 23.9%. Since then, following the trendlines and strategy, you’ve made 6 trades, for a compounded return of 100.7% on 7 trades, compared to just 29.5% if you’re still holding the original buy with no trades.
Going short with SQQQ can more than double your returns, if you get it right. With compounding, it quickly becomes tripling and quadrupling your returns. I won’t add them to this article, but the trade returns since Monday, Jan. 8 makes it very clear. Trading short might have a compounded return of 500% or more, I have no idea. You can calculate it if you want. For me, 100% on 7 trades in 2 months is plenty.
Despite believing in the potential and writing about it each week, I failed to actually do it myself, with a large position. So, it’s a complete reset for me now. Last week, I managed to follow my strategy on Wednesday and Friday, but missed the power move on Thursday, just like I missed it on March 1. It simply made no sense, and having missed the early buy, I didn’t want to chase it. My solution, which worked well on Friday, is to simply set the stop order, long and short, and then trade the position properly once you’re in.
The market indexes are back near possible support on a daily view. Break of support could lead to a large drop to monthly support (light brown trendline), so be aware of that potential.
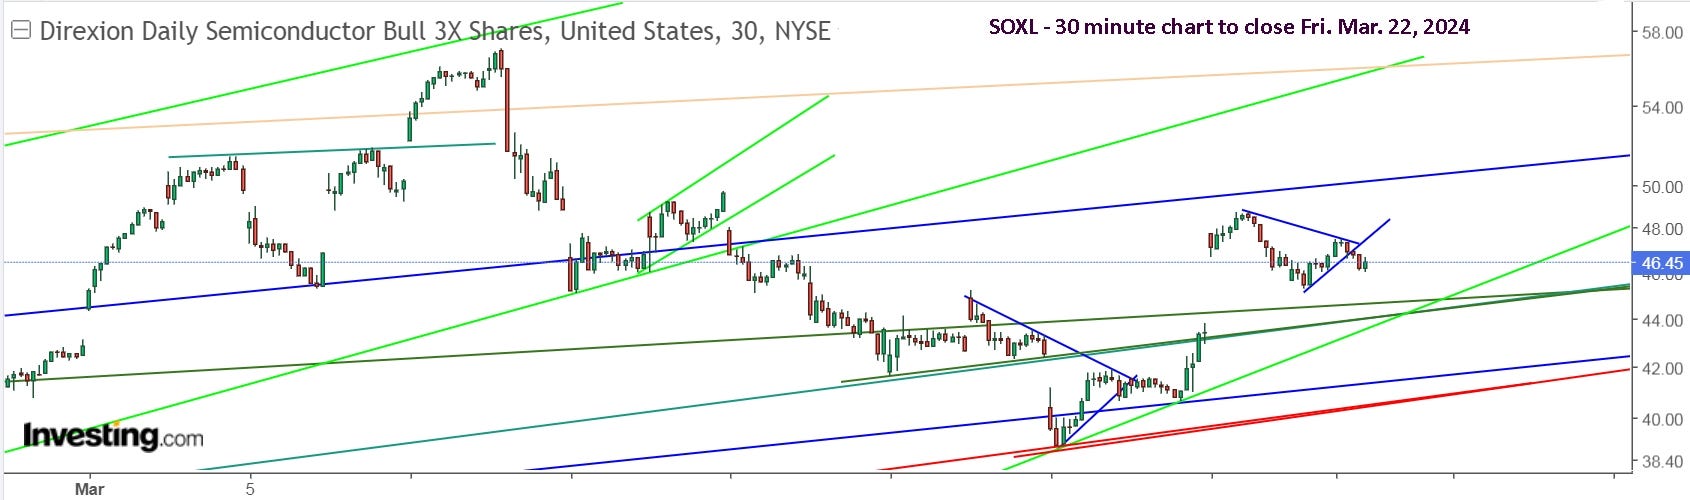
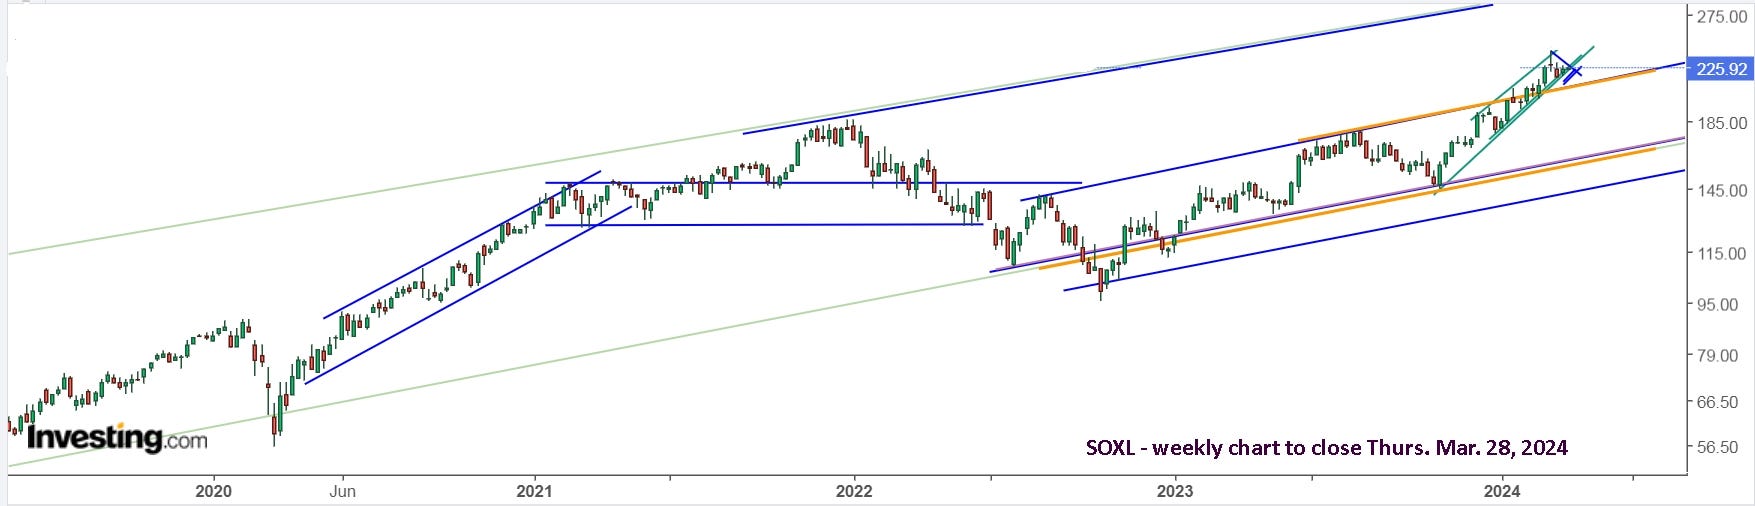
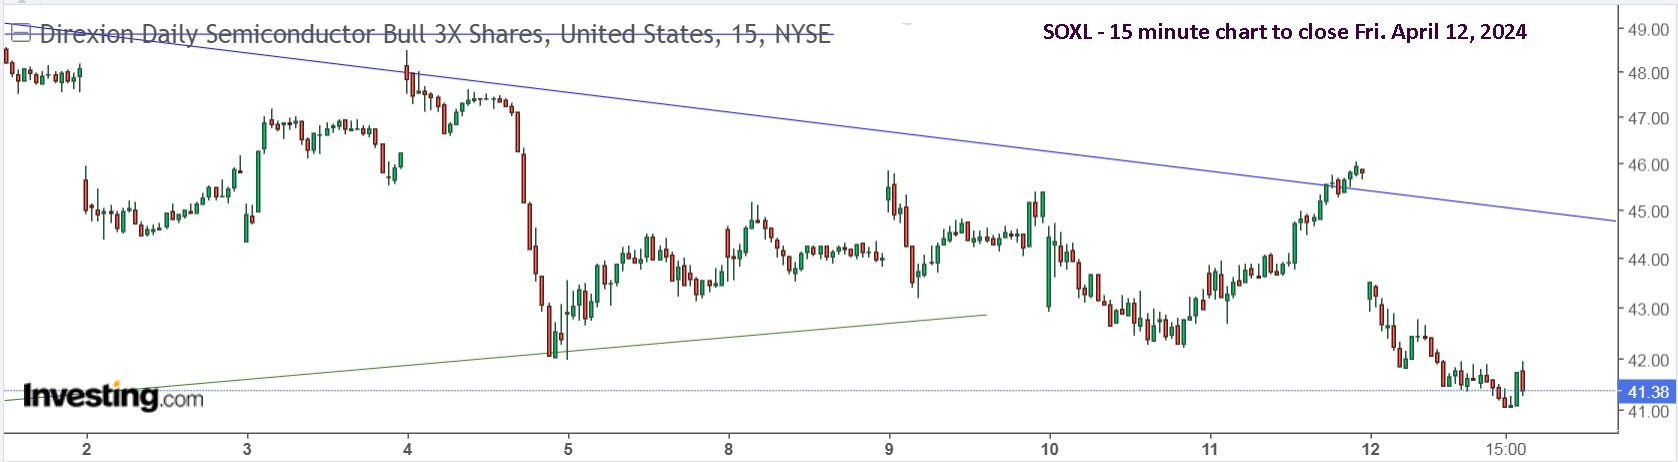
So long as everything stays within the channel, there should be nothing to worry about. For those who want even more ‘horsepower’ than TQQQ, here’s a look at SOXL.
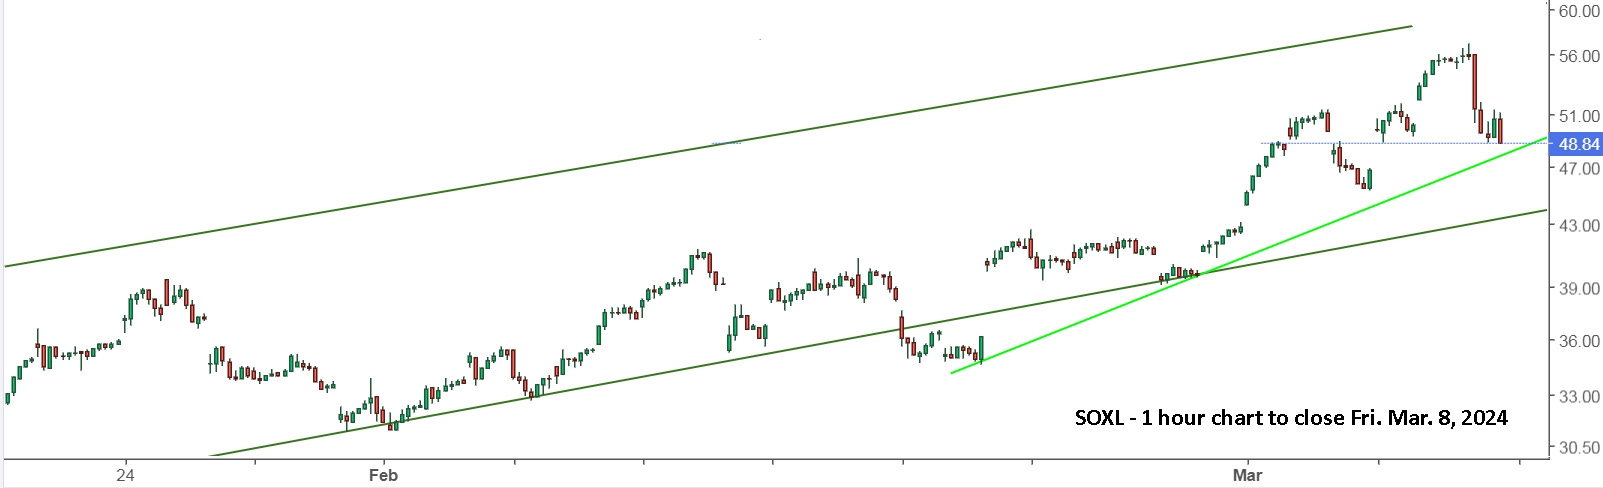
I re-bought small positions in TQQQ and SOXL on Friday after trading them successfully long and short with SQQQ and SOXS. We’ll see how I do next week.
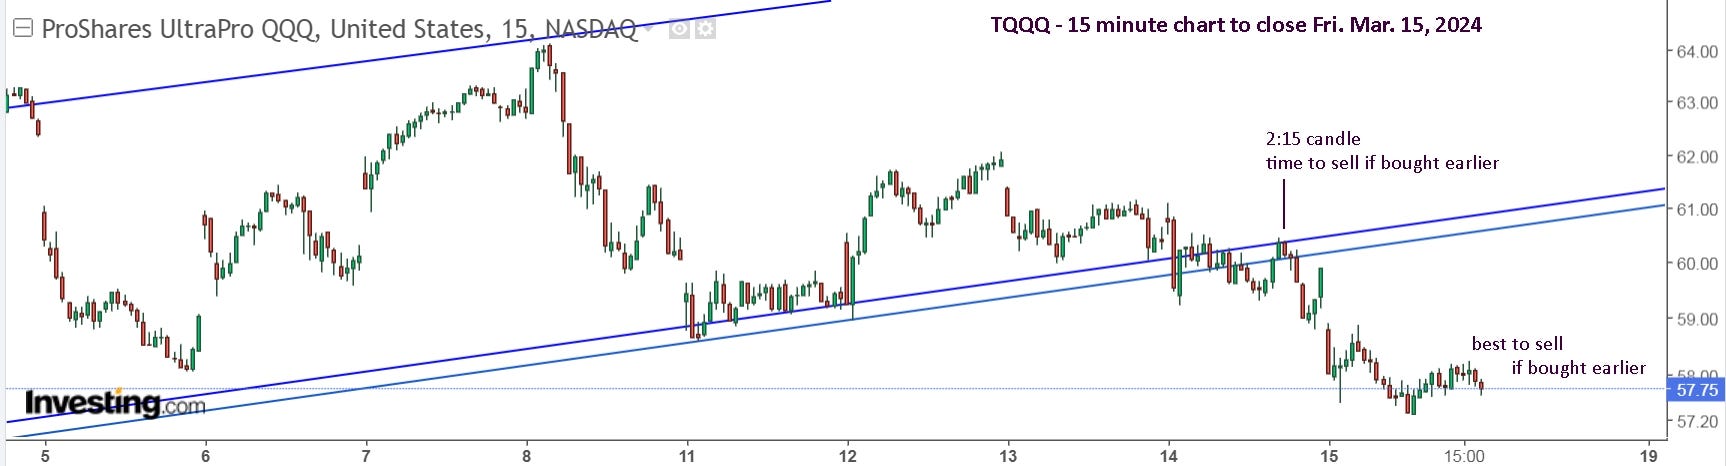
Update to Fri. March 15 : In last weekend’s update, I wrote, “Selling on Friday continues to be the trend, only this Friday, you might have re-bought, 6% lower than you sold and back near support.” This week I’d like to add, that buying near or at support with momentum still down, isn’t a great idea. Also, a 6% discount on a leveraged ETF that you’re up 100% on with 7 trades in 2 months, isn’t something to jump at. Sit back, relax, be patient and wait for the setup to come to you, and preferably early in the day and a cushion by the end of the day. Friday, March 15, wasn’t a good setup for either TQQQ or SOXL and I shouldn’t have re-bought small positions.
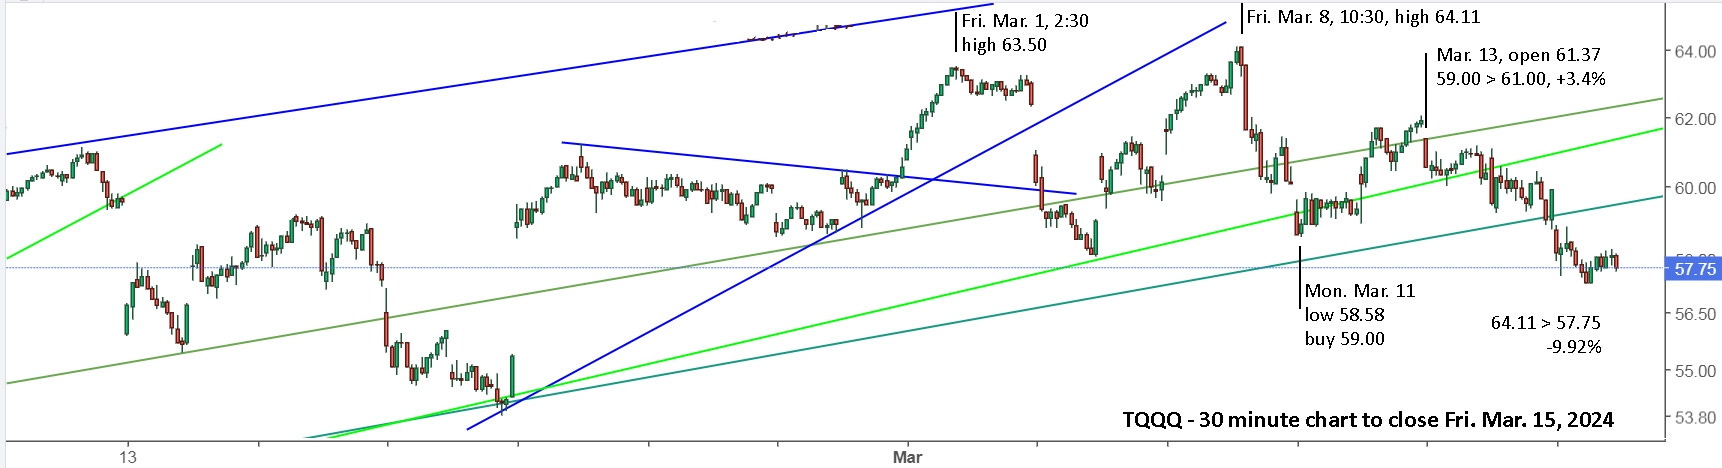
Monday, March 11 provided an early opportunity that you may or may not have bought. Waiting for a better setup is perfectly okay, and better if you want to have minimum trades. Wednesday, March 13 was a sell on the early drop. Thursday may have been a tempting buy on the 10am reversal for active traders, but you would have stopped out late in the day for breakeven, and better to have sold after 2pm for a small gain as it hit resistance and started to drop.
Friday was a day to look short or remain on the sidelines with your 100% gain fully intact. If QQQ gets down to support on Monday, then you could look to buy. Conversely, a gap higher could be a buy with a stop sell.
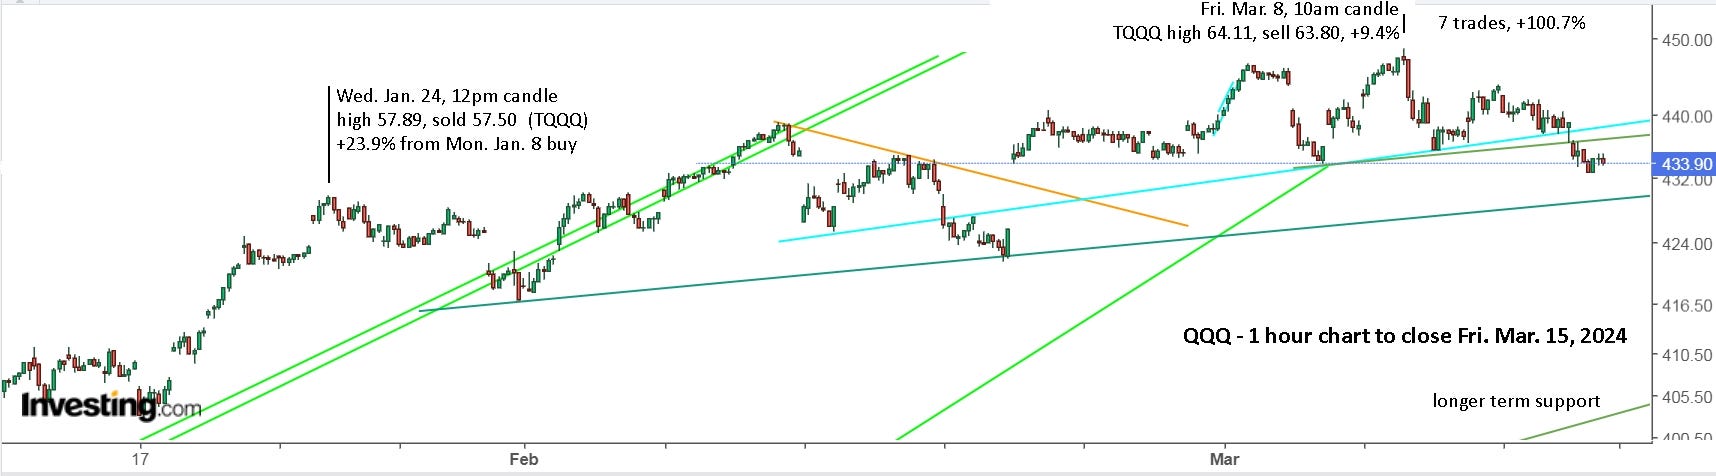
It’s also good to note that QQQ hasn’t moved up much from the first sell on Jan. 24 for +23.9% with TQQQ, yet trading the range gave a compounded return of 100% in 7 trades. For me, the effort is well worth the reward and allows me to then be patient and wait for a good setup. Heck, you could be +100% for your entire account and it’s only March. You could even do nothing the rest of the year! No point in that though.
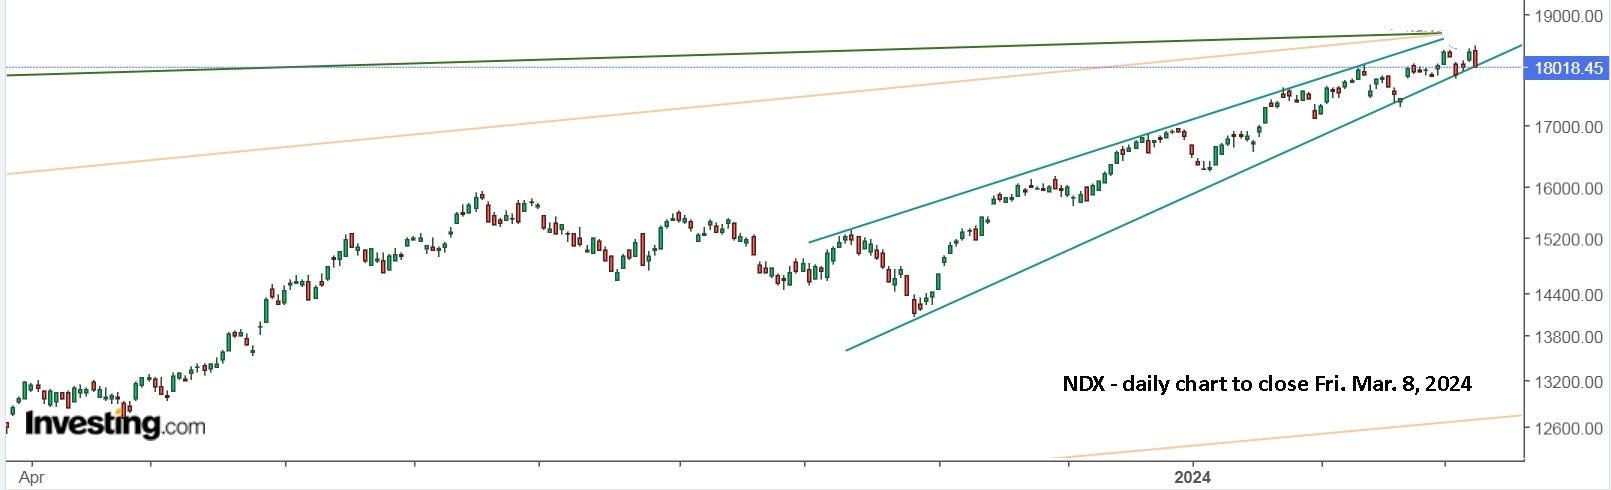
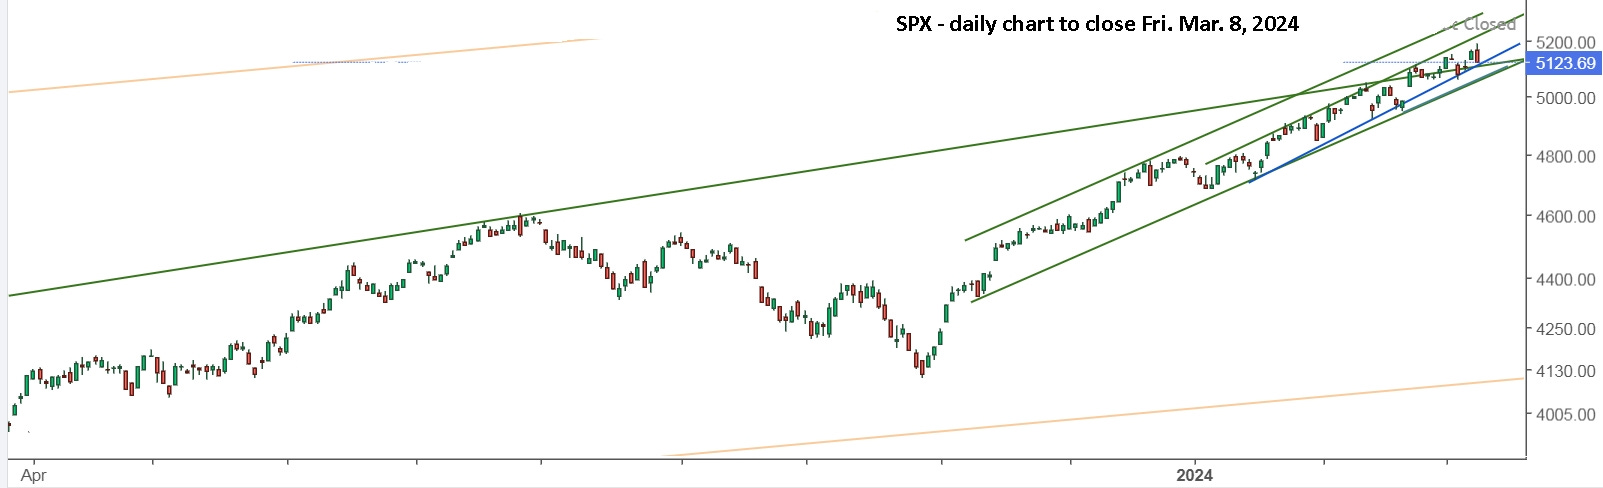
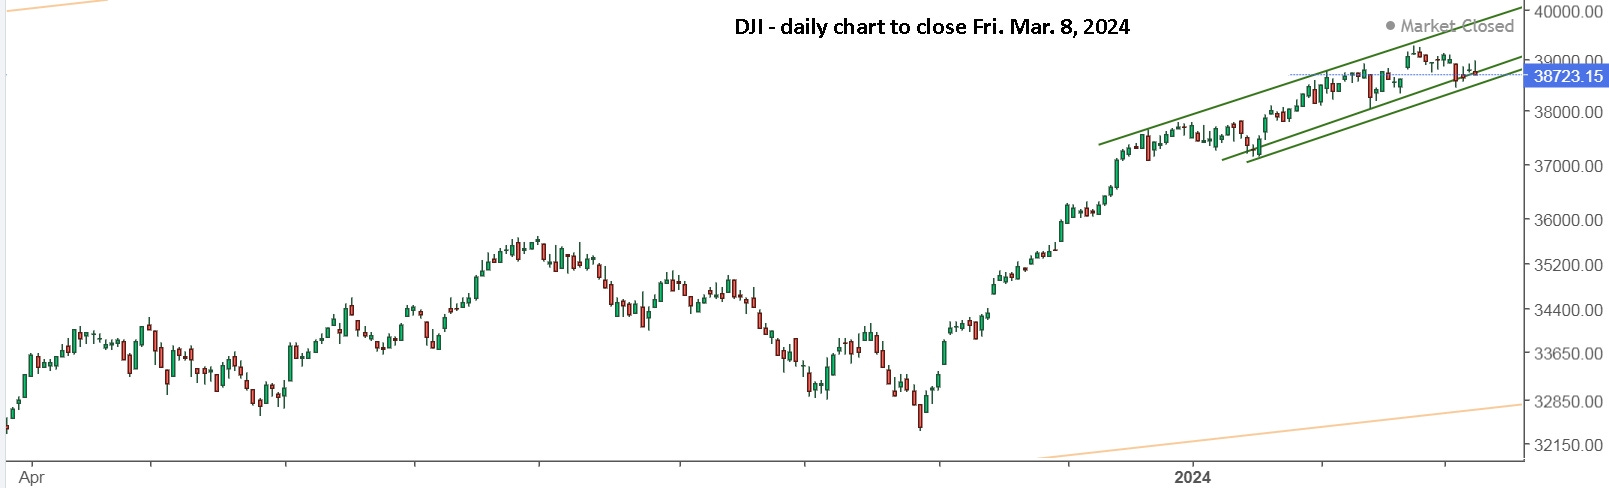
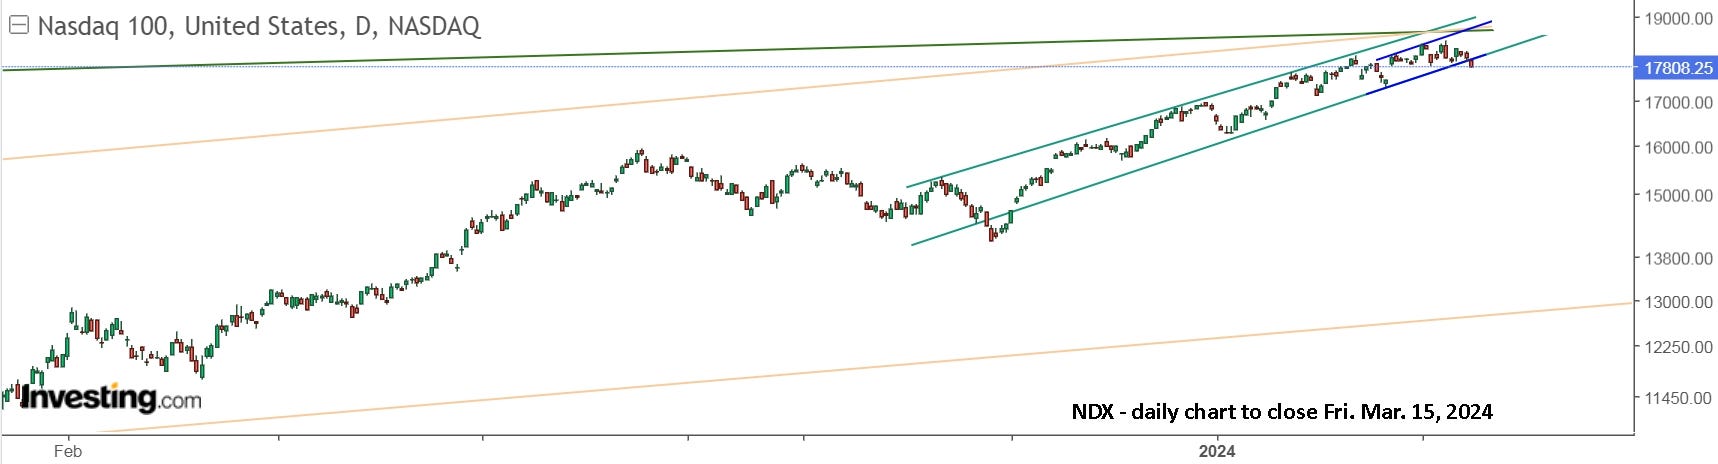
On the daily charts, SPX and DJI dropped a bit last week, reaching support, and NDX broke the support trendline from October, 2023. A parallel line from the October low should now be drawn as a guide. Since you’re out, maybe short, and have locked in gains, you’d be happy to see the markets drop further. On the flip side, the markets could turn up sharply next week after consolidating sideways for a month.
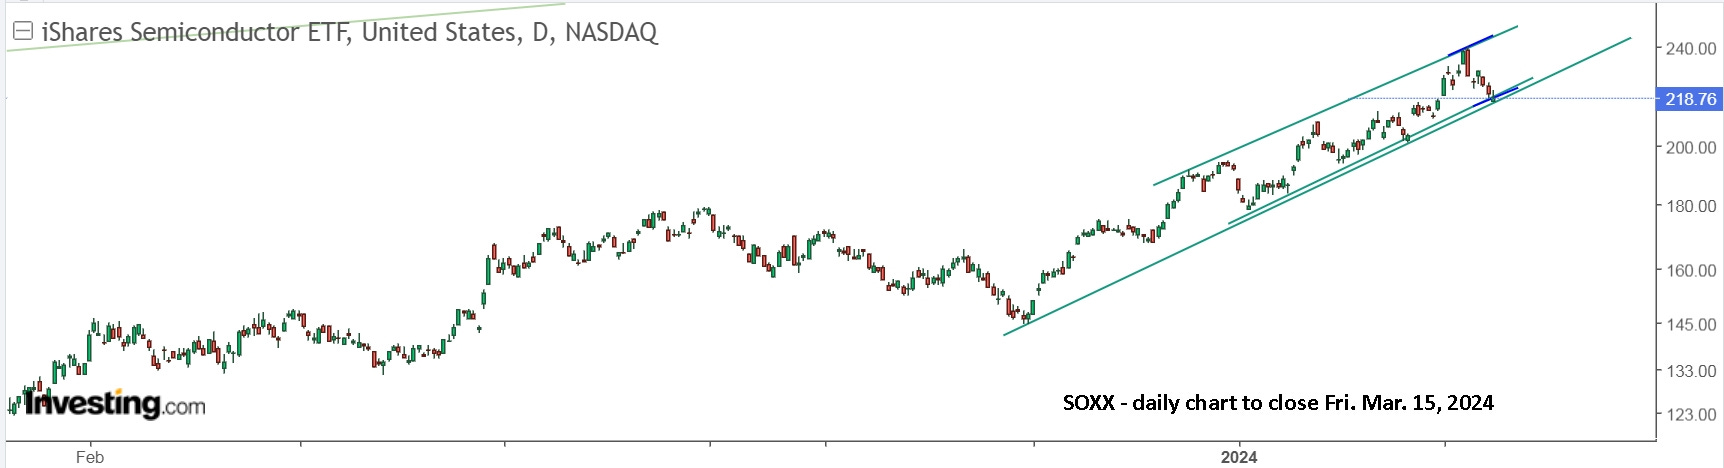
Last week, I suggested SOXL as a possible trade. It’s more erratic than TQQQ, but it also moves more, so it can be worth the effort. Its base ETF, SOXX, is now at support, so when it turns up, there’s plenty of upside potential.
I don’t expect the AI craze to suddenly end next week, so SOXL is my focus. I bought some at 41.66 off the open on Friday, bought more as it moved up and sold the extra shares when momentum was lost. I decided to hold my low buy for Monday.
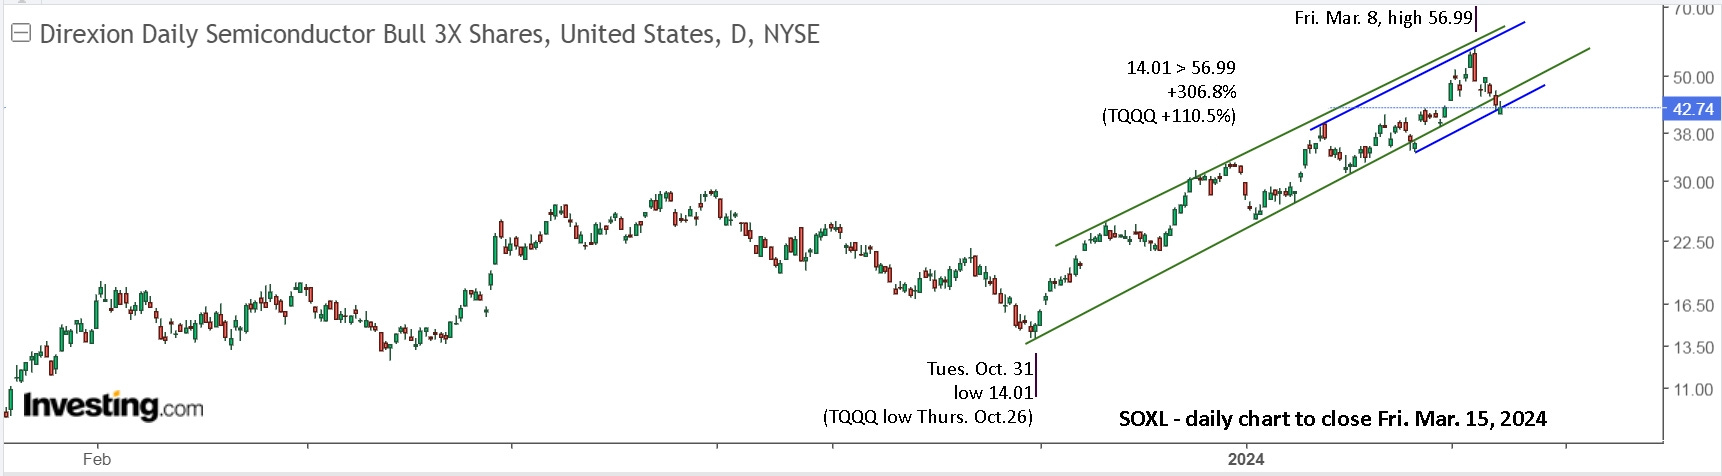
A move from 42 to 70 is +66.7%, so worth the effort. And note, it nearly tripled the return of TQQQ since the October low, if you bought and held (+307% vs +110%). If you traded it effectively, it provided monster returns. Going forward, I’ll track the SOXL trades, like I did with TQQQ for the past 2 months. Enjoy the weekend!
A weekly view shows a clear upward channel dating back to 2009!
Sunday bonus: I decided to put Avi’s targets onto charts for easy reference. Mostly I’m ignoring everything he writes, and he hasn’t been posting every Monday, like before. Possibly because he’s been generally bearish with the markets rallying against him.
Here are the highlights of what he wrote Monday, March 4, “Something Bad May Be Coming This Summer”. “The 5048SPX level is support for the coming week, and if it holds, then it sets up a rally to the 5350+ region over the coming weeks, which can lead to a major market top. And, when the market sees a sustained break of the 5048SPX level, that will open the door to a major market decline in 2024.”
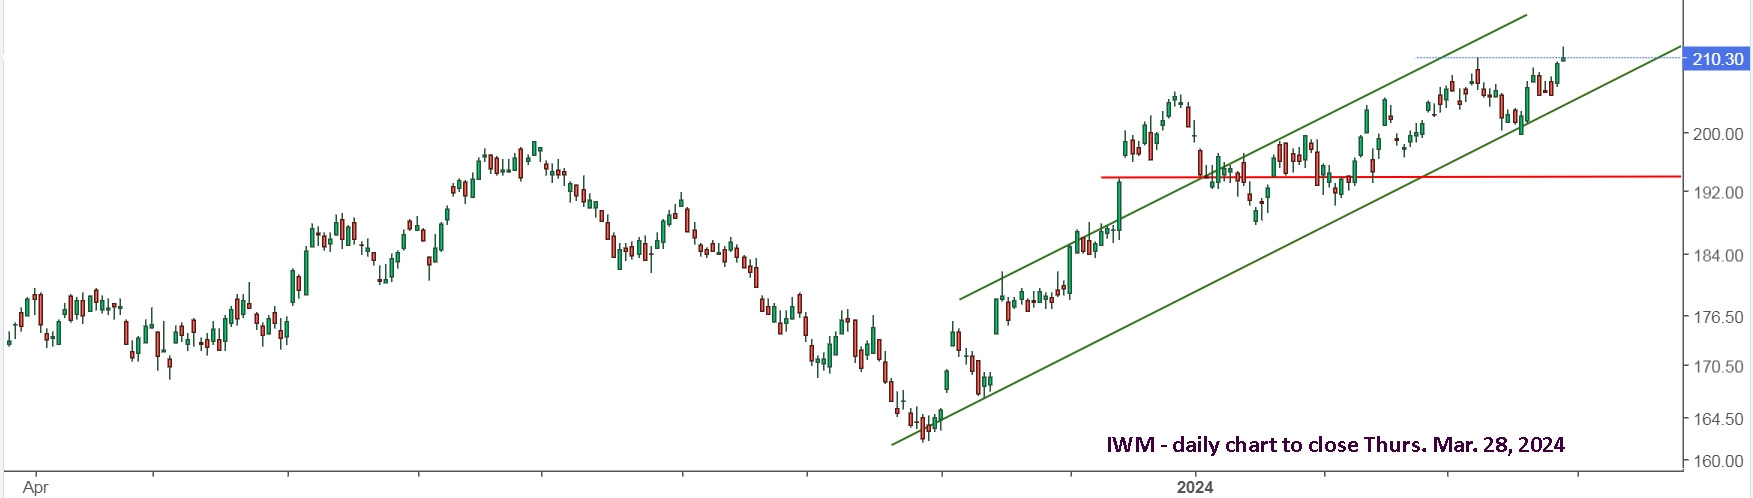
For some reason, he then switched to IWM as his reference on Monday, March 11, “It Is Time For A Serious Dose Of Caution”. “The market mood seems to be turning towards extreme bullishness. If the market provides us with a specific set up in the coming weeks, we can see a 25% decline this year. As long as IWM remains below 214 and then sees a return back down to the 194 region in the coming weeks in an impulsive manner, then I am going on “crash-alert.” If I see confirmation for my concern over the coming weeks, then I am likely going to predict that the IWM will return down to the 130-150 region, with the higher probability target bottom being closer to 130 (at least at this point in time).”
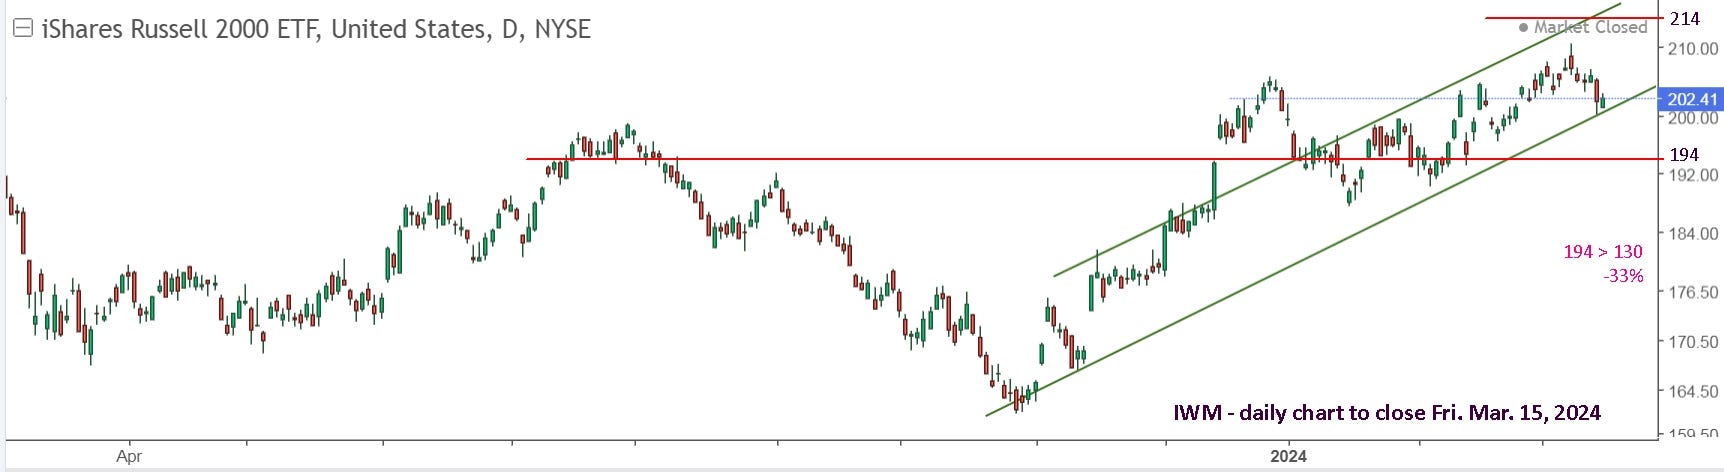
Let’s see how our trendlines do in comparison to Avi’s predictions!
Update to Fri. March 22 : In last weekend’s update, I wrote, “I don’t expect the AI craze to suddenly end next week, so SOXL is my focus. I bought some at 41.66 off the open on Friday, bought more as it moved up and sold the extra shares when momentum was lost. I decided to hold my low buy for Monday.” Before getting in to the details of last week’s price action, I’d like to show a longer term view for reference.
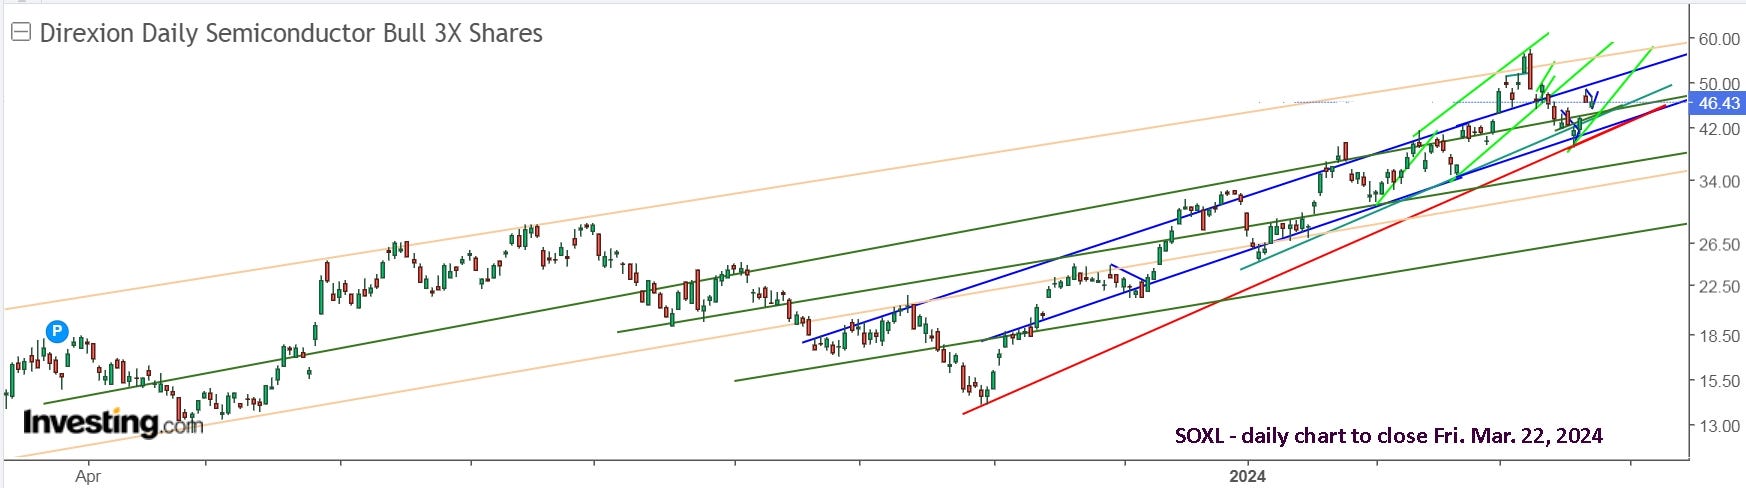
Clearly, the trend is still up, and I have a lot of lines drawn. I’m finding them helpful, especially since I’m trying to remain long but am acutely aware of the potential for a big drop. Here’s a monthly view of SOXX. The immediate question that comes to mind for me, is “Are we now at the beginning of 2021, or the end?” I’m guessing, the beginning, so am expecting a fair bit of sideways action the rest of 2024.
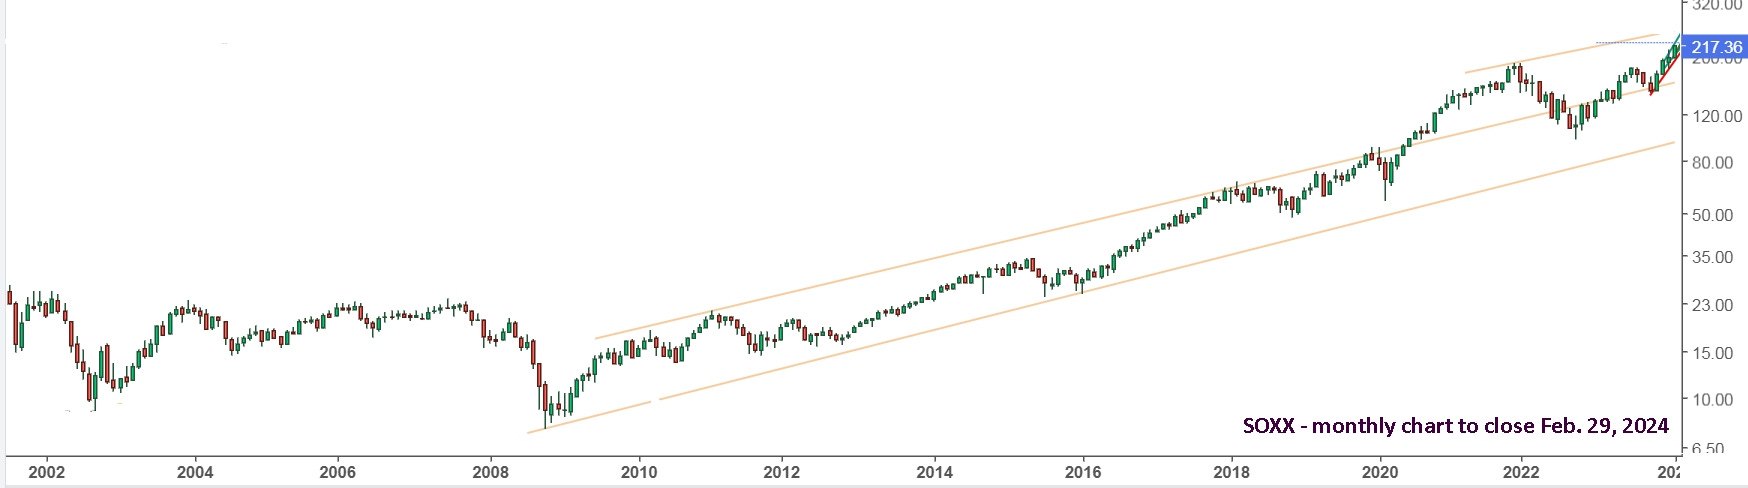
Now let’s zoom in. The orange/yellow resistance line goes back through the highs in May, June, July 2023. The red support line is actually much steeper, and dates back to the Oct. 31, 2023 low.

My Friday, March 15 buy at 41.66 sold early Monday, March 18 on a stop at 44.25 along with my earlier buy at 44.50. If you weren’t holding shares, you may have also bought and sold, like me, or you may have put a stop buy 1% above the open, 44.87, and it only reached 45.21 (+0.76%). I should have raised my stop to 44.50, but I wanted to give it some room to bounce around before possibly moving higher.
The low on Tuesday was below all support lines that were on my SOXL chart, but not significantly, and SOXX was at its final support, so I was watching for a reversal. That low now provides a new ‘final’ support line on my SOXL chart.
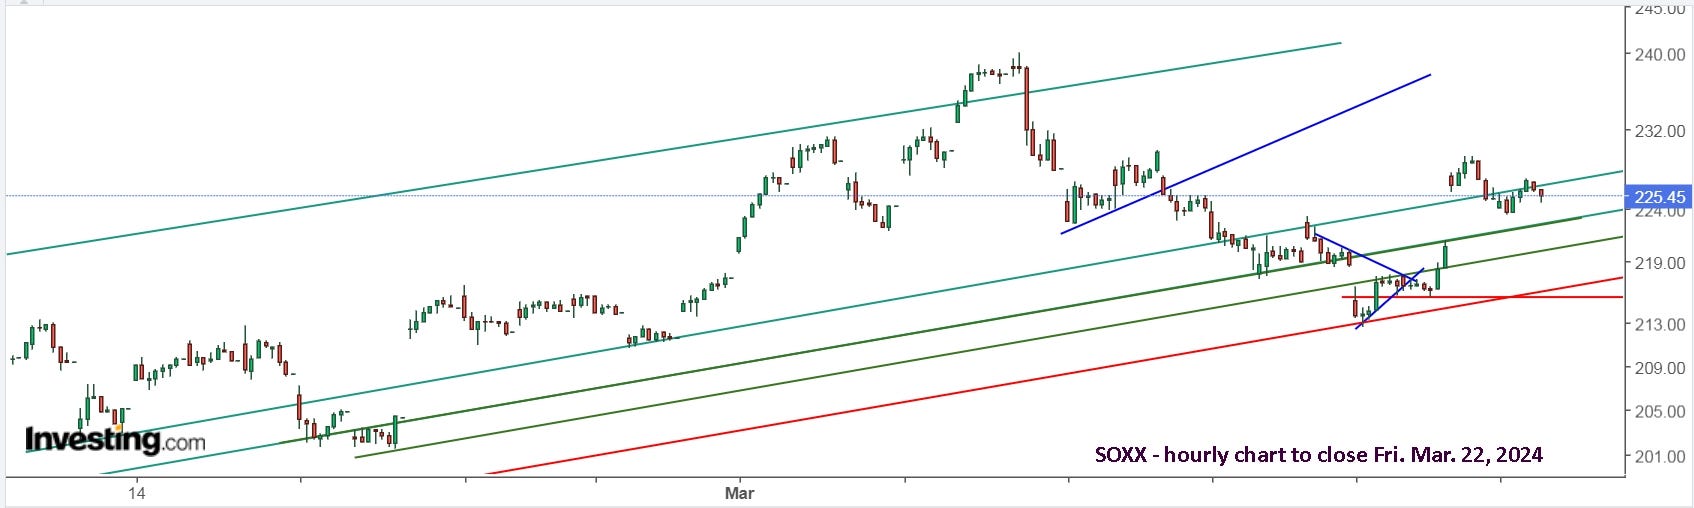
On Thursday, after a hard move up from blue support and nearing blue resistance (on the SOXL chart), I took the win. You can also see a possible resistance/support line on the SOXX chart, which I will now add.
I’m trying to squeeze out extra gains with a smaller position, so I bought and sold and re-bought SOXL on Friday. My ‘minimum trade’ strategy would have bought Tuesday and still be holding, with no trades, waiting for it to reach either of the light green trendlines. We’ll see how that strategy works going forward.
Update to Thurs. March 28 : Here’s the 30 minutes SOXL chart. It gapped lower on Monday, near support and moved up hard. With it near support, buy and put in a stop sell. Tuesday was a sell early as it fell and good to put in a stop buy higher.
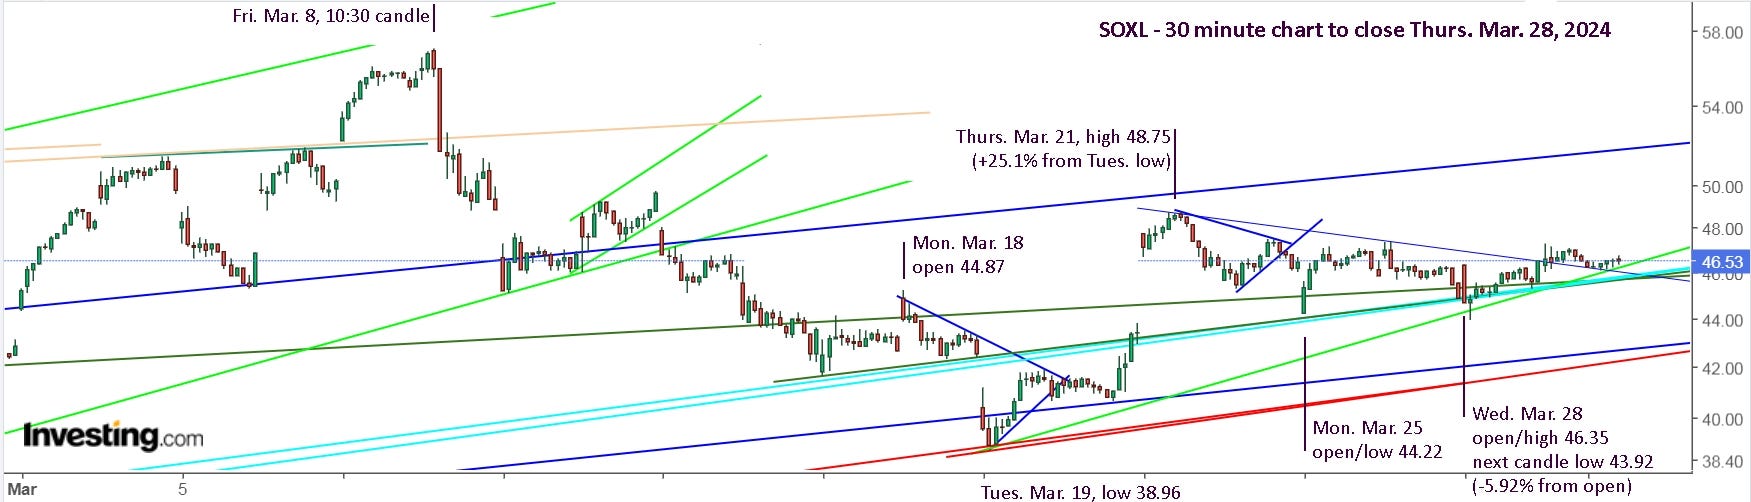
Friday broke the short term downtrend line, but only slightly, with no follow through momentum, so I sold and am on the sidelines for the weekend.
The long weekend has given me extra time to review everything, and I’m mostly content with my strategy and actions taken. Both TQQQ and SOXL were a sell Friday, March 8 and could have been traded for shorter moves as they fell. Following the concept of minimum trades and weekly reviews, you’d have been out and watching to buy Monday, March 18, which was a buy and sell as it fell for both.
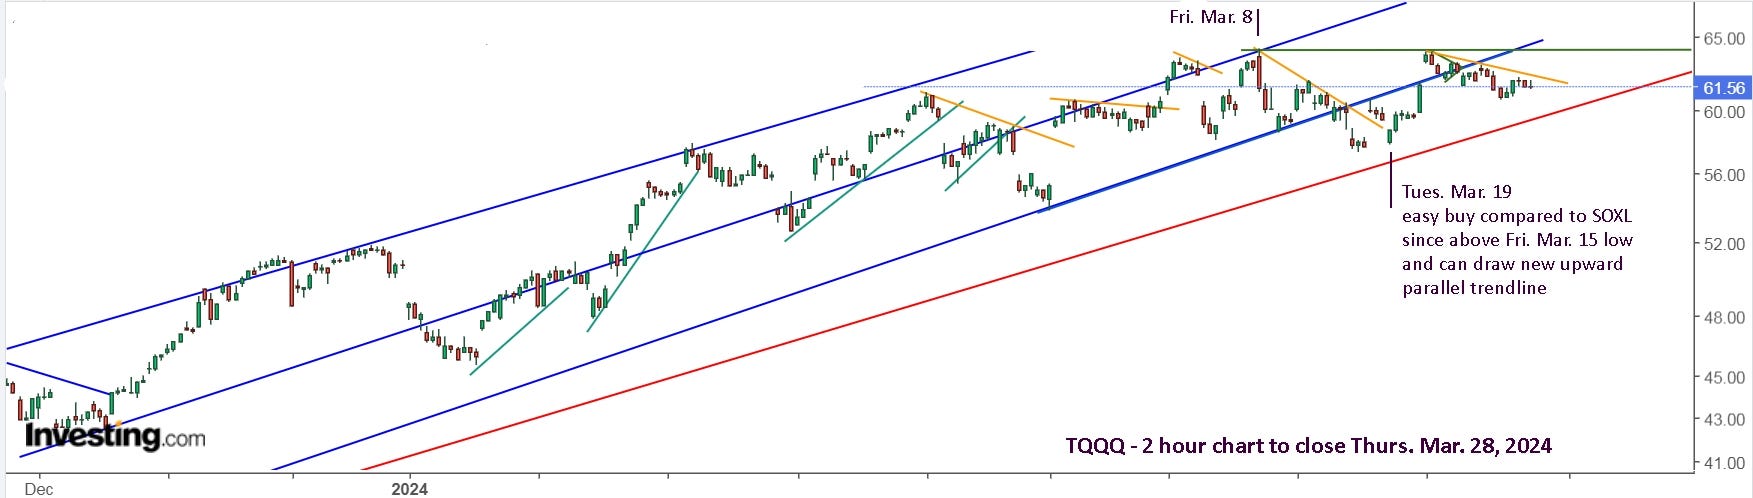
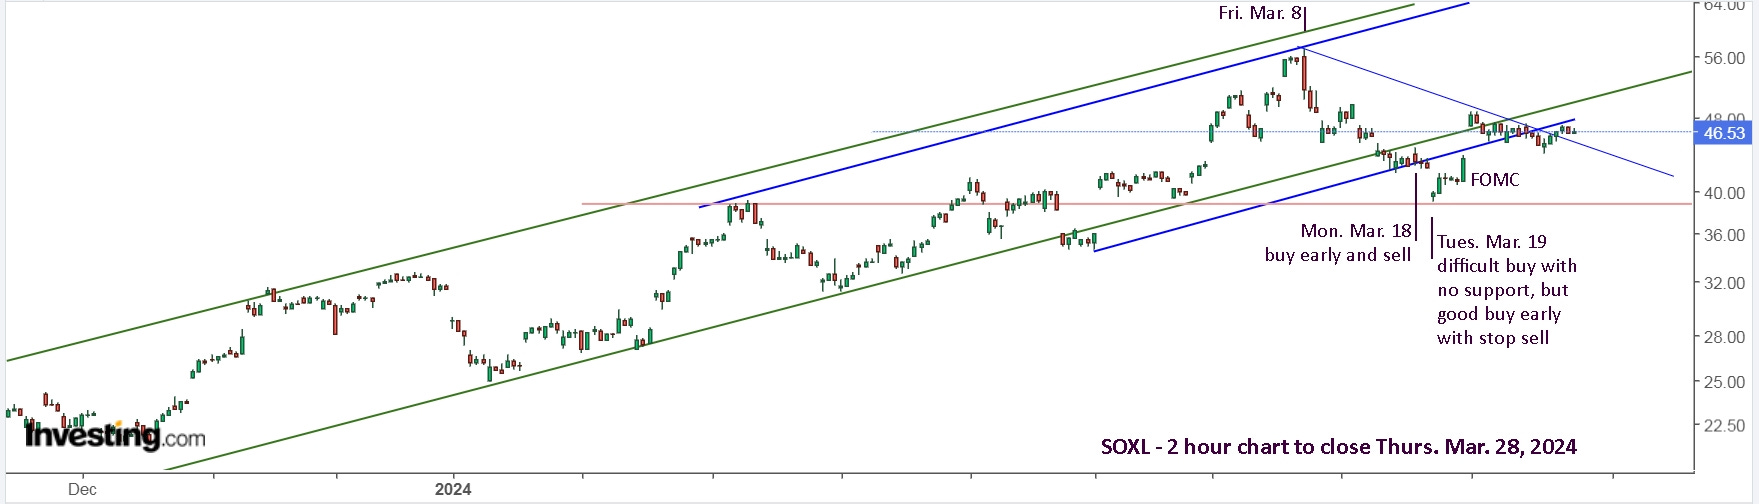
Tuesday, March 19 was a buy for both, but it was much easier to buy TQQQ since you had support lines in view and the price was still above Friday, March 15 low. If you didn’t buy then, both were a buy after FOMC on Wednesday, March 20, but that wasn’t easy either as the prices swung drastically both directions after 2pm. Both were a sell on Thursday, March 21 when they lost momentum.
For this past week, both were a buy on Monday, March 25 and a sell on Tuesday as they lost momentum and were bumping into downtrend resistance. Resistance was arguably broken on Thursday, but I played it safe and am on the sidelines.
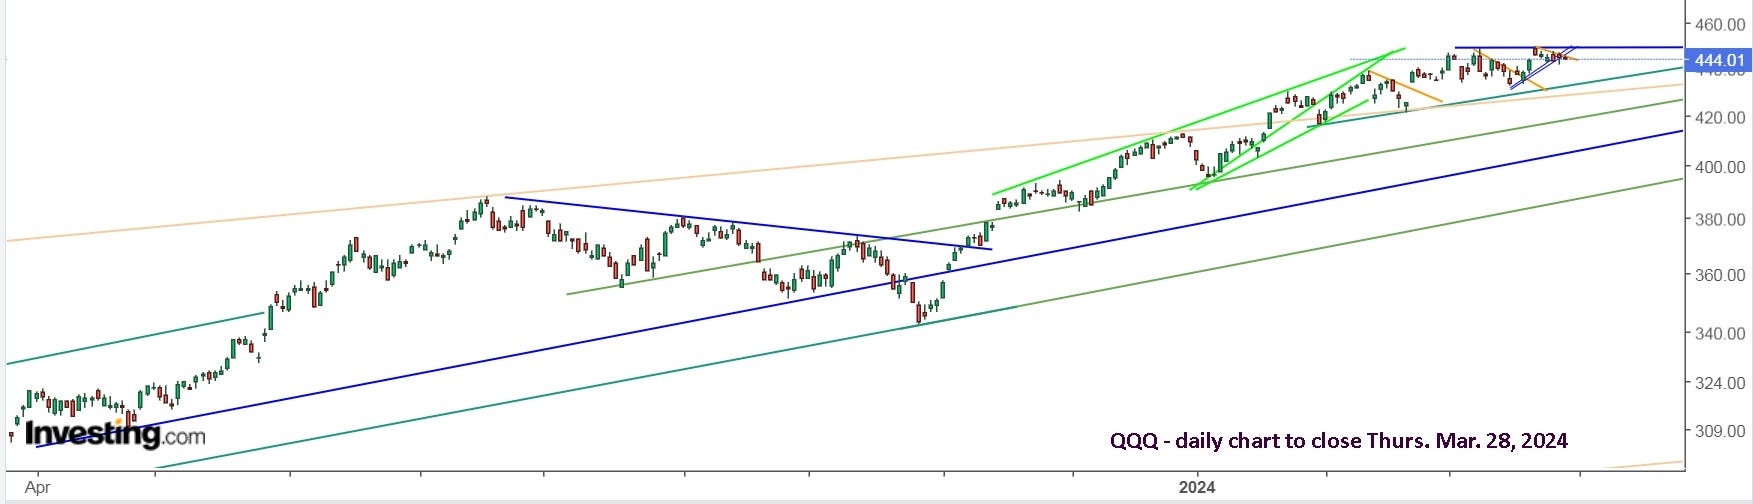
A longer term view may be useful. QQQ has flattened out and is above the orange resistance line which dates back to 2010, but was exceeded from July 2020 to November 2021 when it topped out. I prefer to play it safe, locking in gains since the reversal late October 2023 and will be more bullish if it pushes above 450 and then 500.
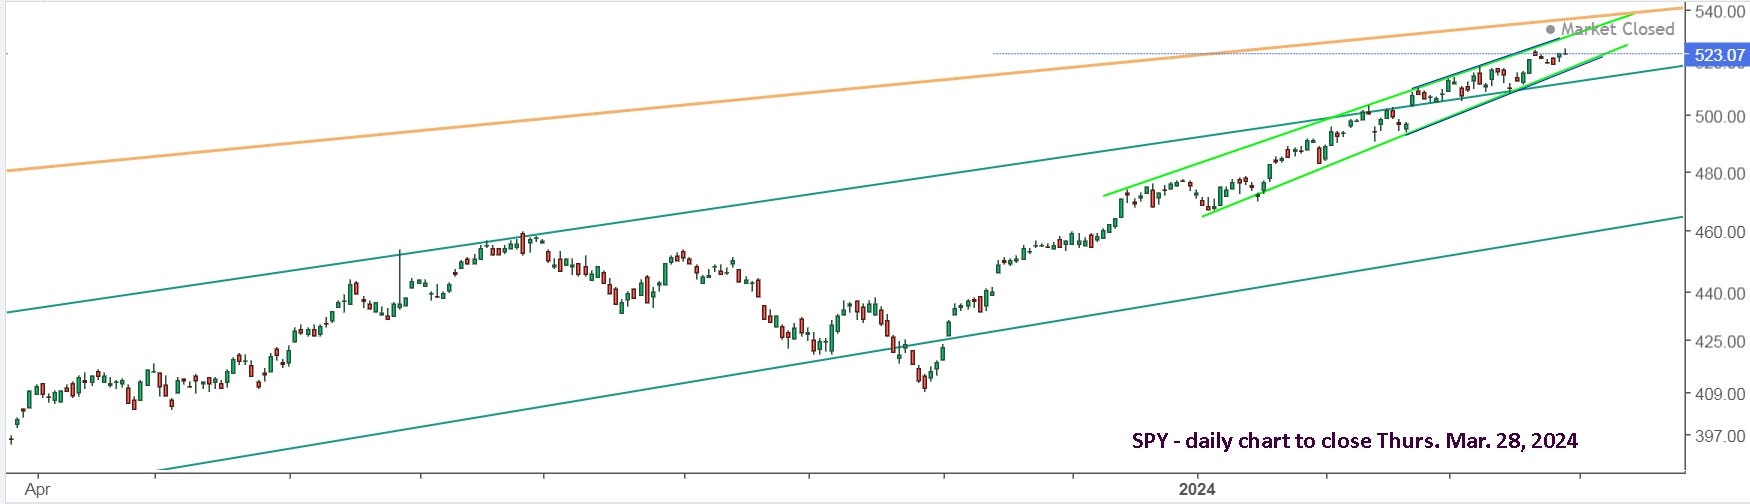
SPY is still nicely within its rising channel, so I would continue holding it. Similarly with IWM.
A weekly view of SOXX is more useful, and again, it’s useful to compare the current situation to that of early 2021. No predictions, but drawing a horizontal channel will possibly prove useful.
All positions are well up from their October lows, so selling everything and getting outside to enjoy spring weather makes a lot of sense!
Update to Fri. April 5 : Selling everything on Monday, April 1, turned out to be a great idea! Our spring weather turned to winter with a dump of snow, so I continued to trade, but the focus is now on a horizontal range.
In the update to Fri. March 15, I wrote, "It’s also good to note that QQQ hasn’t moved up much from the first sell on Jan. 24 for +23.9% with TQQQ, yet trading the range gave a compounded return of 100% in 7 trades." I also noted that the NDX and SPX charts were flattening out and drew a horizontal support line for SPX, which was also the line Avi indicated as critical support.
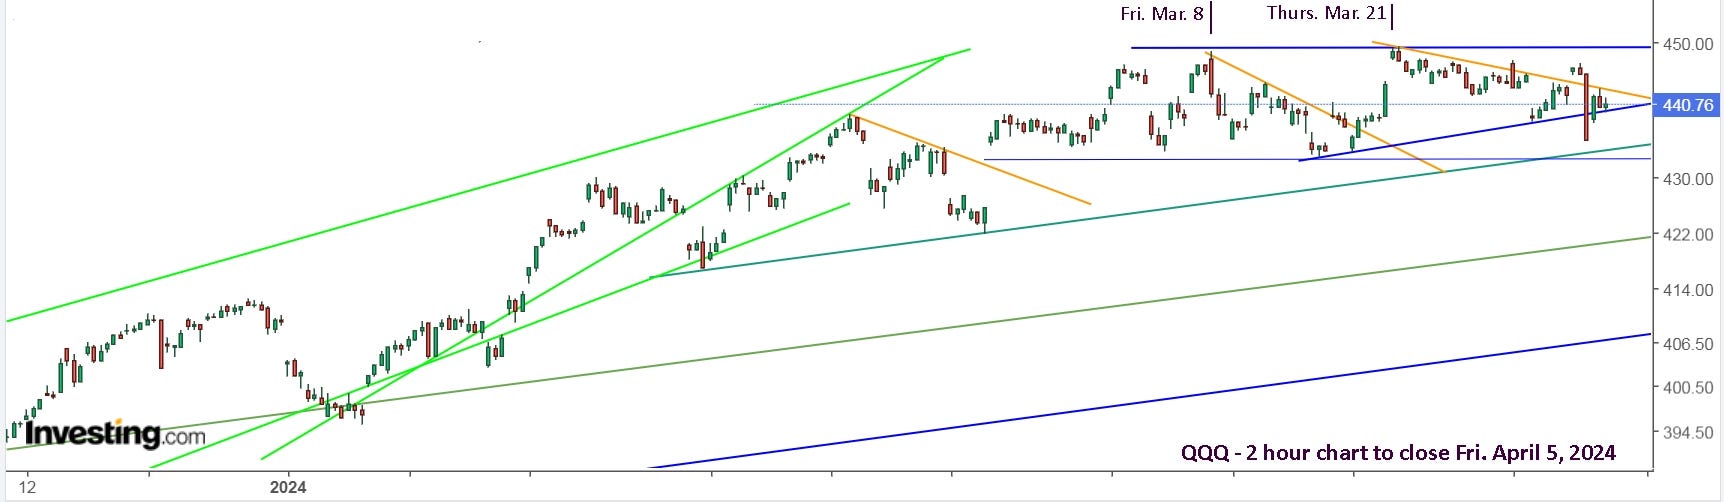
It will now be interesting to see if the sideways trend continues, or if a gentler climb develops. Here’s a look at TQQQ and notice how dramatic the perspective changes when switching from a 2 hour to 1 hour chart.
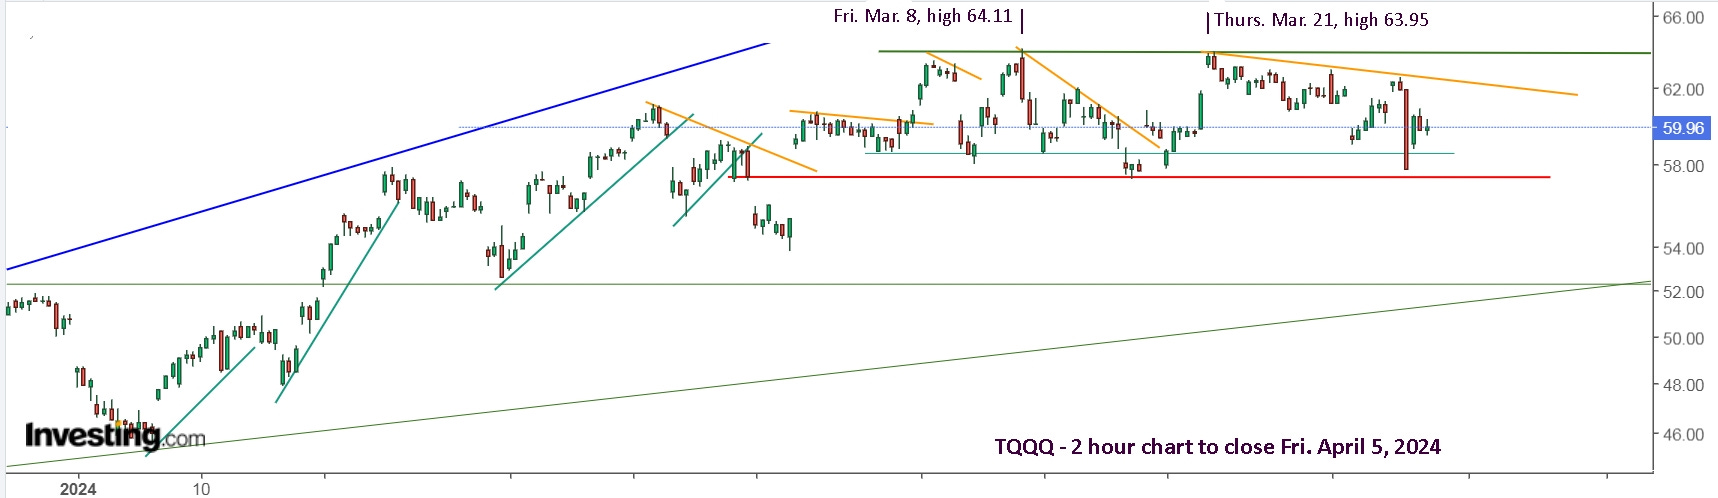
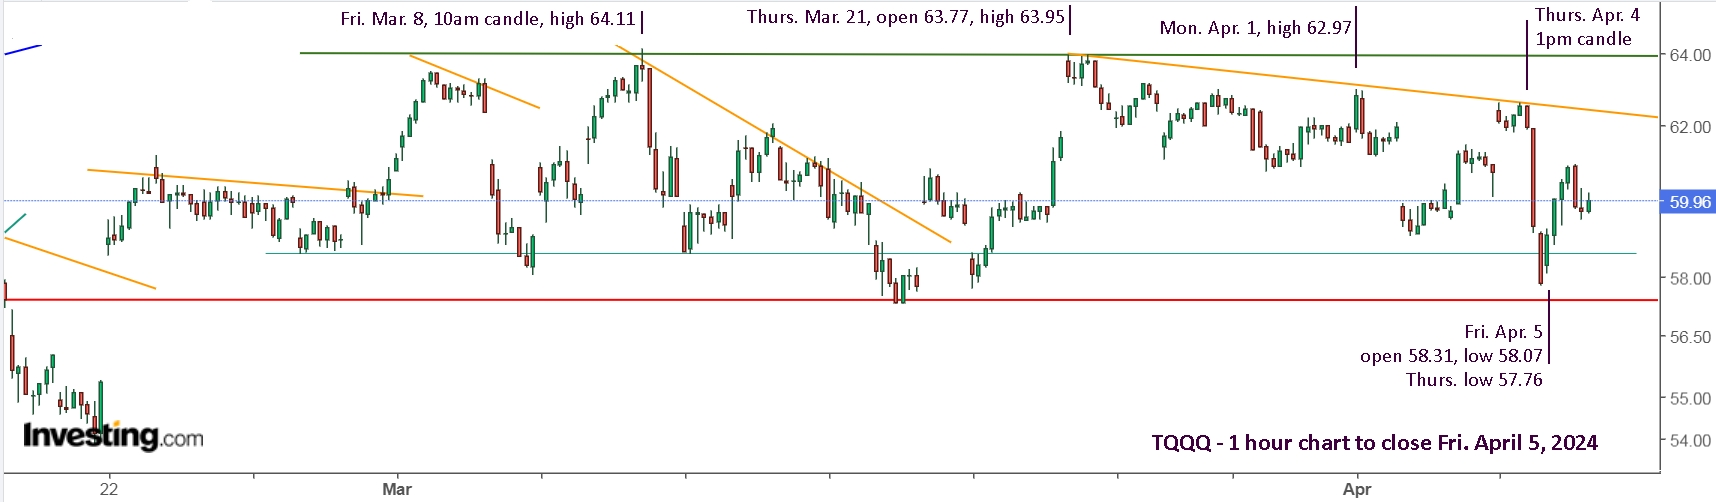
In the 2 hour and daily view, one might be inclined to believe the November to February rally will continue, but it has clearly been sideways for over a month now.
Over the past two weeks, I focused on SOXL, which generally gives bigger return possibilities, but the trades are often more difficult to time, so I'm going to go back to TQQQ for this article. As you can see in the chart below, it didn’t return to the March 8 high, like TQQQ did, then the Monday, April 1 high was higher than March 21, which might have been a breakout.
Back in January, I showed the following QQQ chart, which looks parabolic and likely to make a big drop. When you switch to log scale, it tells a completely different story.
I also wrote that some people, in particular Steven Kaplan, an author on Seeking Alpha, has been calling for a drop since June, 2020. This is from his June 10 article, “Euphoria To Panic To Euphoria”. “It is as important to sell now as it had been at the most extreme stock-market peaks in history including August 1929, January 1973, March 2000, and October 2007. Whenever assets are dangerously overpriced, they are far more vulnerable to above-average percentage losses.” Trusting trendlines, one conservatively went long QQQ or TQQQ in April, 2020. With just 7 trades, $10k turned into $600k with TQQQ.
This past week, he posted another article saying, “Nearly 100% of US equity valuations are at or near all-time record overpricings, while many reliable signals of upcoming market behavior have approached or surpassed all-time record extremes. Investors are ignoring these extremes in the market.” He’s literally been saying the same thing for nearly 4 years!
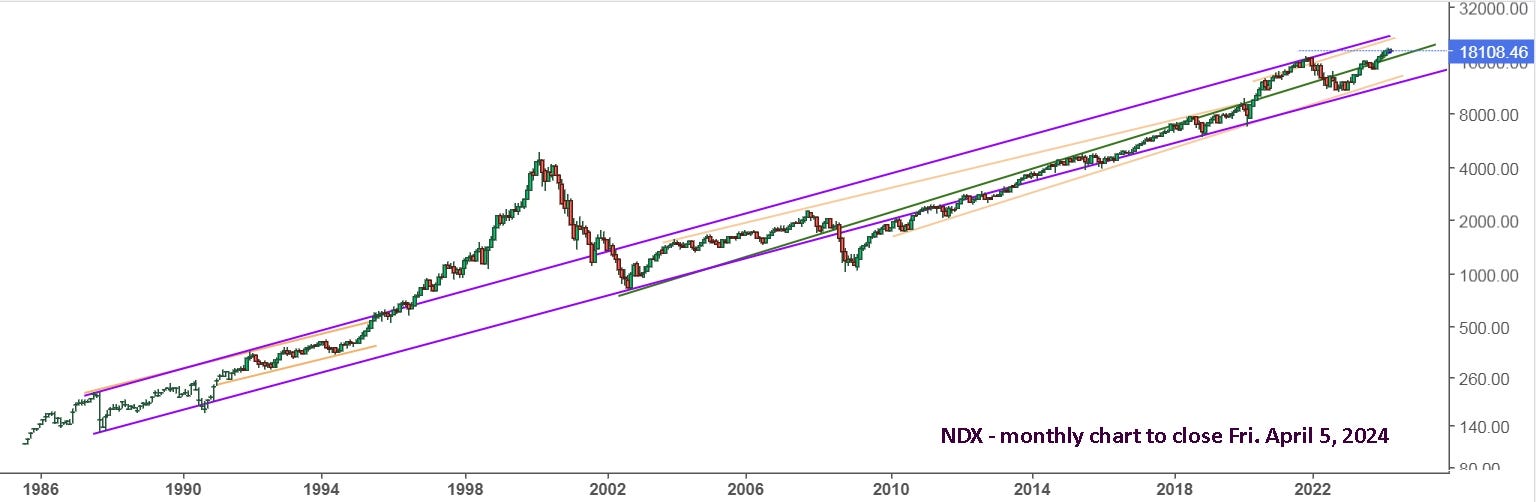
Here’s a look at the Nasdaq back to 1985, with a log scale to maintain perspective. It’s really all you need to see to decide if we are currently in a bubble like in 2000.
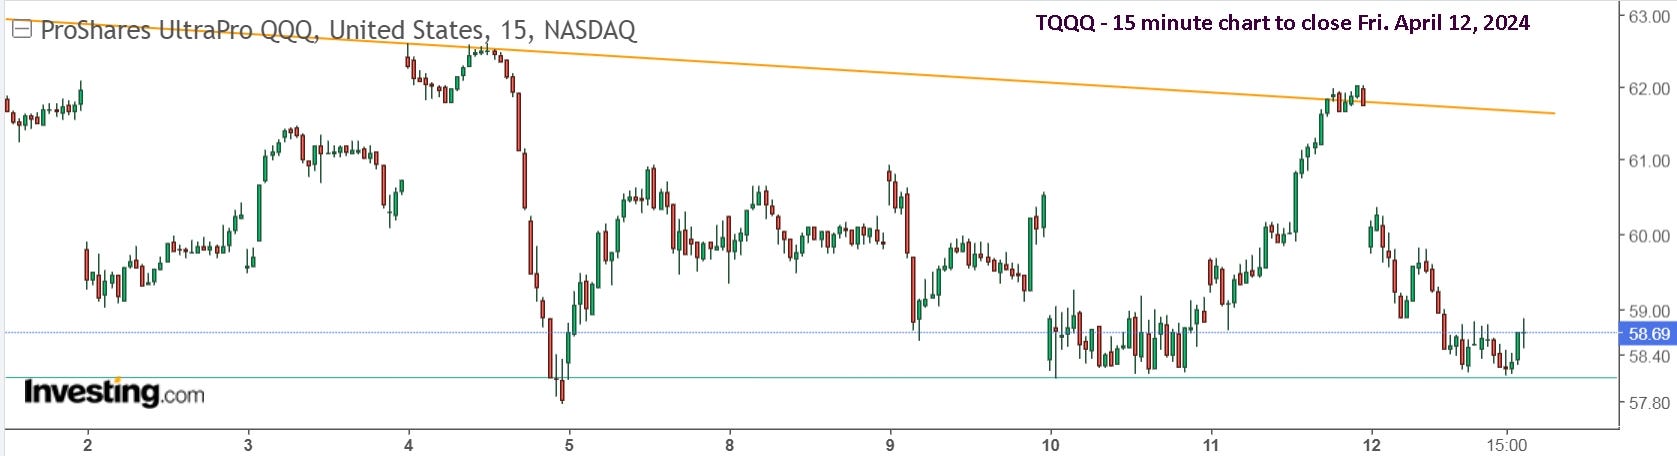
Update to Fri. April 12 : Selling everything on Monday, April 1, still looks good and no trades since then was also fine. There were opportunities elsewhere, including UVXY, but for those simply focused on TQQQ, minimal trades and staying safe. There was nothing to do and that trend looks likely to continue.
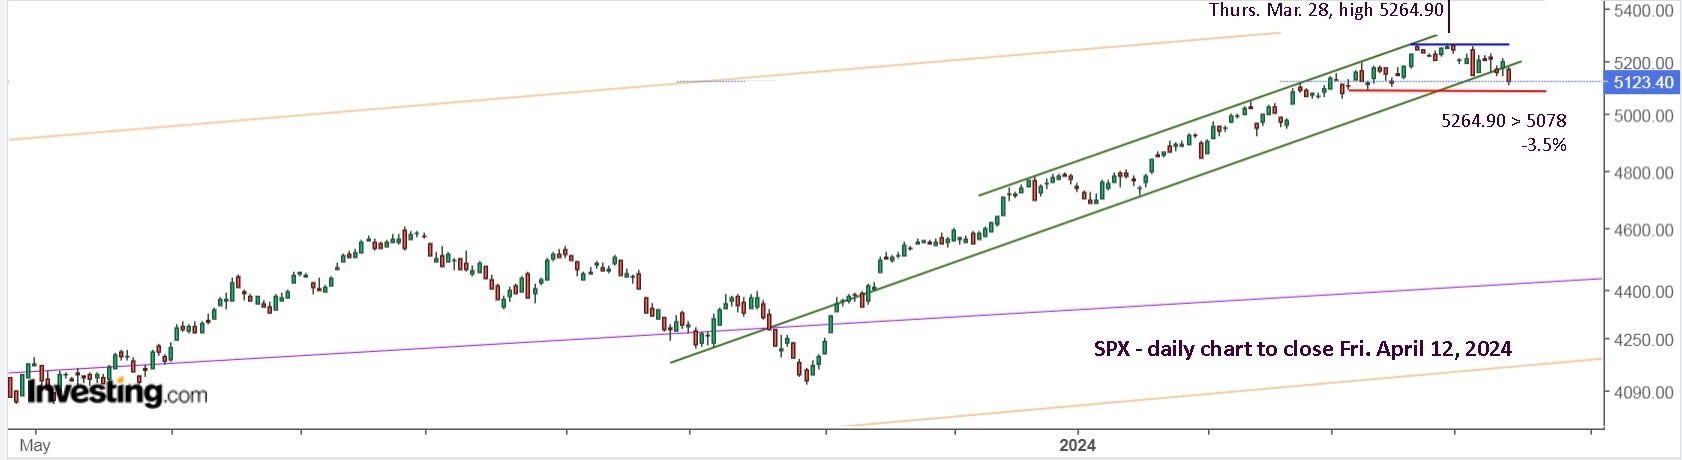
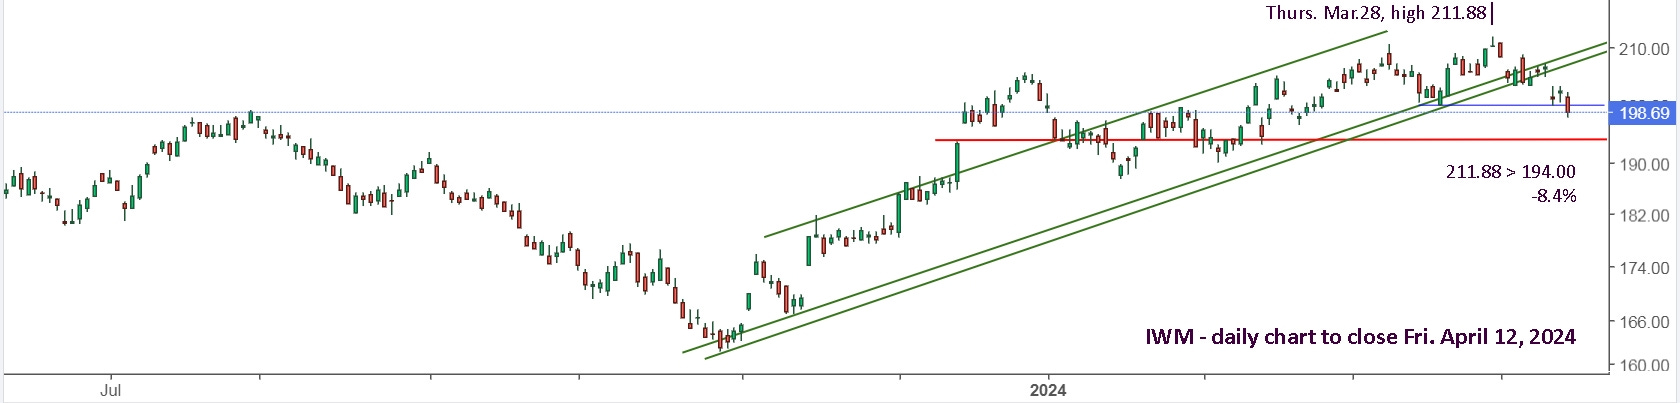
The S&P 500, SPX, held its uptrend the longest and the the Russell 2000, IWM, was the first to indicate a potential horizontal trend after its top in late December. Holding during a sideways market is like leaving something valuable outside to rot in the sun with the risk of getting stolen.
It’s also entirely possible that the markets are waiting for an excuse to drop. Market pundits will then claim the drop was a complete surprise and impossible to avoid, yet you’ve been safely on the sidelines since Mon. April 1, if not earlier.
Here’s an example of why I believe the short term market prices are manipulated.
There was no particular news on April 4, yet the markets were hammered down relentlessly. I don’t believe that can happen on it’s own, just as a herd of sheep, calming munching on grass won’t suddenly run, en masse, over a cliff. A pack of wolves could send them all over the cliff, and a pack of big traders selling non-stop could force the markets down. Why? So they can re-buy cheaper at the end of the day, because they know the drop isn’t going to continue on April 5.
It’s not exactly hard to imagine the same group pushing prices up and up all day April 11, then selling, knowing they will gap the markets lower on Friday. Regardless of whether my theories are true or not, the fact remains that these market actions can significantly impact your investments. Avoiding these ‘traps’ can be financially and emotionally beneficial.
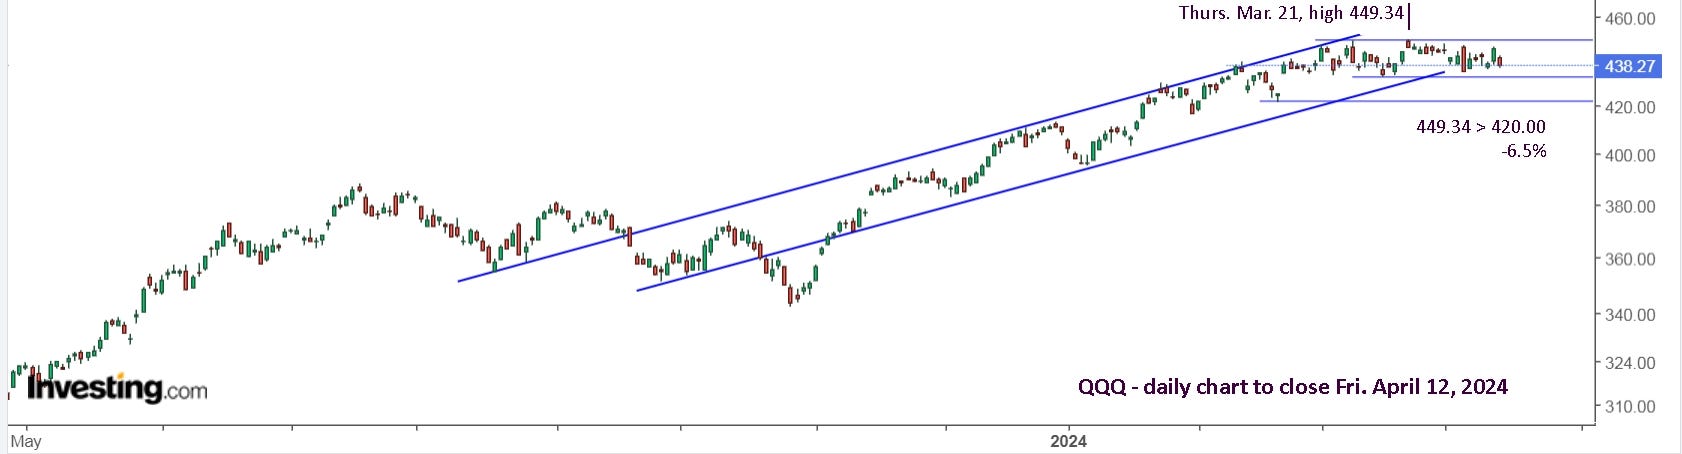
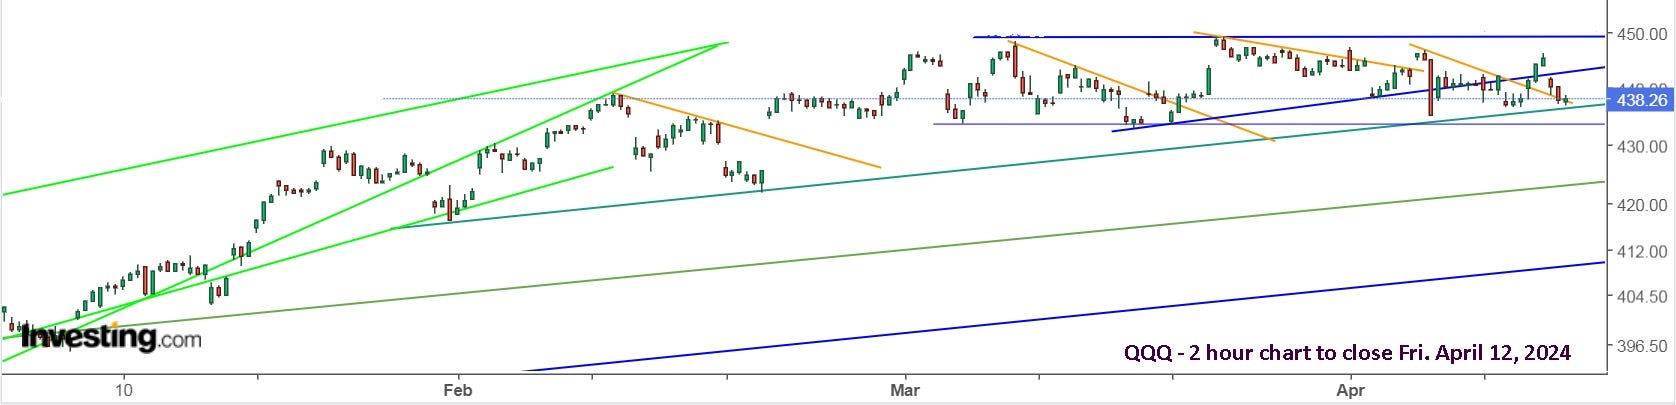
Here’s a 2 hour view of QQQ. It’s at rising support and not far from horizontal support, so TQQQ might be a buy on Monday. If it breaks support, then SQQQ and UVXY could be a good trade.
Here’s a look at UVXY. There was no reason to have bought late on April 1 or 11. Yeah, it’s nice to get the gaps, but Friday could have just as easily gapped lower, taking away your trade gain on the day. Buying at the open was still below or at your sell price Thursday and you added up to 13% on the day.
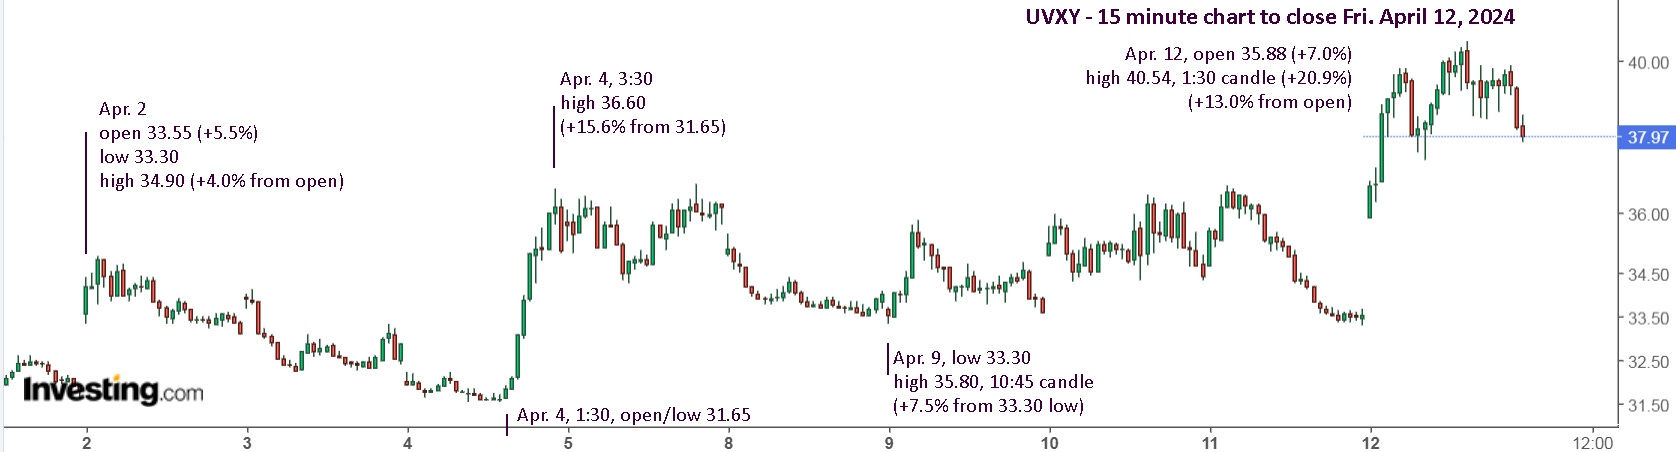
Yeah, it’s tempting to have re-bought Friday in anticipation of the markets gapping lower, but again, don’t guess or predict, simply take action early in the day based on what is actually happening.
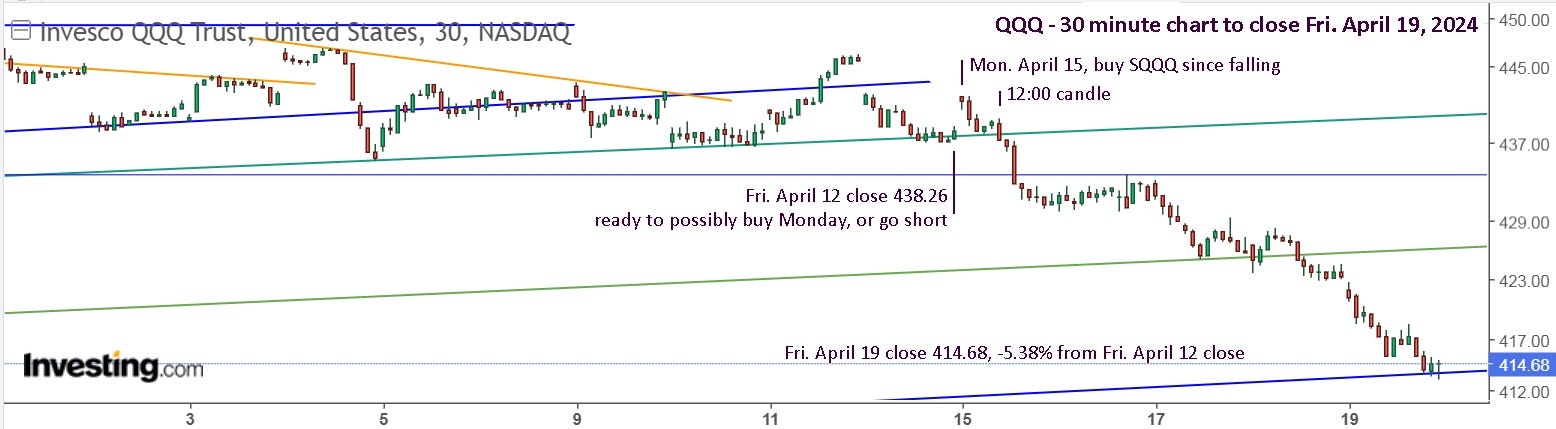
Update to Fri. April 19 : In my March 28 long weekend update, I wrote, "All positions are well up from their October lows, so selling everything and getting outside to enjoy spring weather makes a lot of sense!" In the following week's update, I wrote, "Selling everything on Monday, April 1, turned out to be a great idea!" In last weeks's update, I wrote, "QQQ is at rising support and not far from horizontal support, so TQQQ might be a buy on Monday. If it breaks support, then SQQQ and UVXY could be a good trade." My suggestion to not have re-bought UVXY Friday was also spot on.
I’m not pointing these things out to brag, since it’s simply what you could and should have concluded on your own. I’m really congratulating all of us for following the system of trendlines which provided terrific gains since the markets turned up the end of October, 2023 and had us safely out in March. Here’s another look at last week’s QQQ chart, at potential support, which will either hold or break.

It gapped higher on Monday and you’re ready to go either long or short. It drops hard in the first 5 minutes and you perhaps went short. Then it recovers over the next 20 minutes, but doesn’t make a new high. That’s a perfect setup to buy SQQQ with a tight stop sell and stop buy for QQQ or TQQQ if they push up to a new high.
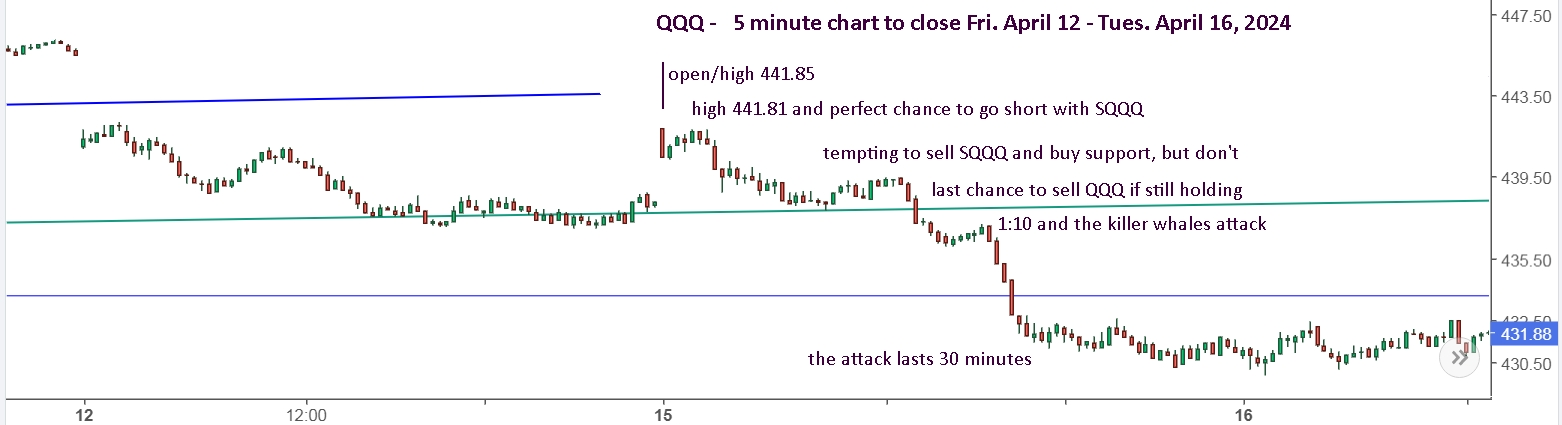
When it holds support, you might be tempted to sell SQQQ for a quick gain and buy TQQQ, but don’t. That’s the fake and you’re trying to make as few trades as possible. Leave your stop sell at break even, add a slightly lower alert and carry on with your day. At 12:10, there was a 30 minute attack on the price, which broke the support trendline. That held and it tried to rally, then at 1:10, there was a second 30 minute attack on the price, which should have killed all remaining bullish notions. I should add that this is not a general change in sentiment amongst all the ‘sheep’, and it wasn’t the ‘sheep’ who caused the day to start up sharply from Friday. That was just a final move to get a few more bulls to put their necks on the chopping block.
Here’s the change this week.
In what world is that a natural occurrence? Tuesday was relatively flat, which probably lured some more bulls in for slaughter. It certainly had me guessing. At 12:30 on Wednesday, it hit the support trendline, held and pushed up at 1pm. More bulls dragged in to the slaughterhouse. At 2:40, it shoots higher, for just 5 minutes, and the most careful bulls are caught as it reverses hard the next 10 minutes and continues lower. This is like shooting buffalo or running them off a cliff. Here’s a closer look.
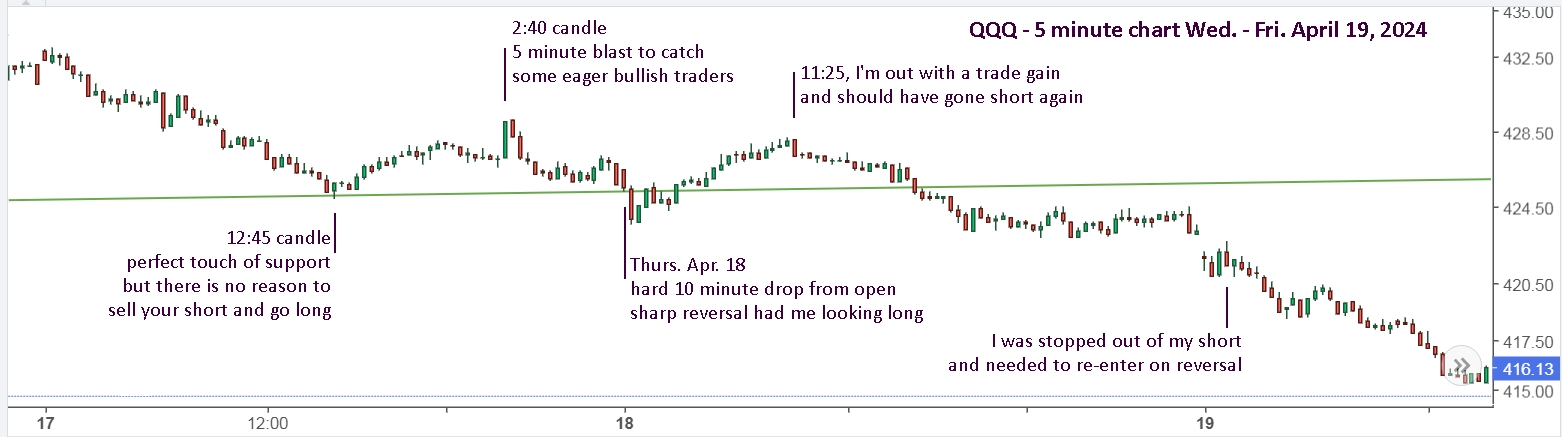
When zoomed in, it no longer looks like a cliff, which is why you need to check various time frames, in order to get a clear view of what’s happening. In their weekly update, Zacks writes, “YTD, at their highest close just a few weeks ago, the Dow was up 5.62%, the S&P was up 10.2%, and the Nasdaq was up 9.53%. Since then, profit taking has seen the indexes pull back from their recent highs with the Dow off by -4.57%, the S&P off by -5.46%, and the Nasdaq off by -7.06%.” Profit taking is often their reason for market drops, and in a way it might be true. I prefer to call it the wolves taking their pound of flesh from the sheep. They then add, “But that's good news, because pullbacks like these are very common and healthy.” Yeah, losing 5-7% of my money in a week or two is ‘healthy’! Thank goodness we avoided the entire drop and enjoyed the spring weather!
They then write, “Pauses like these help refresh and strengthen the market before their next leg up.”, which I would agree with. “While pullbacks and corrections are never fun when they're happening, if you know these are commonplace moves, you can instead look at them as opportunities to buy rather than places to sell.” Again, true, and especially when all your money was safely in your pocket before the drop.
“Currently the Dow is up 0.79% this year, while the S&P is up 4.14%, and the Nasdaq is up 1.80%. And I'm expecting the gains to continue throughout the rest of the year.” In a matter of weeks, the S&P 500 and the Nasdaq gave up over half their gains made for the year. When is it healthy to give up half your hard earned profit in a few weeks?
They then add, “History shows in the previous 14 times when the S&P has gone at least a full year without a new high, and then finally made one – a year later it was higher in 13 out of those 14 times, and up nearly 15% on average.” Those are good odds, but I’m still happy to be on the sidelines prior to this ‘healthy’ drop.
The key for the trendline method presented here is that it doesn’t attempt to predict where the market is headed. The rumble strips on the highway don’t indicate where the road is going, but they do let you know when you’re headed for the ditch.
Whether you’re in the ditch now or enjoying yourself at a roadside rest stop, we need a plan for next week.
For QQQ, I set an alert for 420 and 400 and will look at things when I get an alert. For SOXX, to avoid whiplash, alerts at 208 and 180 would allow you to get out and enjoy the spring weather.
The S&P 500 also went over the cliff last week, which is understandable, since over 27% of the index is made up of the “Magnificent Seven”. Microsoft (MSFT) 7.3%, Apple (AAPL) 5.8%, Nvidia (NVDA) 5.1%, Alphabet (GOOGL) 4.0%, Amazon (AMZN) 3.9%, Meta (META) 2.6% and Tesla (TSLA) 1.0%.
Tesla is in the ditch with all the other EV stocks, so a look at the “Bloated Five”, which make up 26.1% of the index, might provide some insight. Here they are:
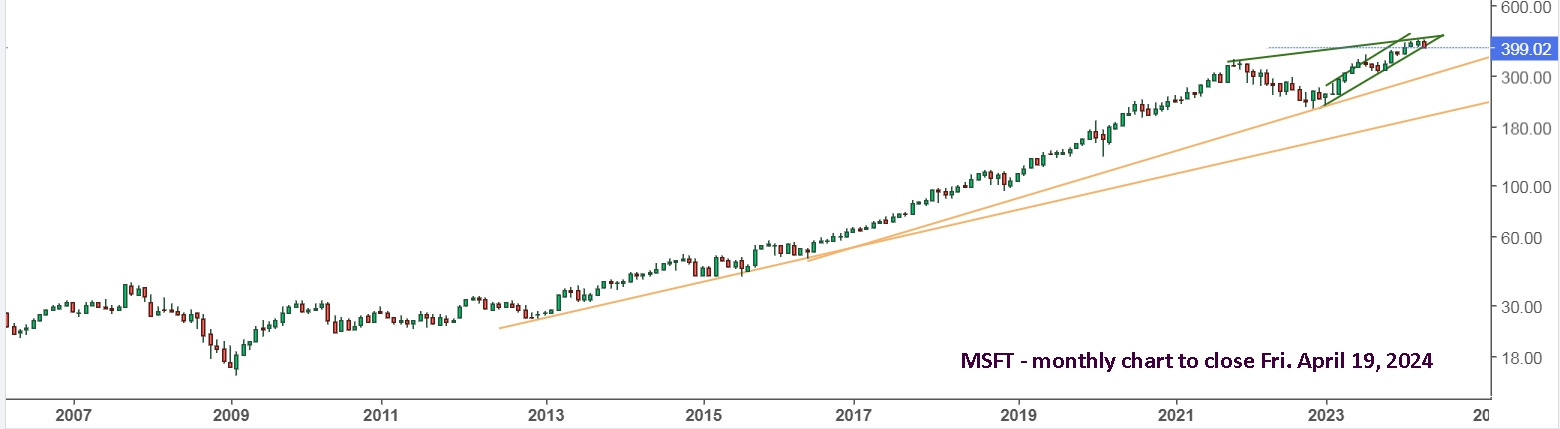
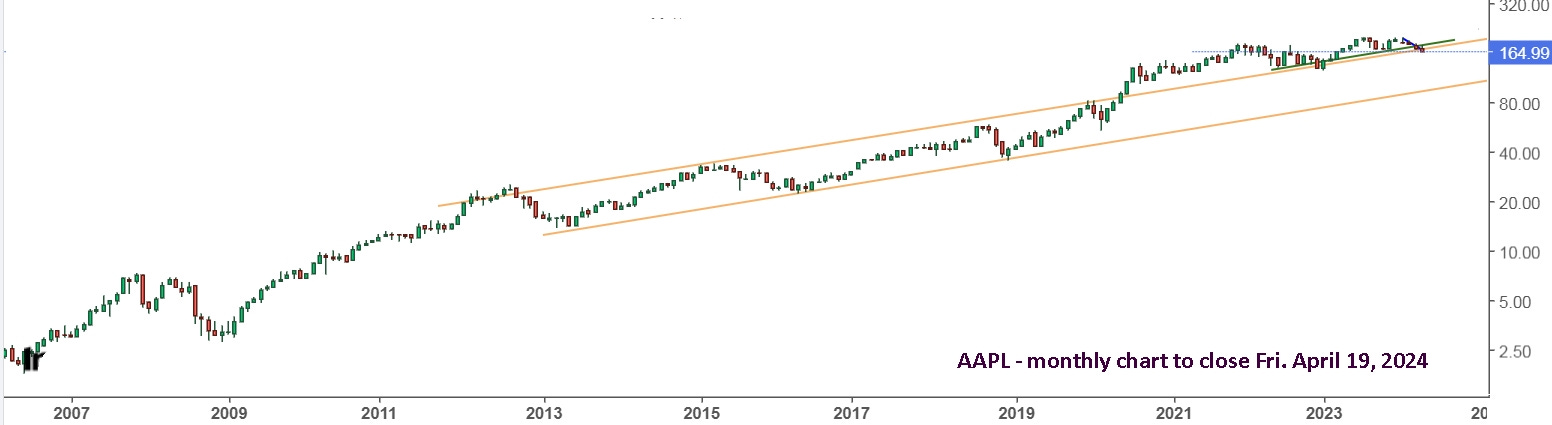
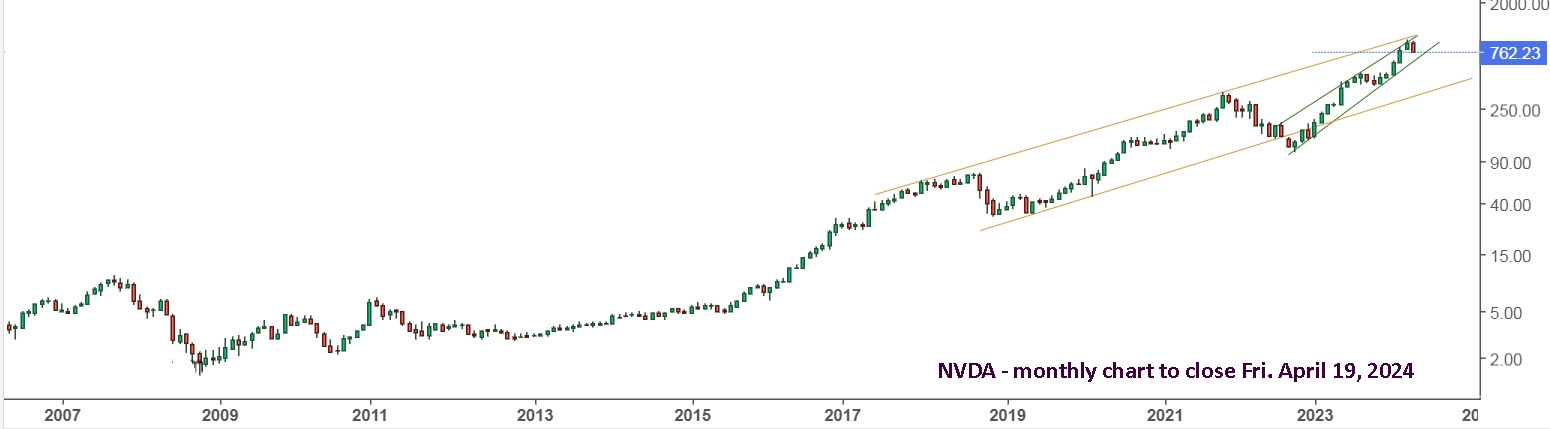
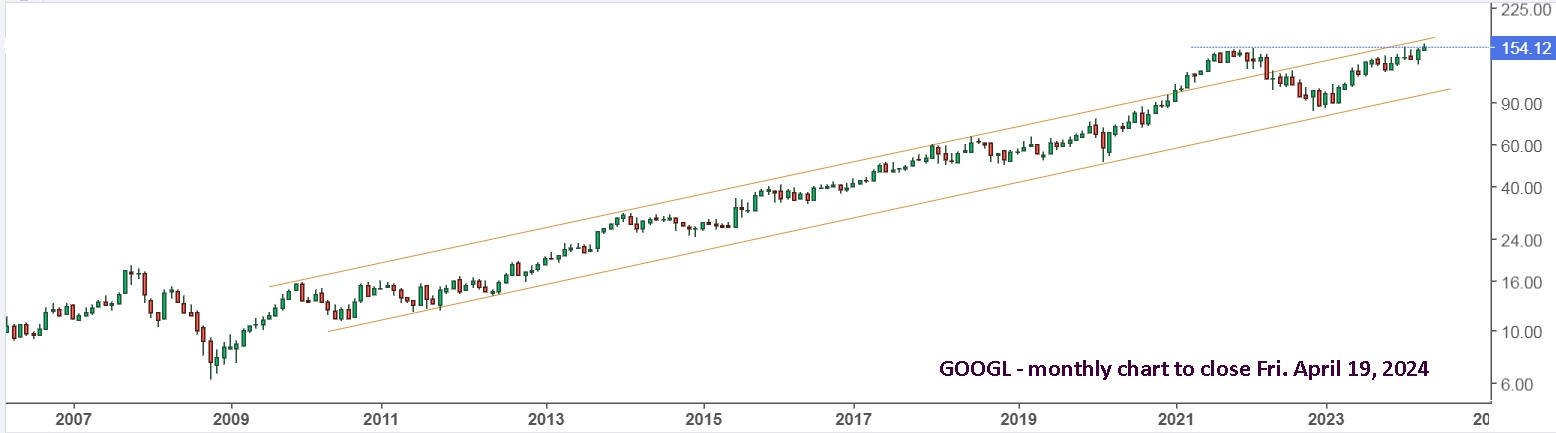
I don’t know about you, but I’d be selling all those fat cats before they join TSLA in the ditch.
Update to Tues. April 22 : On the weekend, I suggested taking the week off and enjoying the weather. I always like to watch Monday’s early, especially when the price action the previous week seems suspicious. Last week’s drop really seemed irrational to me. For Monday, I was ready to go short or long. As it turns out, it was a great opportunity to buy TQQQ or SOXL.
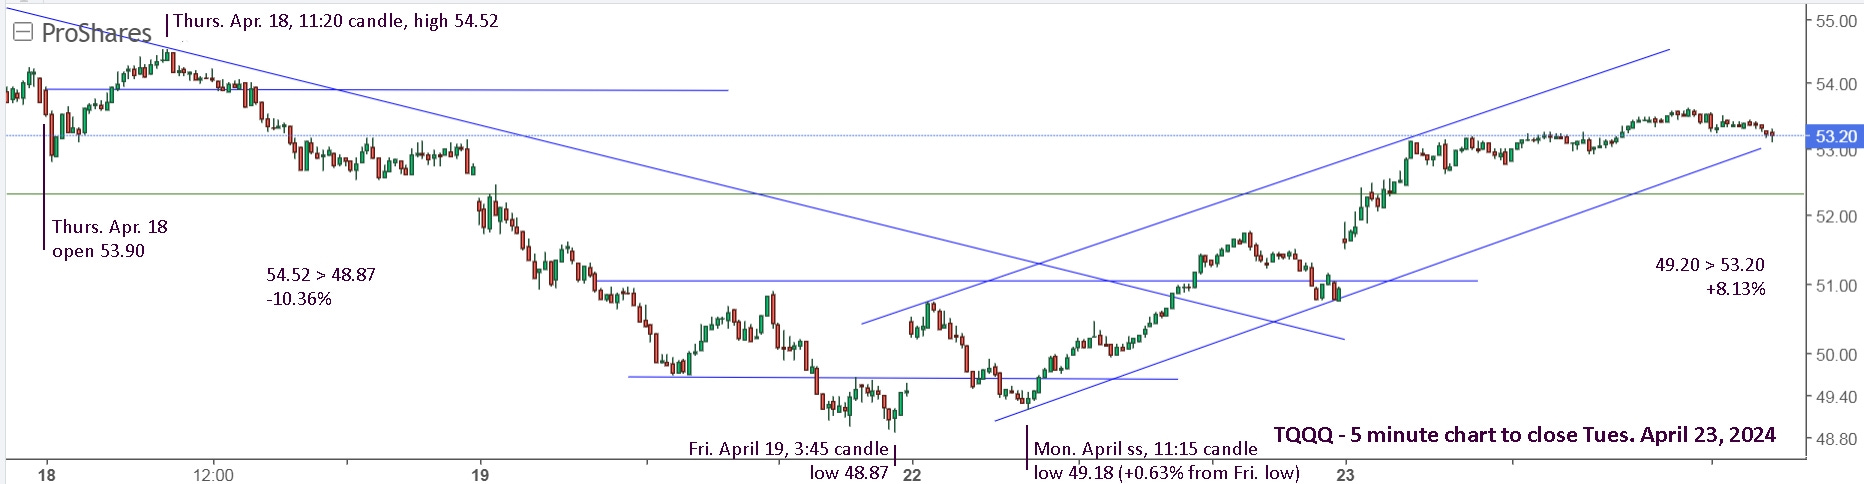
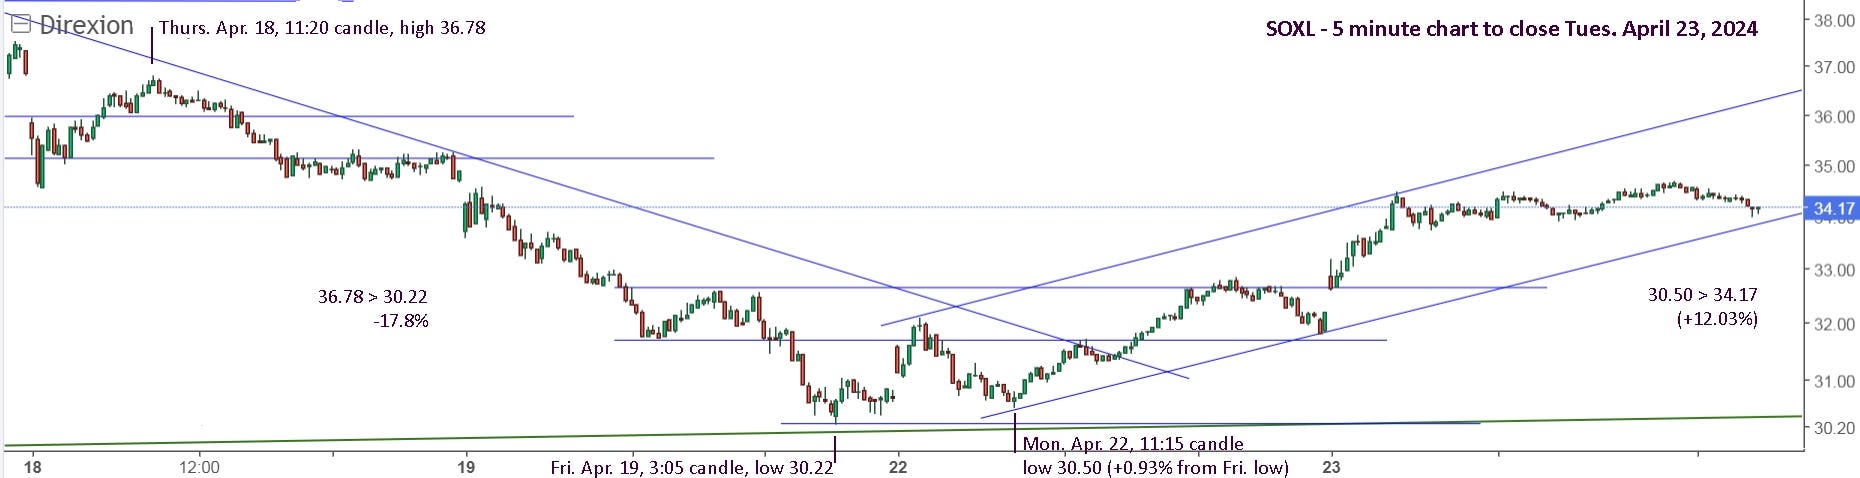
The gap up had me watching for a drop or rally, the reversal and push above the early high, stopped me into TQQQ. As it stalled, I raised my stop sell to breakeven and bought SQQQ with a tight stop. That way, a push higher would stop me out of SQQQ and I’d be long TQQQ with a good price. As you can see, it fell, so I was stopped out of TQQQ. For me, if it held above Friday’s low, I was planning to buy with a tight stop, just below Friday’s low, a mere 0.63% when it spiked lower at 11:15 and reversed. That was my green light to buy TQQQ, having already sold SQQQ for a gain. When the price sagged at noon, there was a good chance it would fall like it did on Friday. When it held and started a steady climb, that’s when I bought a bit more for a trade on the day. Tuesday opened higher, held and pushed up, so buy more. At the close, your low buy is up 8% and you locked in some trade wins. There’s also a new rising channel to follow. Here’s a look at SOXL. Enjoy the rest of your week!
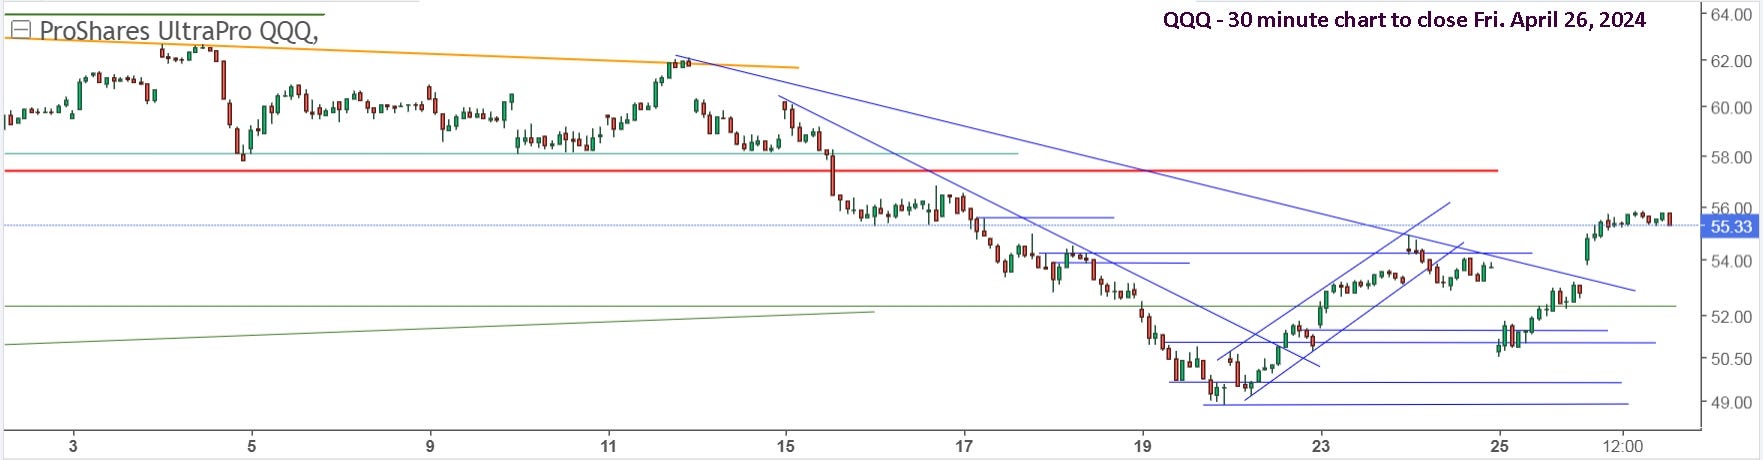
Update to Fri. April 26 : The markets gapped up on Wednesday, based on bad earnings from Tesla, but positive guidance. As per the strategy, watch for an early move. It’s best to put in a stop sell early, loose enough to avoid being triggered on a brief spike lower, so at least 1% below the open price. Once it pushes up, I generally set a stop a bit below the early low.
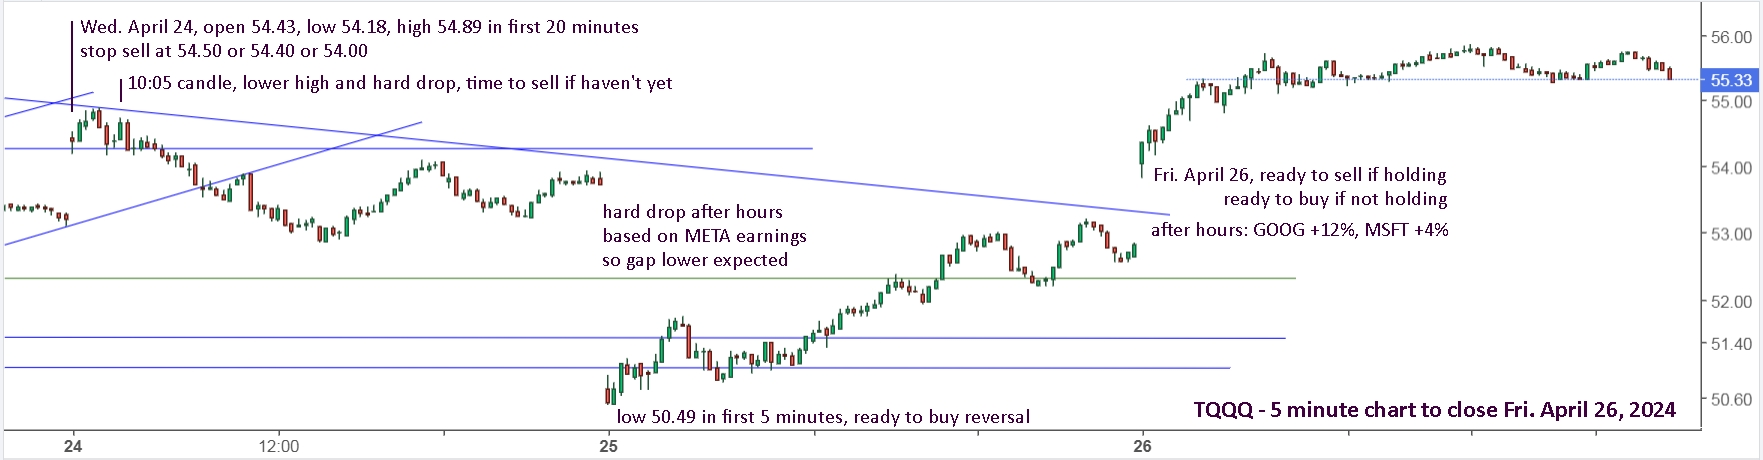
TQQQ reversed hard from a high of 54.89 in the first 20 minutes and hit 54.16 in less than 10 minutes, 2 cents below the early low. One could have set a stop at 54.50 or 54.40, just below the open price of 54.43, or at 54.00, or even 53.80 (-1.16% from open). As it held a floor, there’s really no reason to keep holding and hope for a rally. Simply sell, get to safety, put in an alert at 54.50 and a stop buy at 55.00 and carry on with your day. You could also put in a stop buy for SQQQ, or buy it with a tight stop sell.
I suspect most people were surprised by impact META (Facebook) had on the markets. They reported after hours on Wednesday, which immediately sent TQQQ down. Unfortunately, most platforms don’t allow stop orders after hours. Given the new downtrend line, there was no reason to have re-bought TQQQ anyway. When it gapped lower on Thursday, it made sense to be ready to buy. Was META really going to bring down the entire stock market? And were the earnings really that bad? “Q1 GAAP EPS of $4.71 beats by $0.39. Revenue of $36.46B (+27.3% Y/Y) beats by $240M.” Apparently, “Meta tumbles in wake of light revenue forecast”.
Just before 2pm on Thursday, TQQQ was back to its lows from Wednesday. It’s really best to expect nonsense moves in the market and profit from them. The gap higher on Tesla’s bad earnings “revenue fell 8.5% year-over-year in Q1 to $21.30B. The revenue tally missed the consensus estimate of $22.26B. EPS came in at $0.45 vs. $0.50 consensus and $0.85 year ago. The EPS tally from the electric vehicle maker was the lowest in ten quarters. Operating margin was reported at 5.5% of sales, to fall dramatically from last quarter's mark of 8.2%.”, but “Tesla rallies after pointing to its upcoming affordable models, autonomous upside”. It’s absolutely ridiculous!
After hours on Thursday, “Alphabet stock surged by double digits -- (NASDAQ:GOOG) +12%, (NASDAQ:GOOGL) +12% -- after its first-quarter earnings easily cleared analyst expectations as revenues jumped 15% with strong performance particularly at YouTube, and the tech giant launched its first dividend.” And “Microsoft (NASDAQ:MSFT) shares rose around 4% in extended hours as the tech giant reported fiscal third-quarter results that topped expectations.” At least they moved the market in a direction that made sense.
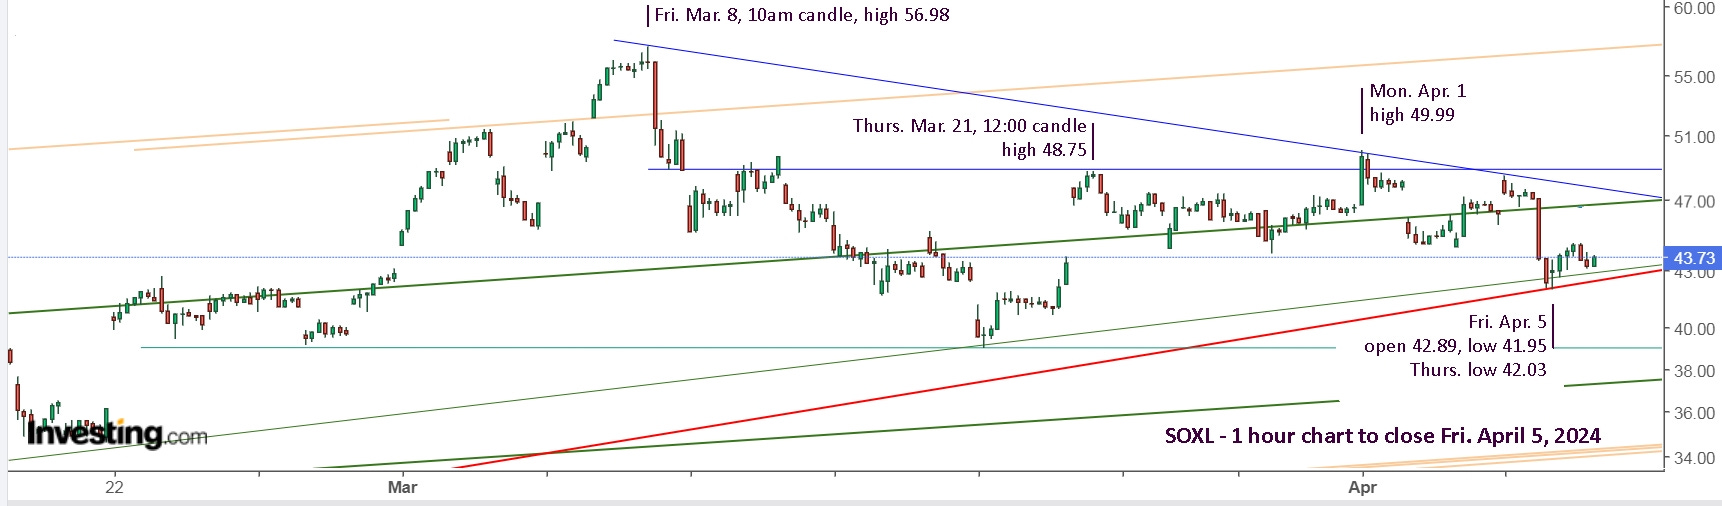
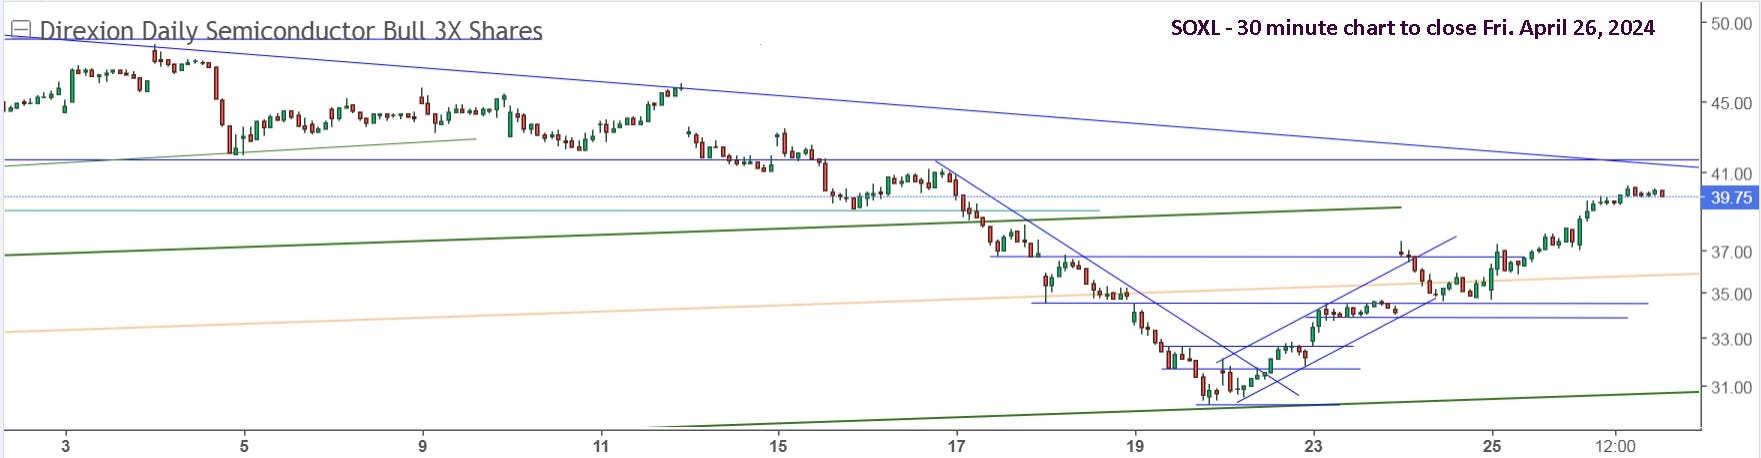
Where will the markets go next? I have absolutely no idea. All I know is that the ridiculous moves will continue, and the strategy of using trendlines and watching to buy early in the day will help you profit from it. My choice was to sell on Friday. Here’s a look at SOXL. Note, it gapped up much higher on Wednesday and was only down slightly at the open on Thursday. It also offered 29% from 31.00 to 40.00, without taking the obvious extra sell on Wednesday and re-buy Thursday.
I would also like to add that, like watching a sport on TV, it’s not easy to actually make the great play in the game and under pressure, even if you’re an elite athlete. It ‘should’ have been easy to get that great return last week, but even elite athletes sometimes miss an empty net and drop an easy catch. The key is to not miss twice in a row. You should now be ready and waiting for whatever happens next week.
Update to Fri. May 3 : Another wacky week with FOMC on Wednesday. If you were still long from Fri. April 26, Monday was the day to sell and take the win. Wednesday was a chance to buy again ahead of the FOMC. The algos were particularly crazy after that, but easy enough to sell for the quick win. Thursday morning was a chance to buy the reversal, which I didn’t take, and I would have sold on Friday taking the win.
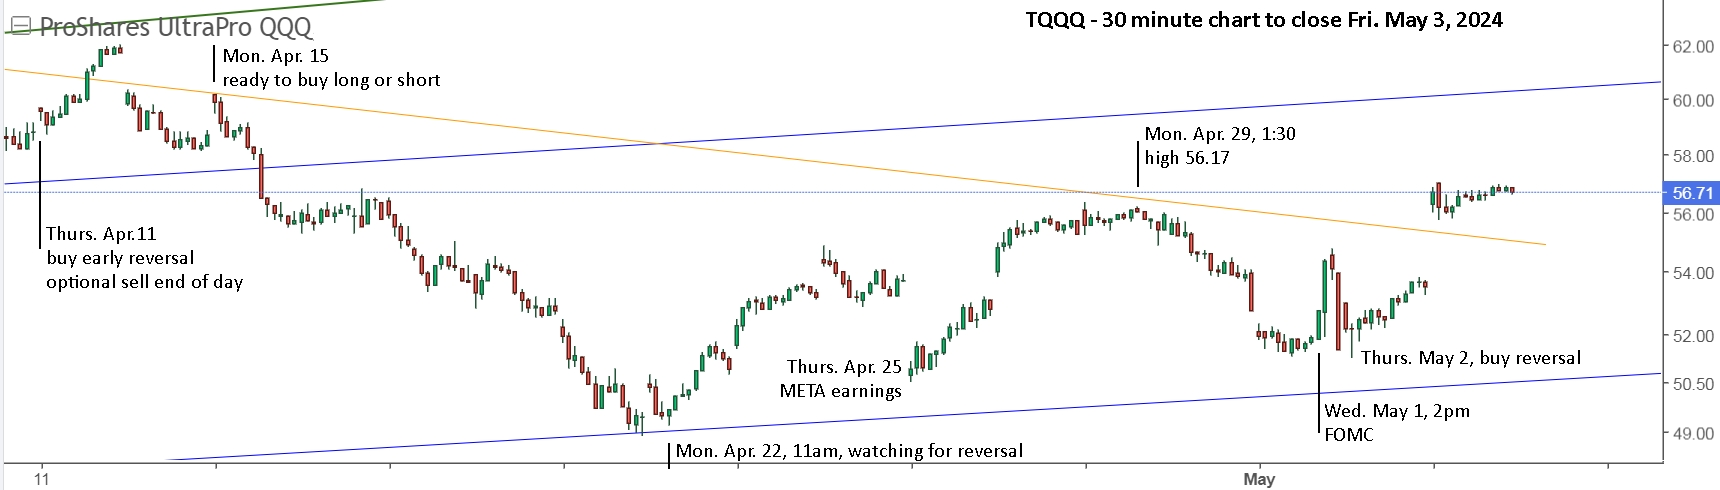
The reversal Thursday was tricky to get, since it dropped hard at 10am for 10 minutes, then reversed. I was holding SOXS and sold it perfectly, but immediately switching to buy the long version is never easy. A stop buy would have had me in. Here’s a look at the daily chart.
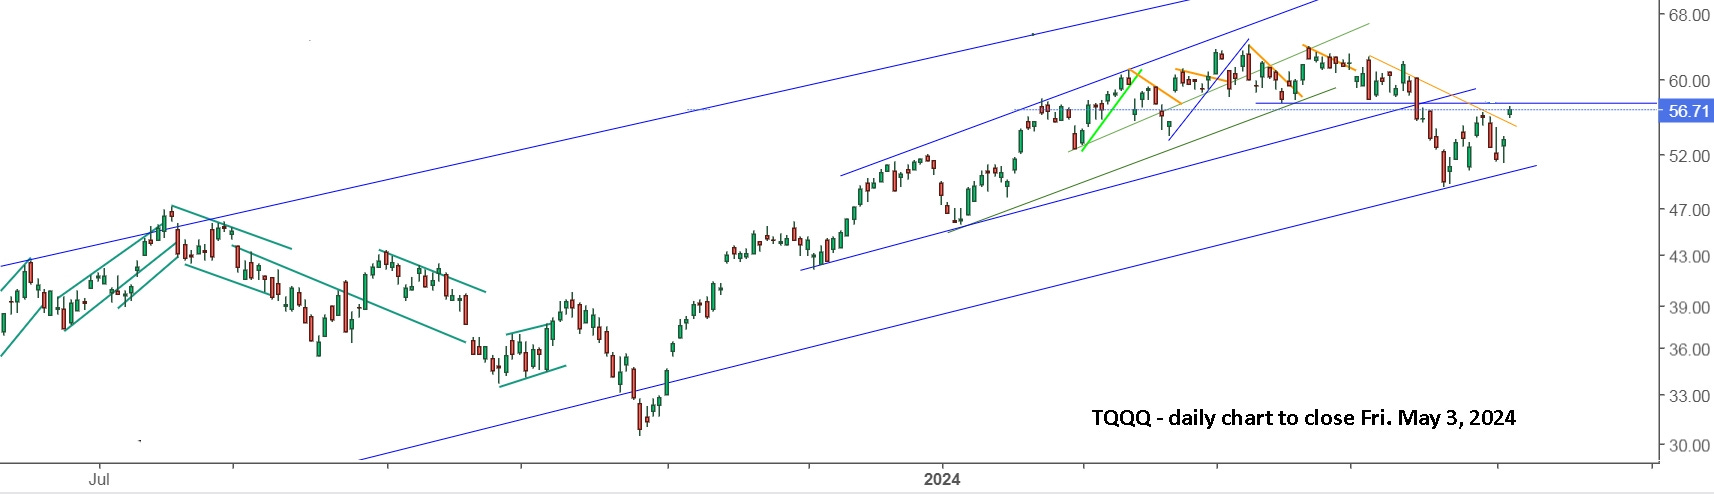
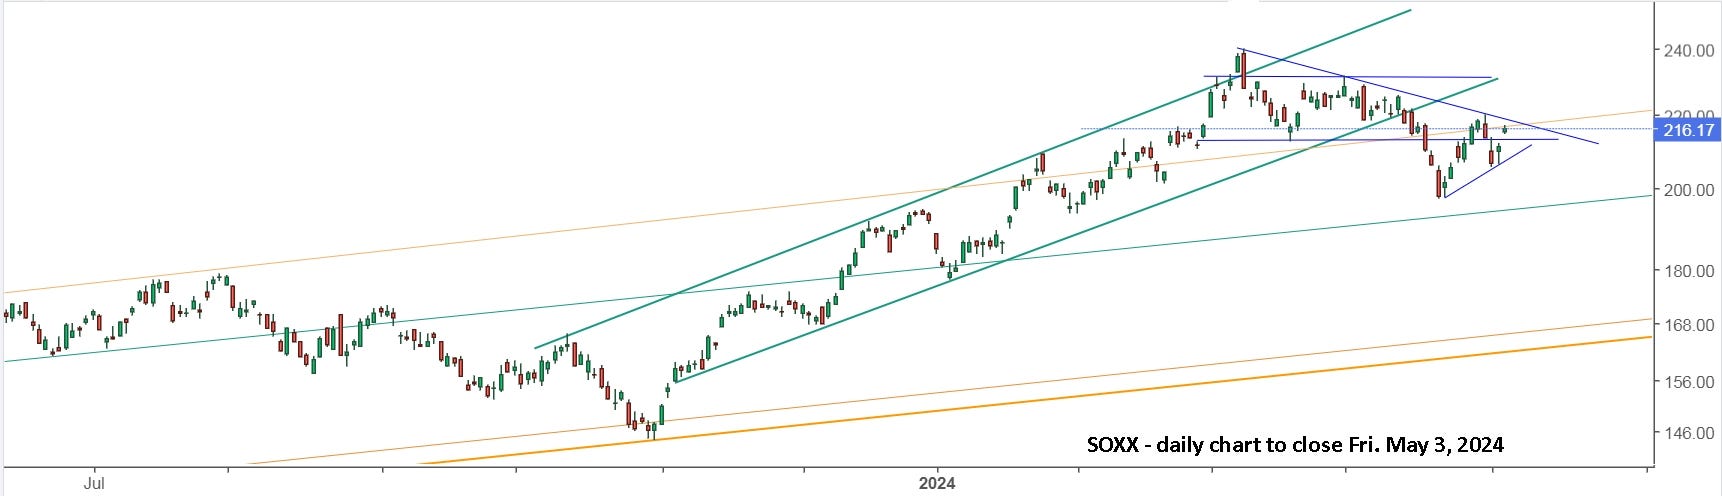
I don’t trust the move on Friday to be a break of the downtrend. One could easily draw a new downtrend line through the Friday high. If it pushes above the horizontal resistance and then holds as support, then I will be inclined to look long.
SPX and SOXX didn’t break my downtrend resistance lines.
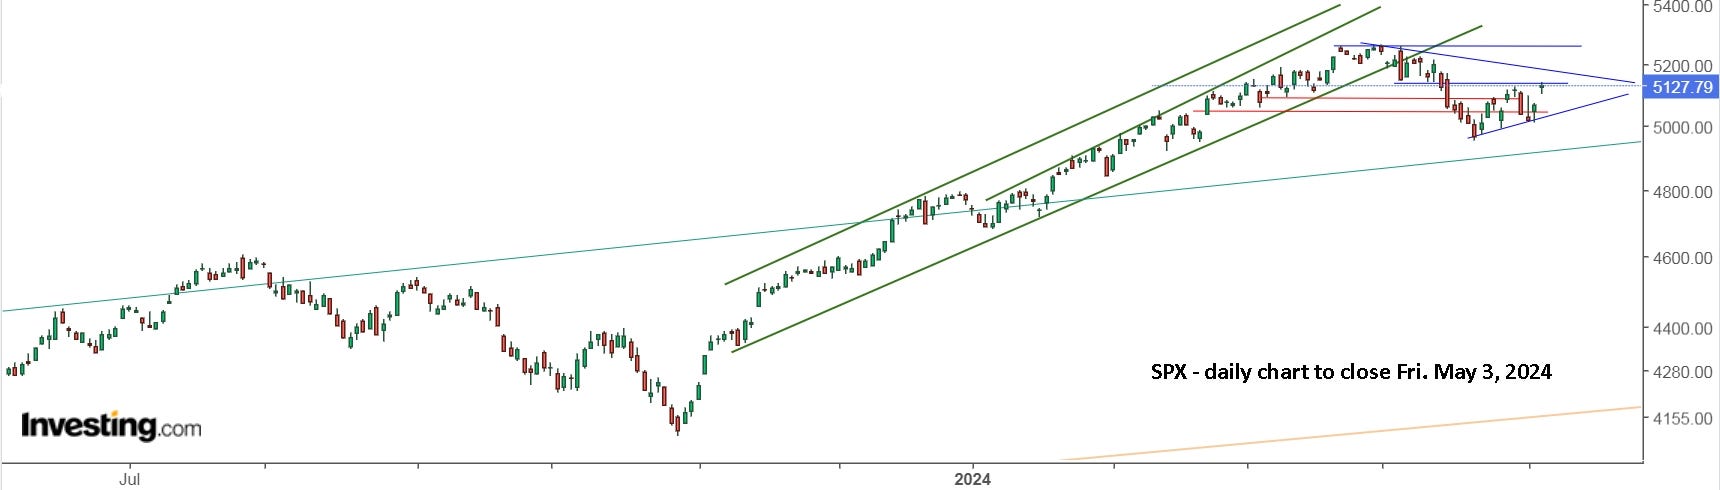
When nothing is clear, it’s best to watch safely from the sidelines. There’s a very real chance that the highs for the year have been put in, so be careful. On the other hand, it’s also wise to take a swing at opportunities to go long, like Thursday morning. It’s just a buy and a stop sell to get you into the opportunity.
On the bullish side, here’s a useful comment from LTTFTrader, “Yes, someday it will all come crashing down. However, one thing worth noting, I think, is that the peaks before the biggest historical downturns (1929, 1973, 2000) and virtually all other bear markets, have been preceded by months-long periods of bearish cumulative breadth divergence from SPX price -- most recently in late 2021. In spite of the current outperformance by the Mag Seven, cumulative breadth is still quite strong, close to an all time high, nowhere near divergence. So, I think that final peak is still quite a ways off.” Here’s a link with some information on market breadth and LTTFTrader’s 2019 article and current comments.
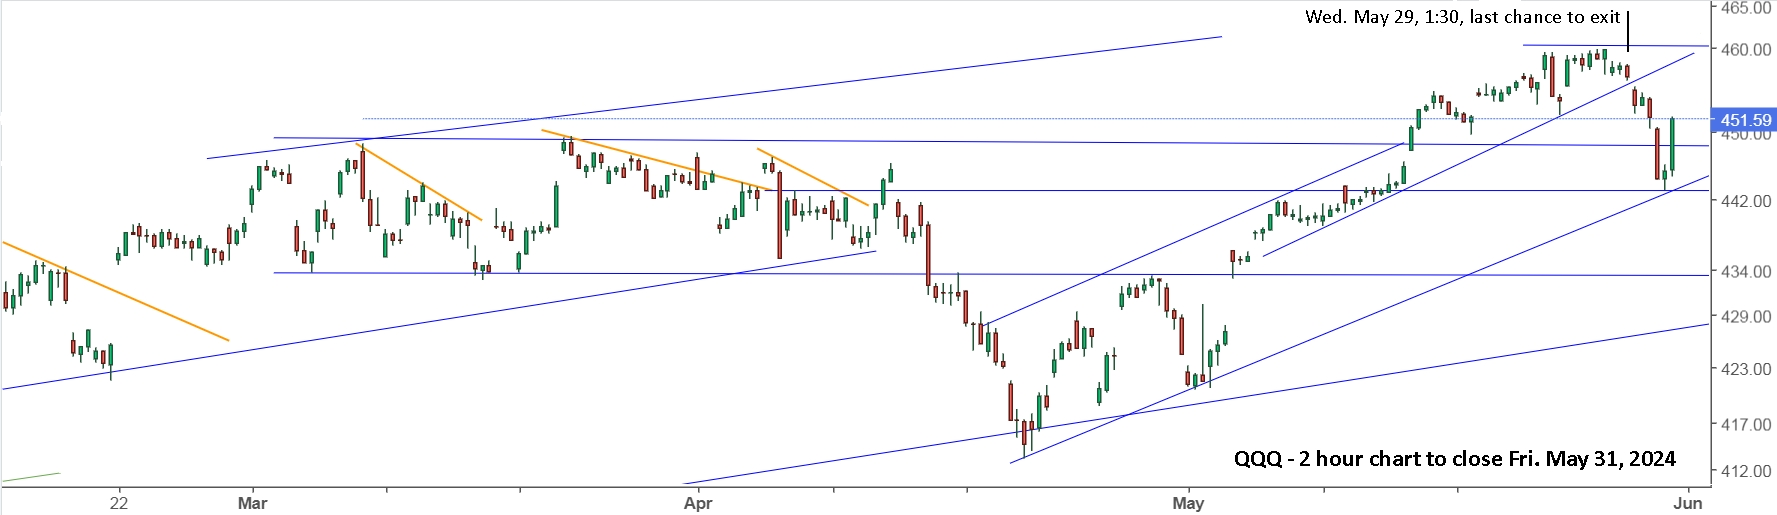
Update to Fri. May 31 : May turned out to be a good month and Monday, May 6 was a good day to get long after the suspicious gap up move on Friday, May 3. You also had until Wednesday to get on the bus. Once it held a new rising trendline, you could sit back and enjoy the ride. Once it pushed to a new all time high, the old resistance line became support. Once it topped out late in May, it was time to get off the bus.
If you were holding TQQQ (or SOXL), it was even more important to get out while the gettin’ was good.
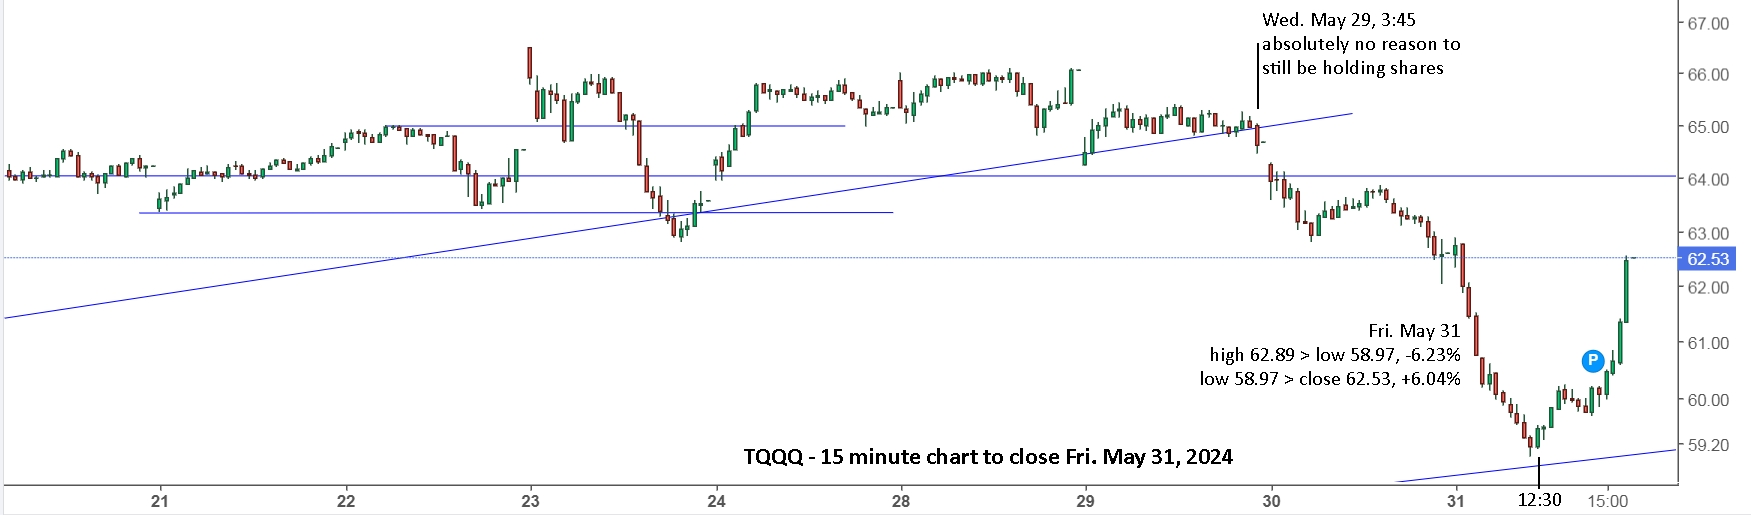
Friday was a particularly strange day. The afternoon drop on Thursday, actually continued after hours and during the pre-market on Friday. After the 8:30 report, everything jumped bullish, then opened up slightly and pushed higher. It was a perfect example of the need to be ready for the ‘wind’ to reverse directions. When the markets dropped, 15 minutes after the open, you needed to be stopped out of TQQQ (or SOXL) and into SQQQ (or SOXS and UVXY). Once you’ve switched directions, set new stops and enjoy the ride.
SOXL was particularly crazy, dropping 12.50% from the high, 50.72 to the low, 44.38, then up 9.49% to close 48.59. TQQQ dropped 6.2%, then rallied 6.0% to close essentially even on the day. I don’t care what anybody says, such moves are not ‘normal’ or ‘natural’, and it wasn’t a massive ‘change in sentiment’ that caused it. It was clearly some ‘elephants’ rocking the boat. I have no idea which way they’re going to push it next week. My main thought is to simply play it safe. There’s a lot more downside risk than upside potential.
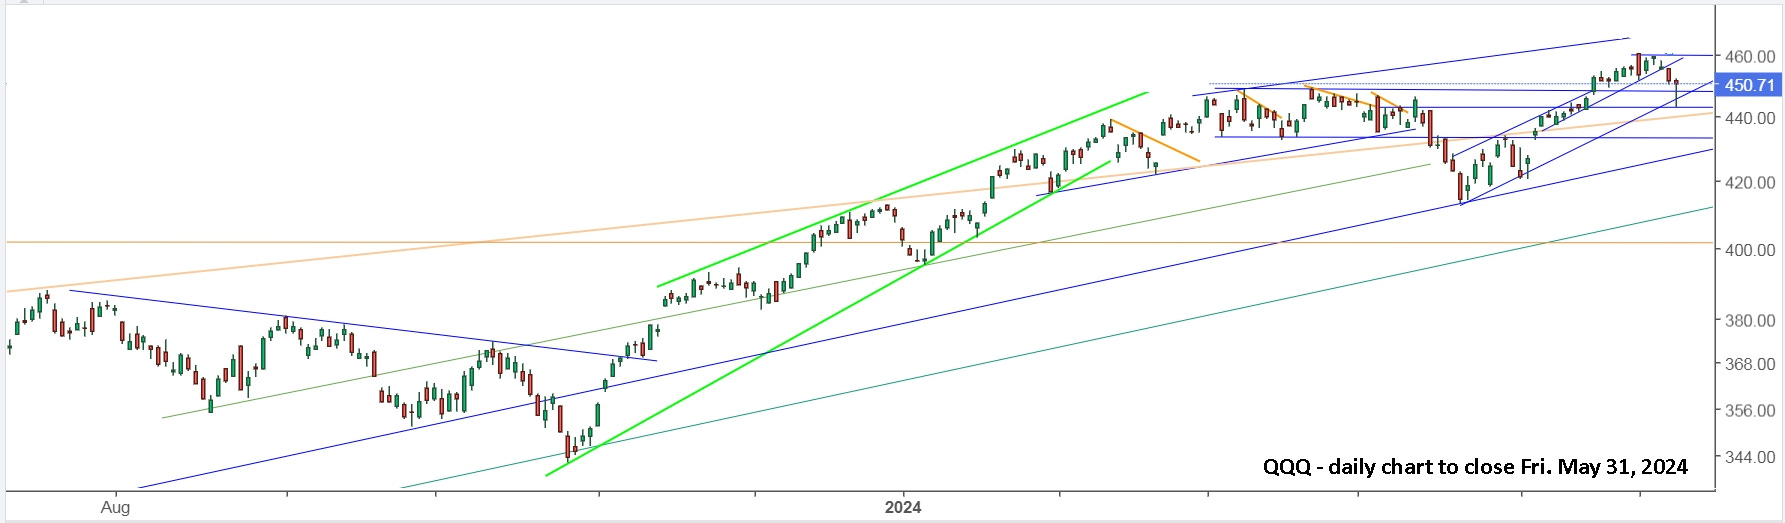
As before, there’s a possibility we’ve seen the high for the year. There’s also a good possibility that it will push higher. The trendlines now are pretty clear, so simply trust them while remaining cautious. The view for the S&P 500 is similar.
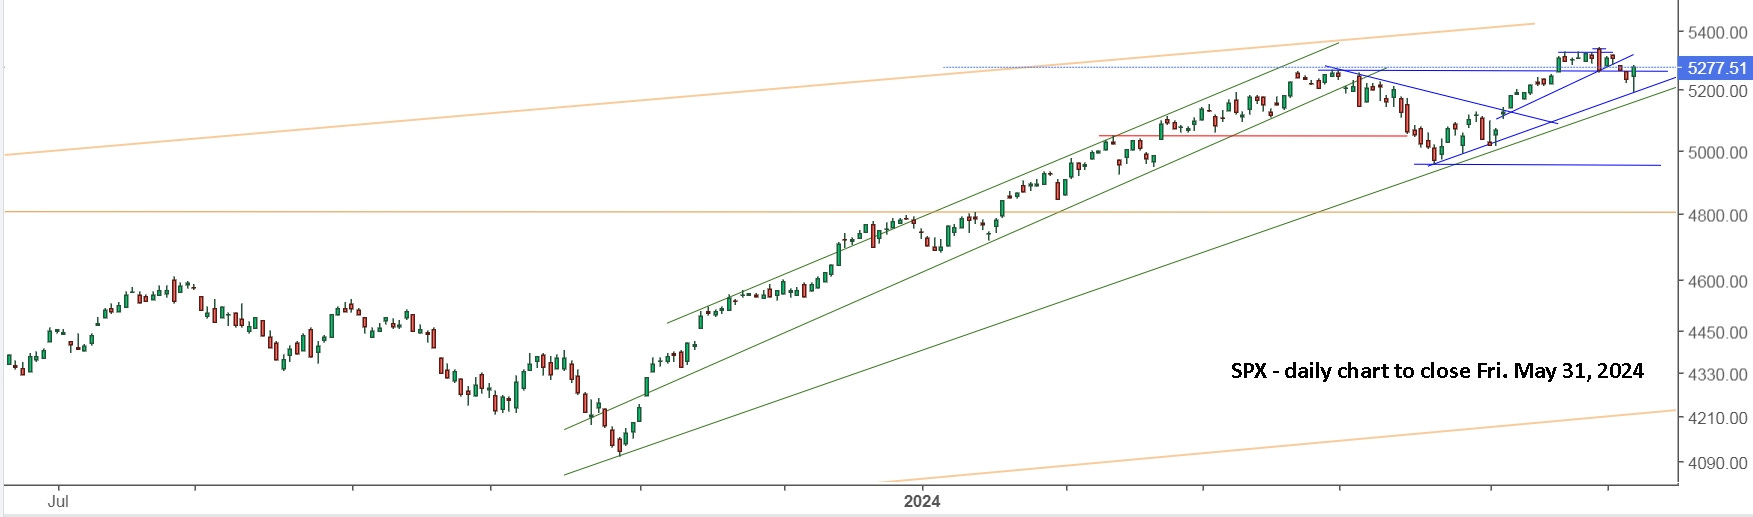
Good luck! But, of course, luck has little to do with it.
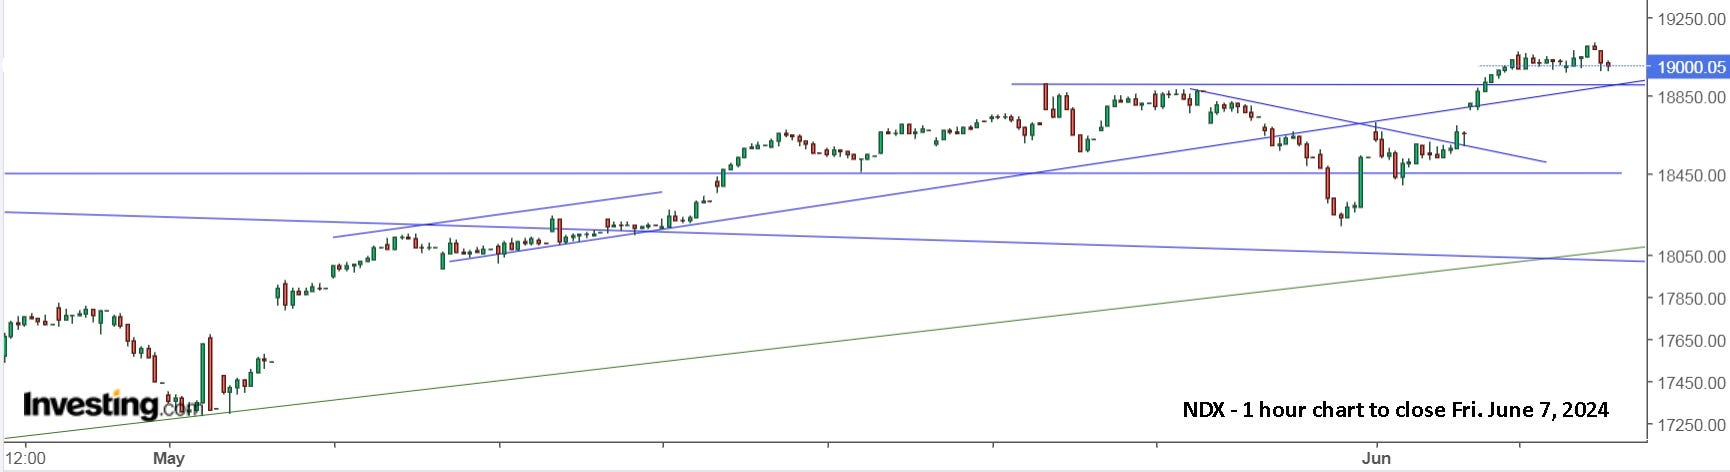
Update to Fri. June 7 : It seems that last week’s drop in the market was a ploy by the wolves to get long again off the low on Friday, May 31. Both the S&P 500 and the Nasdaq made new all time highs the past week, as did Nvidia. I’m really just waiting for the music to stop and I can quickly grab a chair.
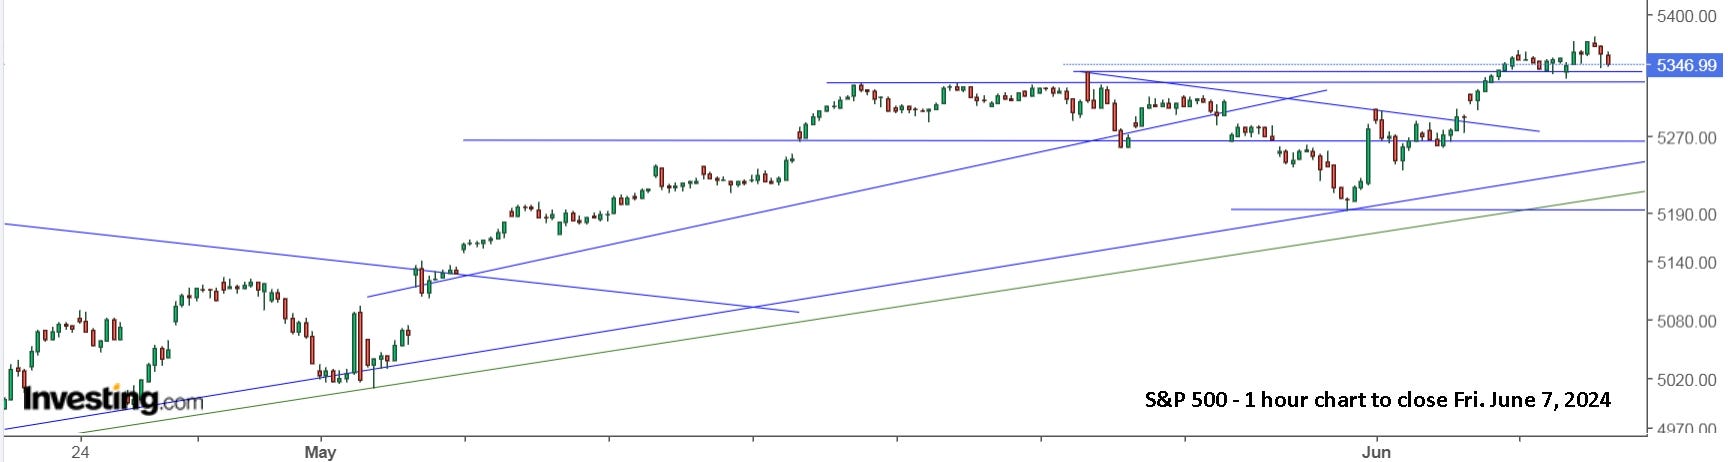
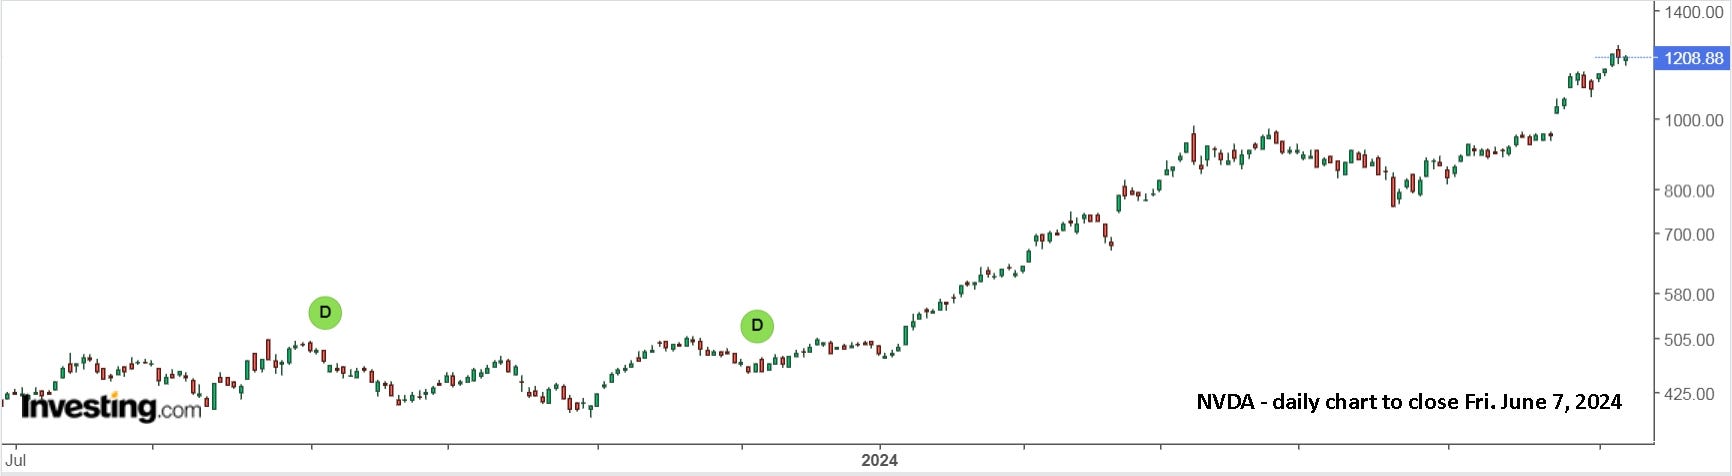
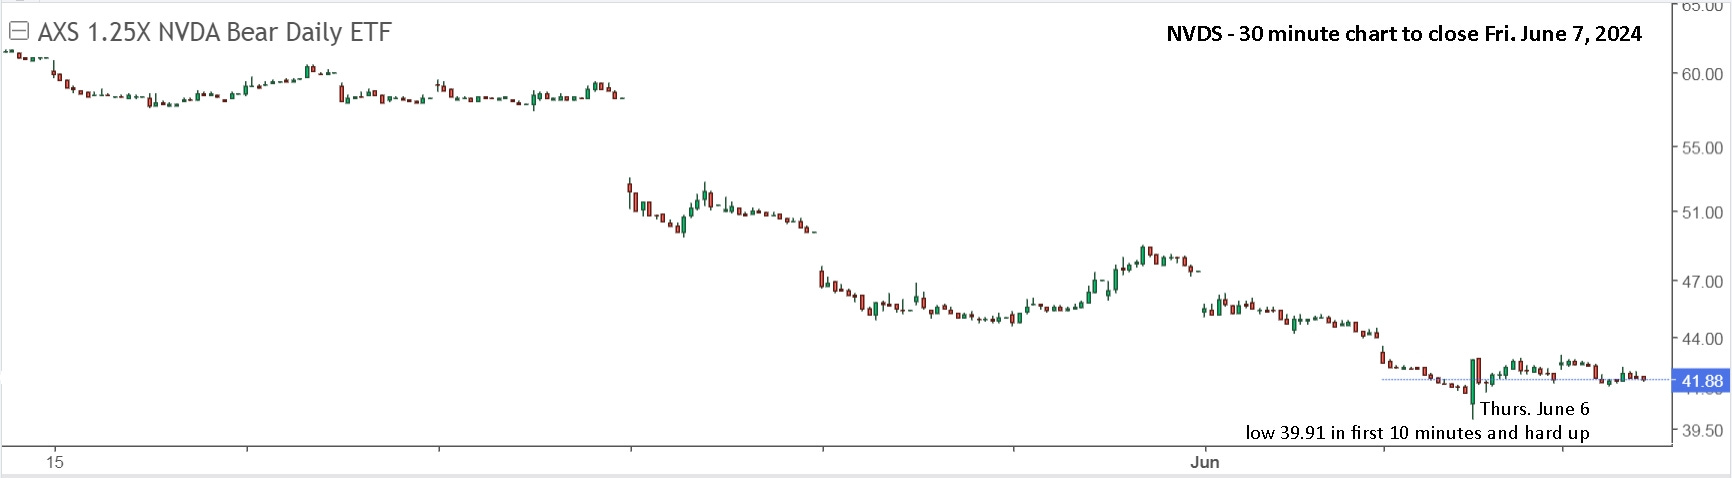
As I suspected would happen, people who went short Nvidia too early have been buried alive. I bought some NVDS on Thursday, just in case the top was hit on the gap up and rally for 10 minutes. The markets were already falling, so it was an easy decision the buy NVDS at 40.00, coming up from a low of 39.91.
I hope you’re enjoying your time doing other things and simply earning interest on the cash in your account, or trading NG for nice gains.
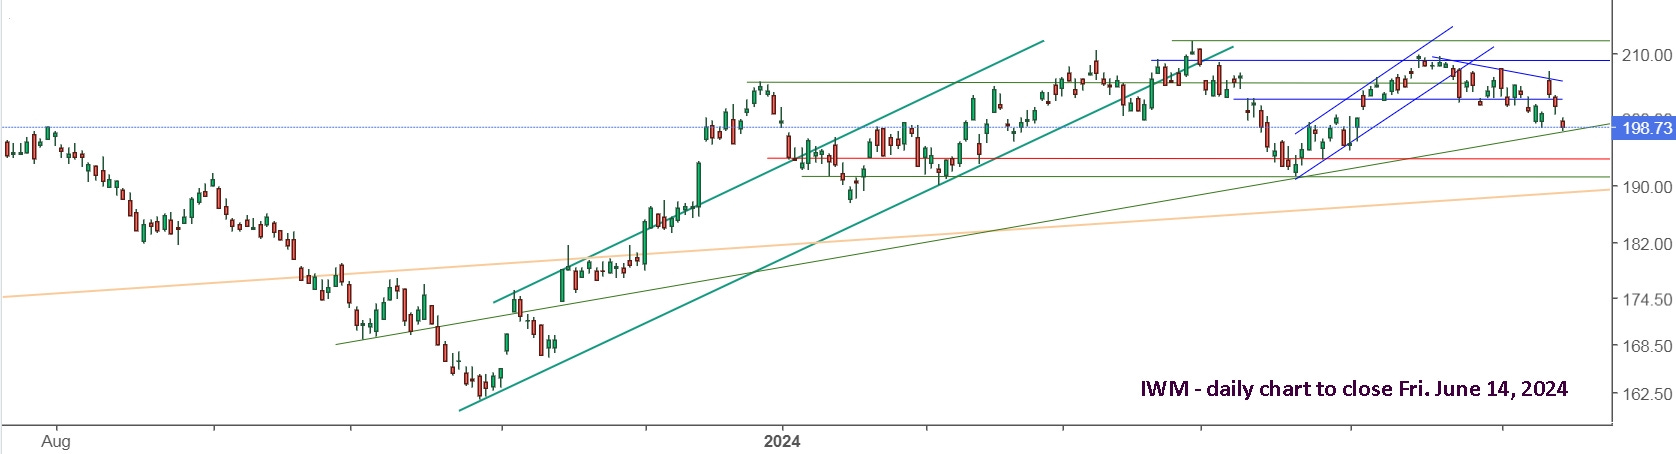
Update to Fri. June 14 : New all time highs again this week for SPX and NDX, while DJI and IWM are both down for the week. Many ‘experts’ were predicting small caps (IWM) would outperform this year, but it’s been essentially flat while the big stocks have been pushed to ever higher levels.
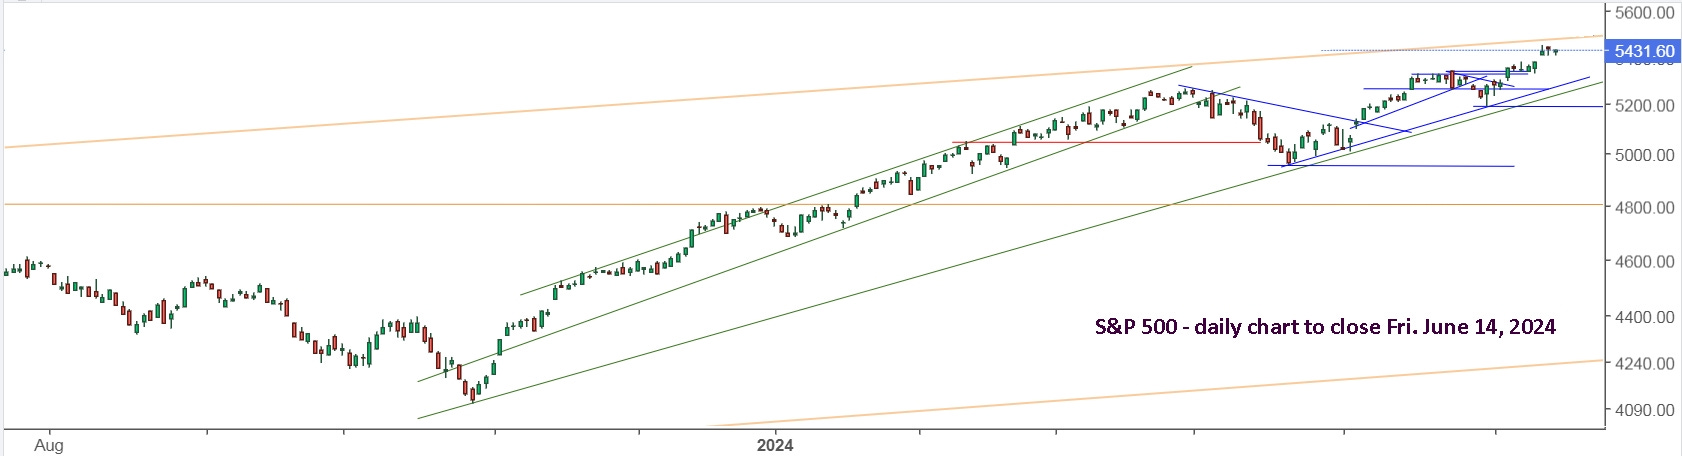
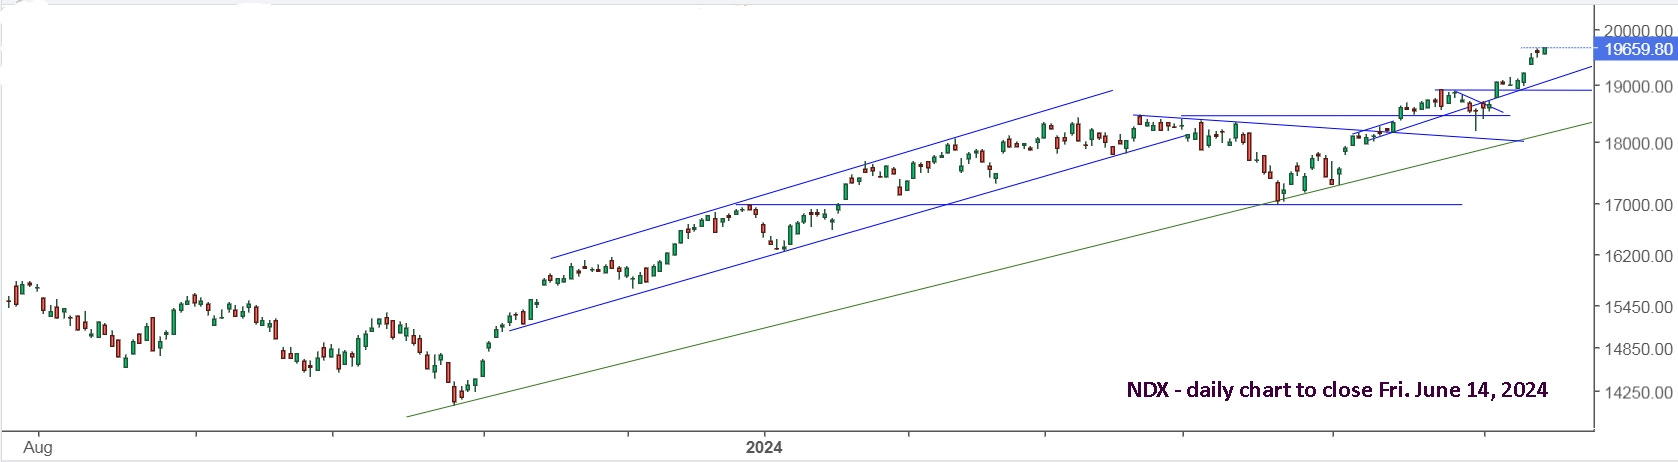
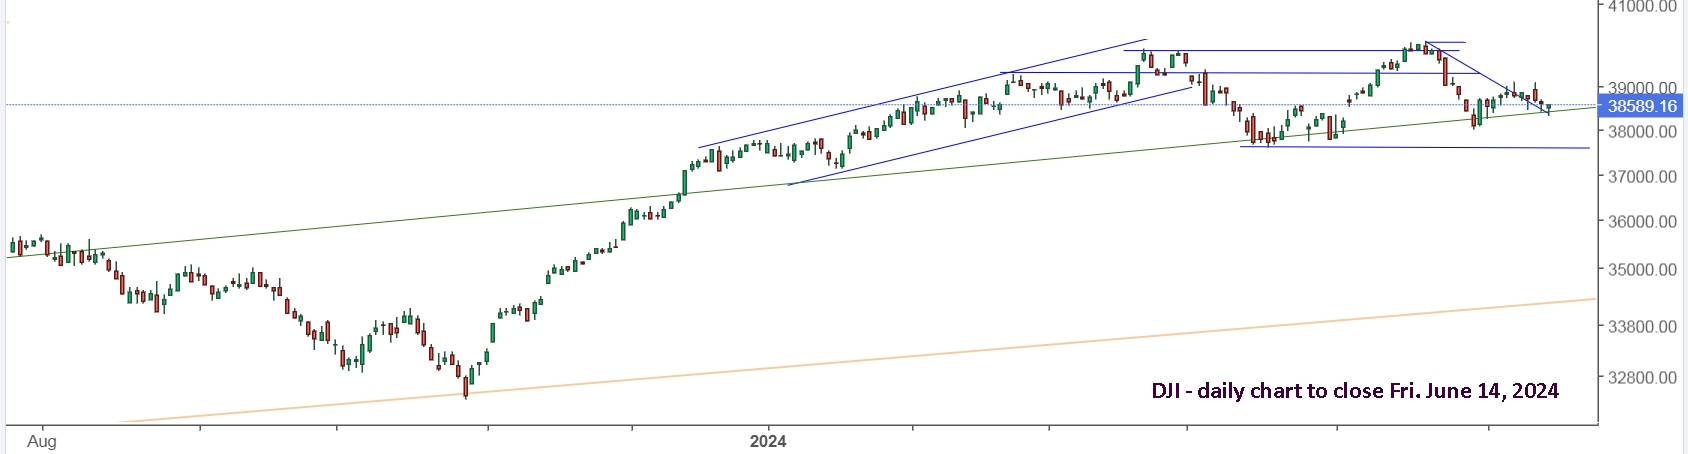
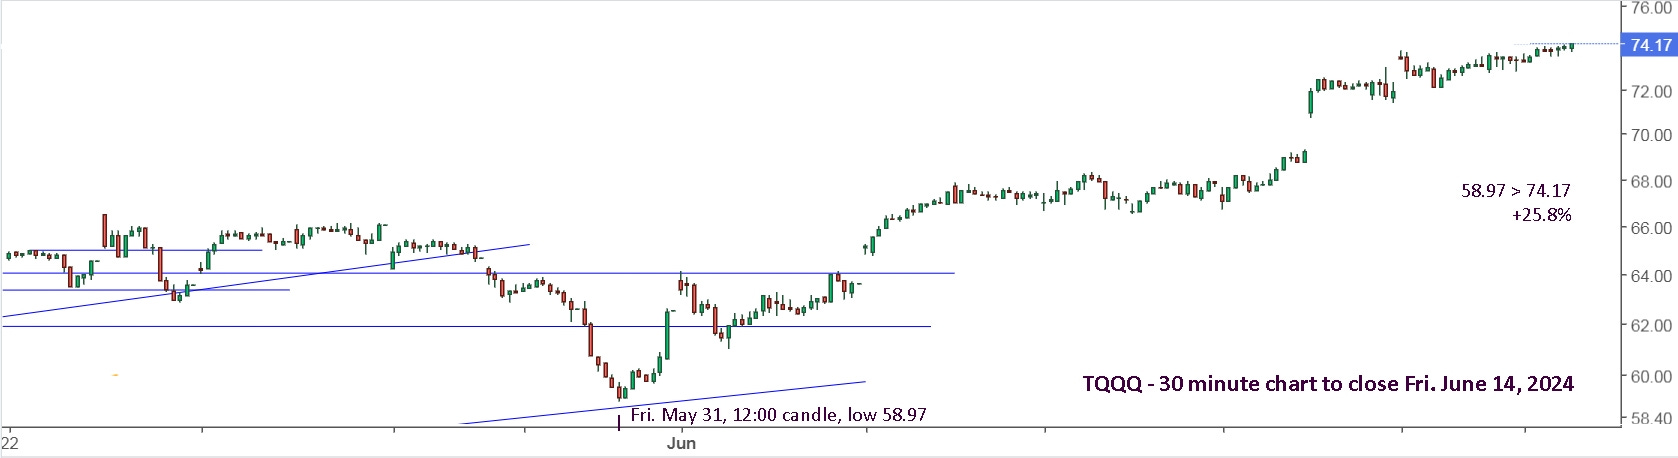
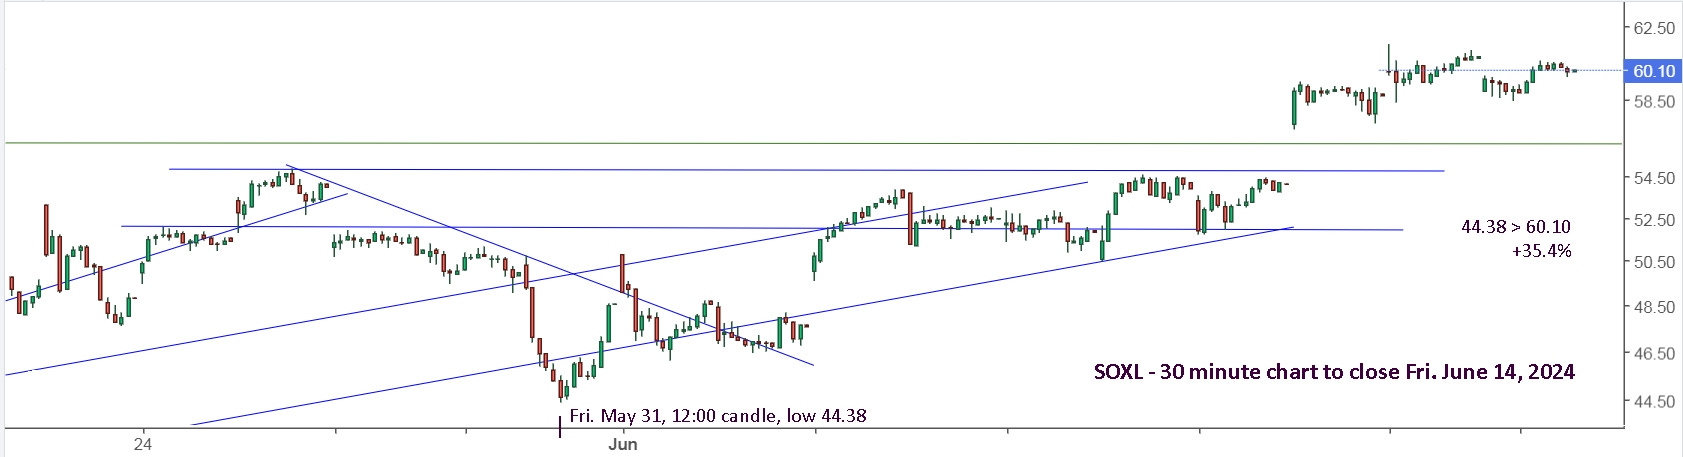
It was a good trade for TQQQ and SOXL since the smackdown on May 31, and it shows exactly how nothing happens till the market movers make it happen. There was nothing special that day, versus any other day in the past 2 weeks, and markets could have easily dropped hard on Thursday or Friday this past week, but there simply wasn’t any ‘push’ happening.
They may continue higher, but I don’t think it’s a good bet to remain long. Better to wait for a pullback and wait for an opportunity to go short with SQQQ, SOXL and/or UVXY.
Update to Fri. June 21 : Markets moved up sharply on Monday, setting new all time highs again for SPX and NDX, but they lost momentum by 2pm. Tuesday was fairly flat, Wednesday was a holiday in the U.S., and Thursday was a gap up and fall, so you should have sold and perhaps gone short with SQQQ or SOXS.
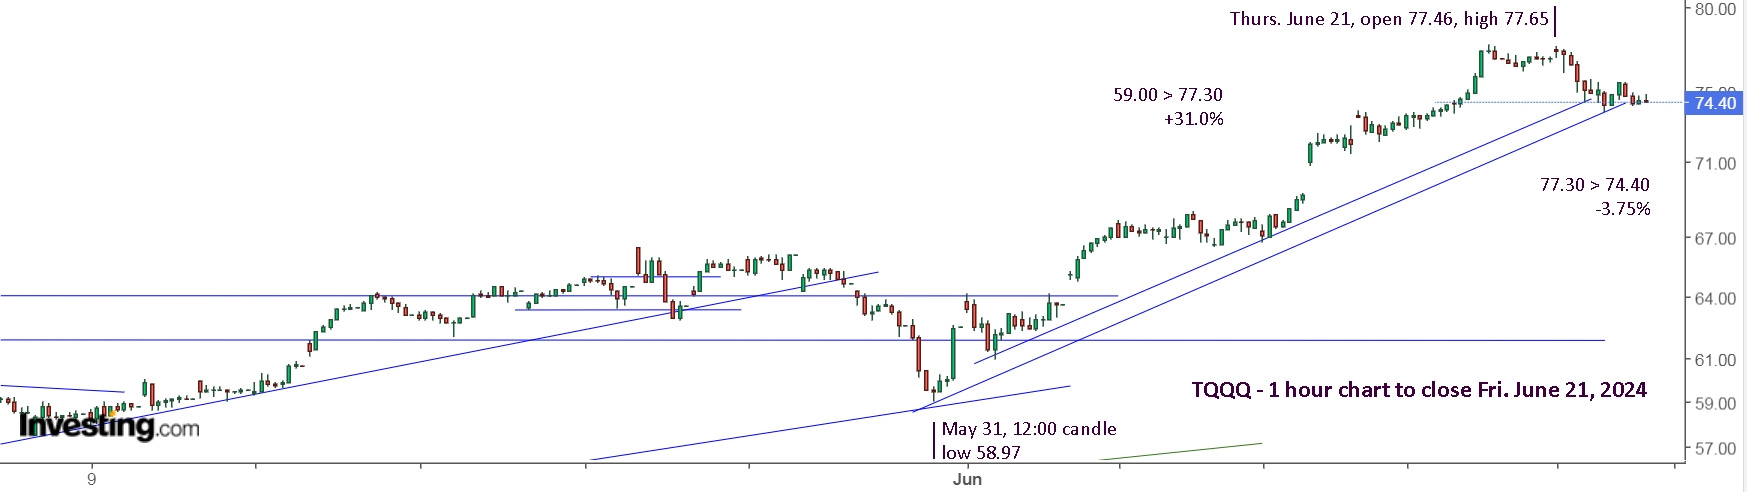
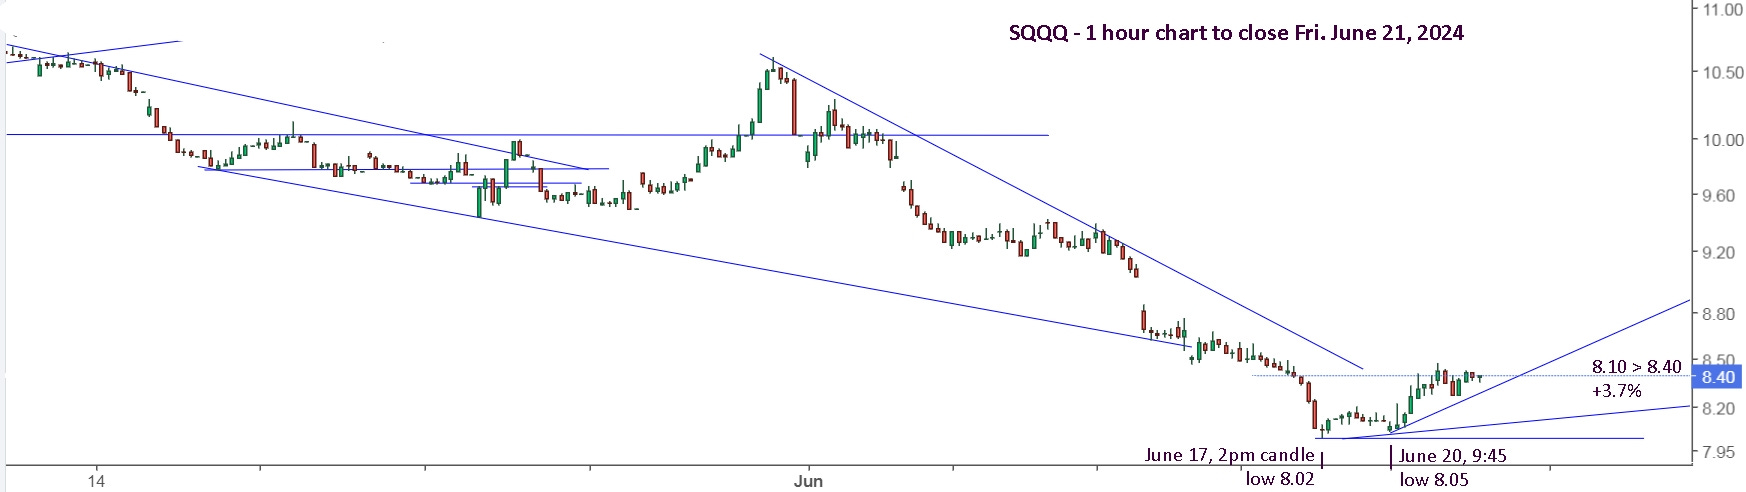
Future updates will be made on the new article, “First, you have to believe it's possible.” and going forward, I will share my alerts and stops, as I attempt to minimize my trading and avoid watching the markets closely during the week. For SQQQ, I have set an alert and stop sell at 8.20. I’ve also set an alert at 8.90 and 9.15. If it gets there, I can change my stop sell and set new alerts. For TQQQ, I have alerts at 75.90 and 70.00.
I told a friend over the weekend to look at buying HNU or BOIL. I hope he did as Monday gave a chance to buy at Friday's best price, and even slightly better. They rallied, fell back, then held flat all day. After hours, NG blasted higher and they were up 25% before the open. I sold out, expecting a dip, bought the dip and they're back up to the pre-open level for an extra 6%. With NG March only up to 1.78, it could easily continue higher, so I will hang on to BOIL but continue to watch for trade opportunities.
Good odds to go short this next week. Markets are looking extended due to a few stocks going parabolic (NVDA). But when you look at the market as a set of stocks such as IWM or equal weight RSP, you see they are actually flat. This year marks one of the largest divergences of the top 5 stocks vs the rest of the market. RSP is +3% while SPY is +14%. QQQE (equal weight) QQQ) is +6% while QQQ is +20%. If you didn't buy NVDA but bought every other stock you are underperforming the indexes by 10% this year.
Often times this leads to one of 2 things, either rotation into the forgotten stocks or a market correction.
VIX is still low signaling no fear and further gains for SPY. However, VIX bottomed on 21MAY and has made a higher low as SPY pushed up. Friday was particularly strange as usually VIX crashes on Fridays, yet it rose with the market. Typically VIX starts to rise before SPY drops. If SPY continues up next week, I expect VIX to climb as people should begin to hedge for a correction. On the 2nd or 3rd day of the correction look for VIX to put in a lower high, or start to fall with SPY to mark the end of the correction.