

Are you ready for a market drop?
The trend is still up, but we're due for a pullback.

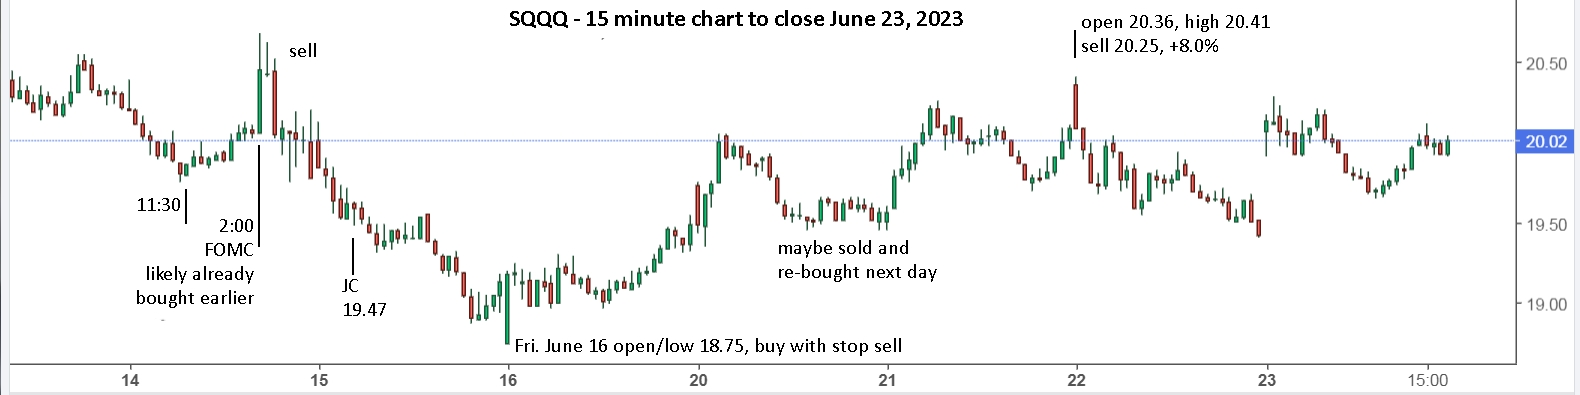
If you’ve been doing a weekly review, you already know that the markets look pretty extended and due for a pullback. Last week was a perfect opportunity with CPI and PPI inflation reports and the FOMC meeting. The markets pushed higher on Monday, gapped higher on Tuesday following the CPI report and was mostly flat on the day, up a bit from the open. As you know, that put us on alert for a drop after the FOMC at 2pm on Wednesday. On cue it dropped hard then reversed 30 minutes later and never looked back. When it was showing a gap higher pre-open on Friday, that was the cue to take a swing short, buying at market with a stop sell if the markets pushed up.
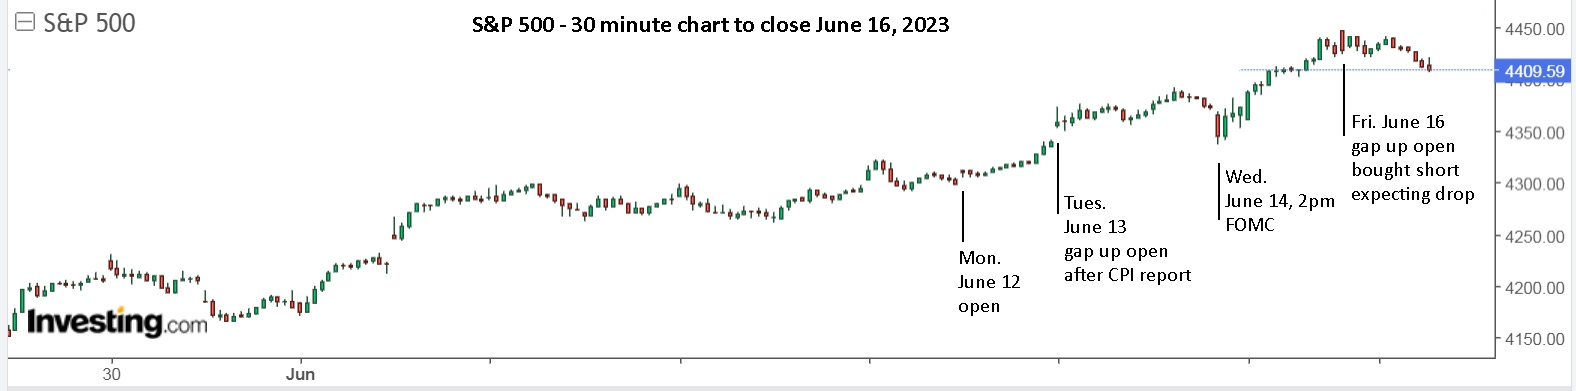
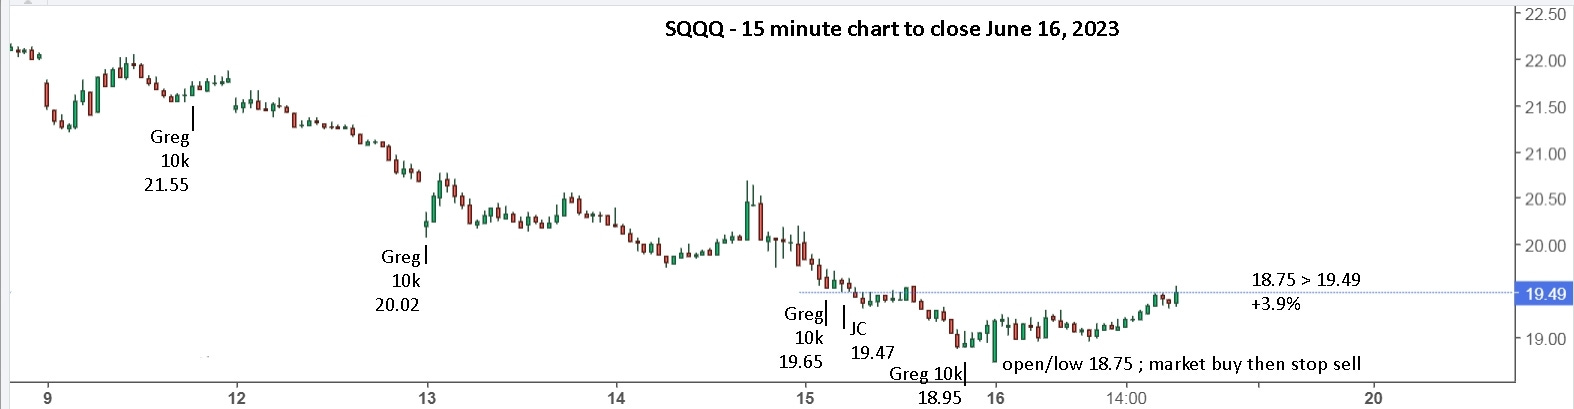
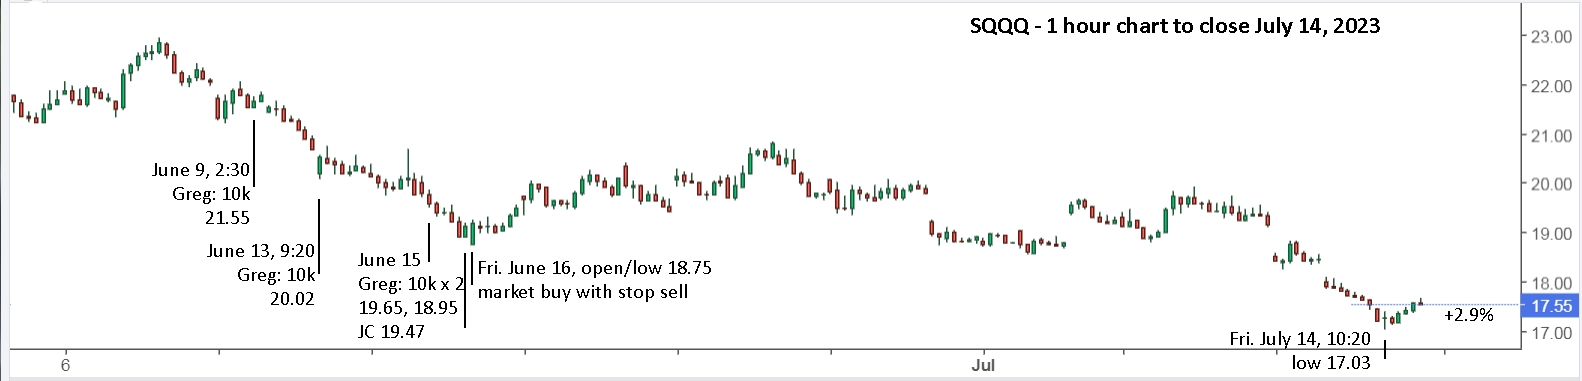
Knowing that JC bought SQQQ on Thursday, gave us all the more confidence to buy at the open on Friday. Both he and Greg have a set strategy to add as the price drops, which works for them, but I hate it. I much prefer to buy at a potential bottom, like Greg, but then sell for a small gain if it reverses against me. JC generally sets his buy and sell points the night before and has complete conviction that he’ll end up with profit.
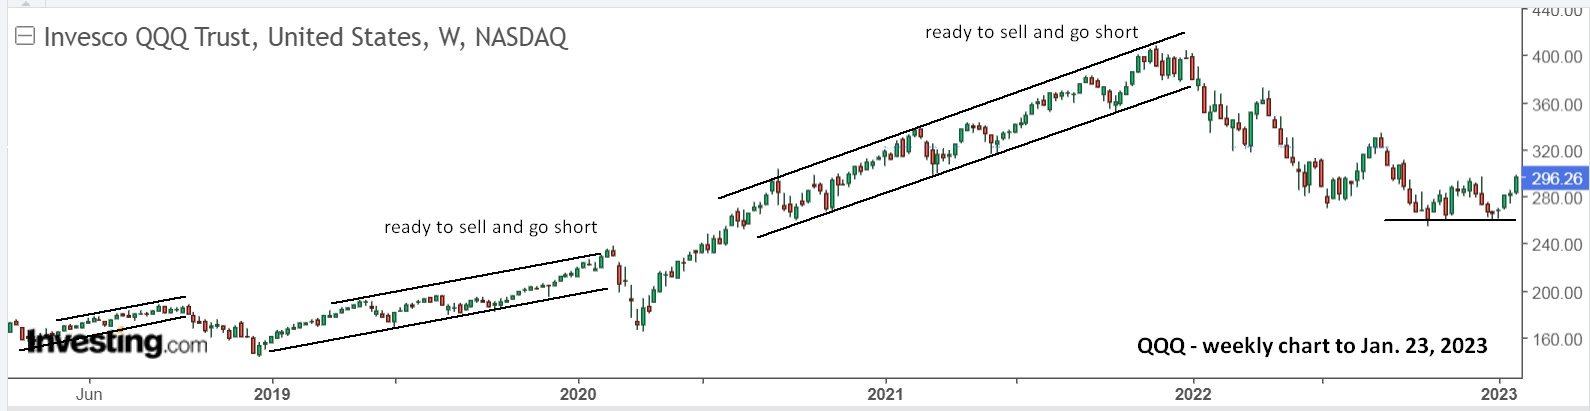
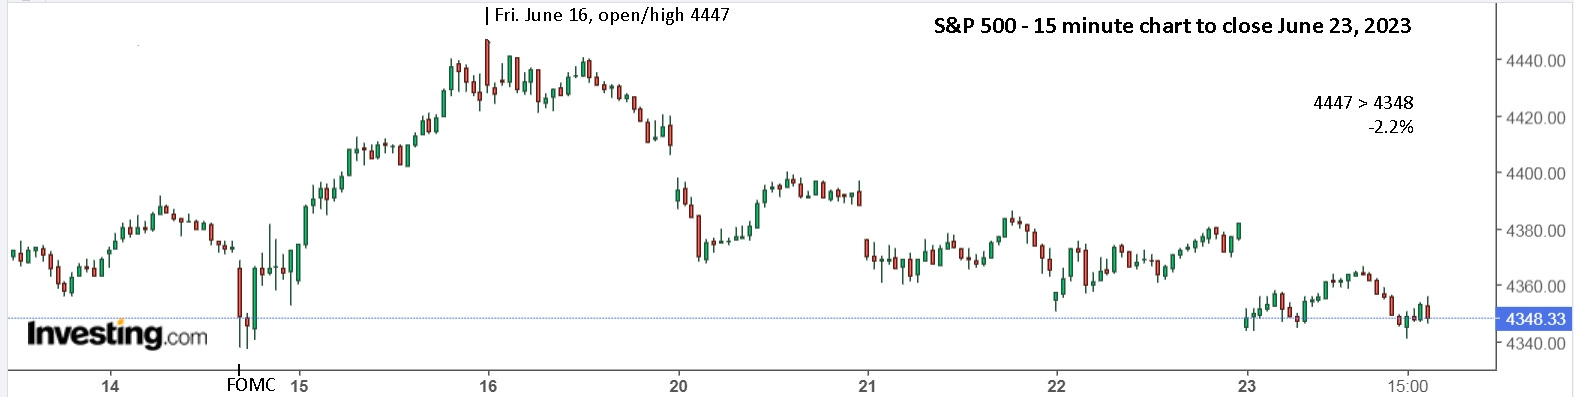
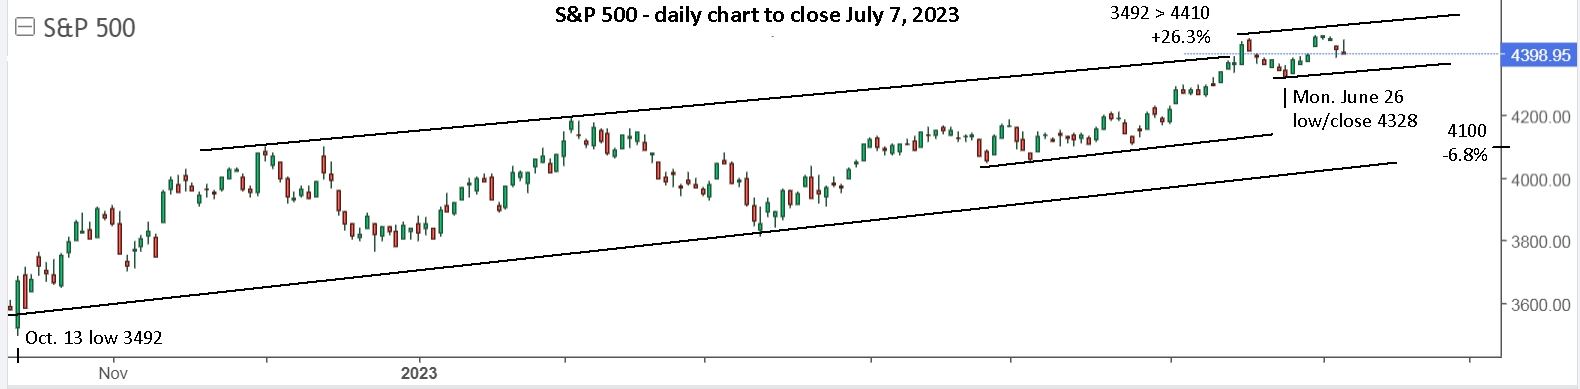
A look at the daily charts clearly shows that taking profits and going short is likely a good idea. Remember the strong move up in January that was completely given back in February-March for the S&P 500. That was roughly 8%, and taking an 8% gain in 1 month off the table when it is up to resistance is something you should always do, and you already did successfully in December.

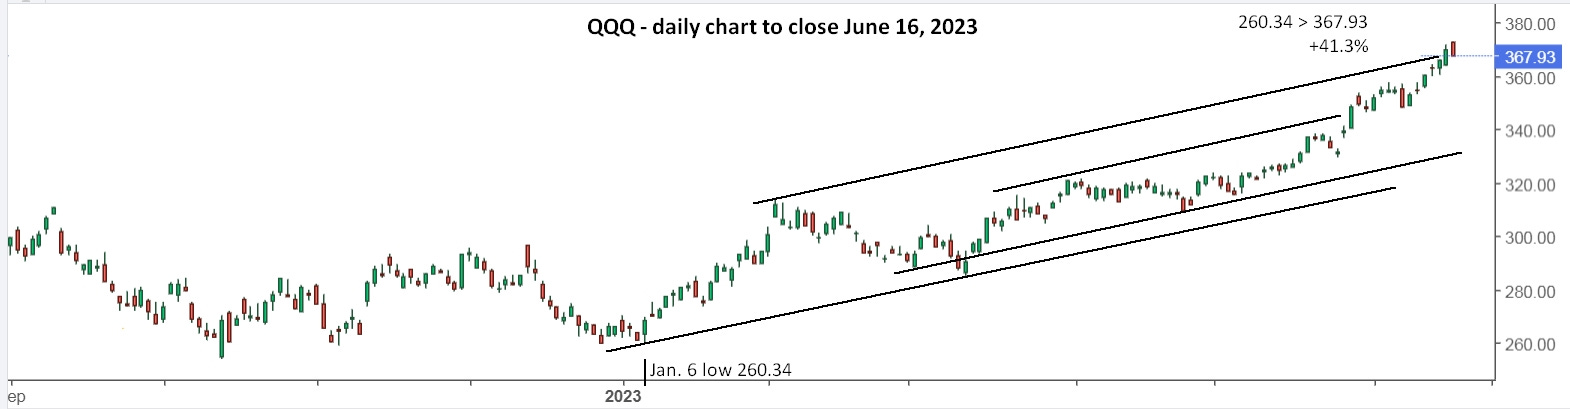
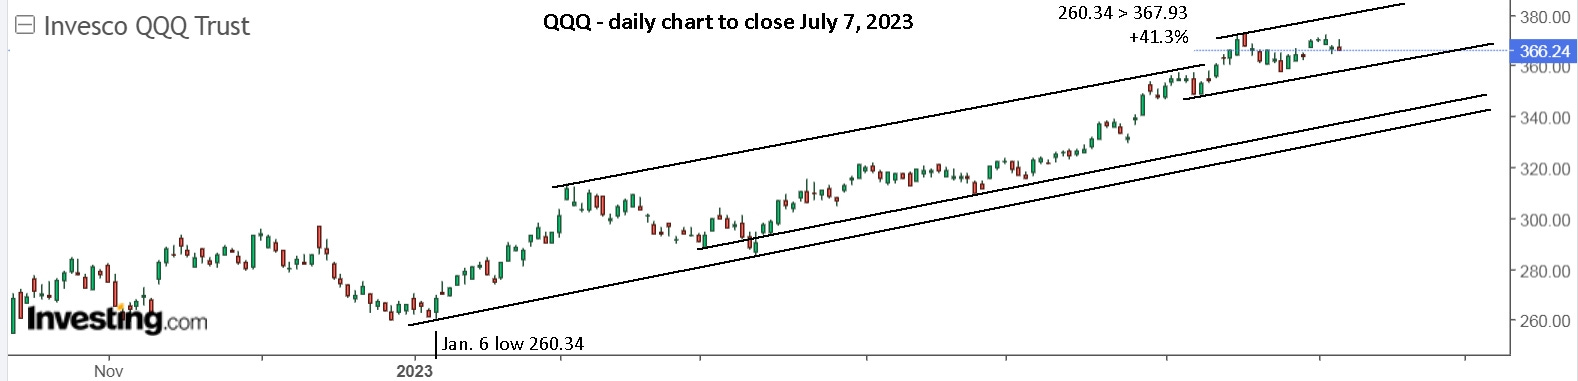
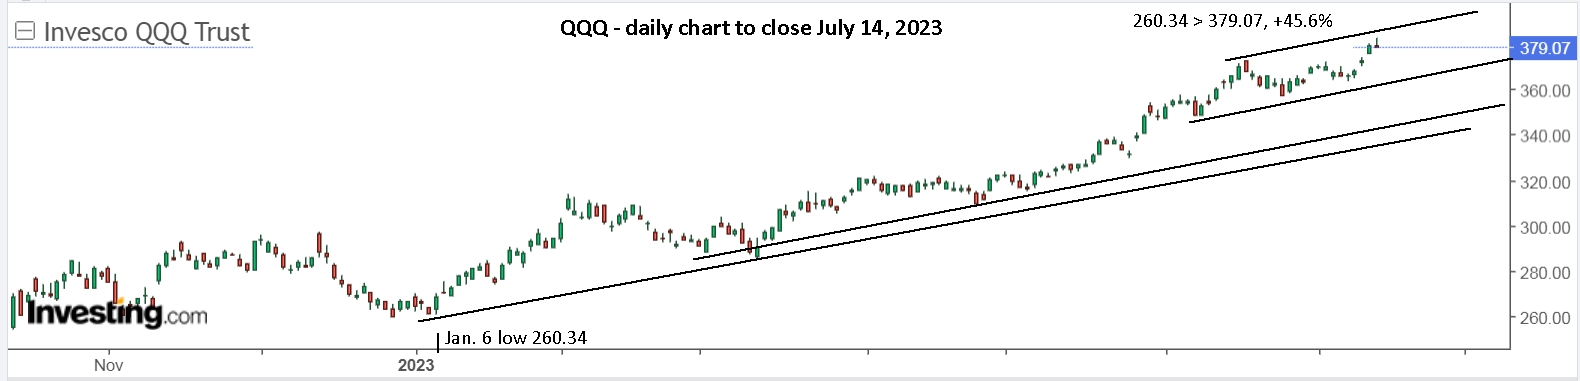
The Nasdaq and tech stocks have really been on a tear this year, largely fueled by Nvidia, which is up nearly 200%! At last week’s high, the Nasdaq was within 10% of its all time high and up 42% since January 6. Leaving those gains on the table, with the charts above, is simply foolish.
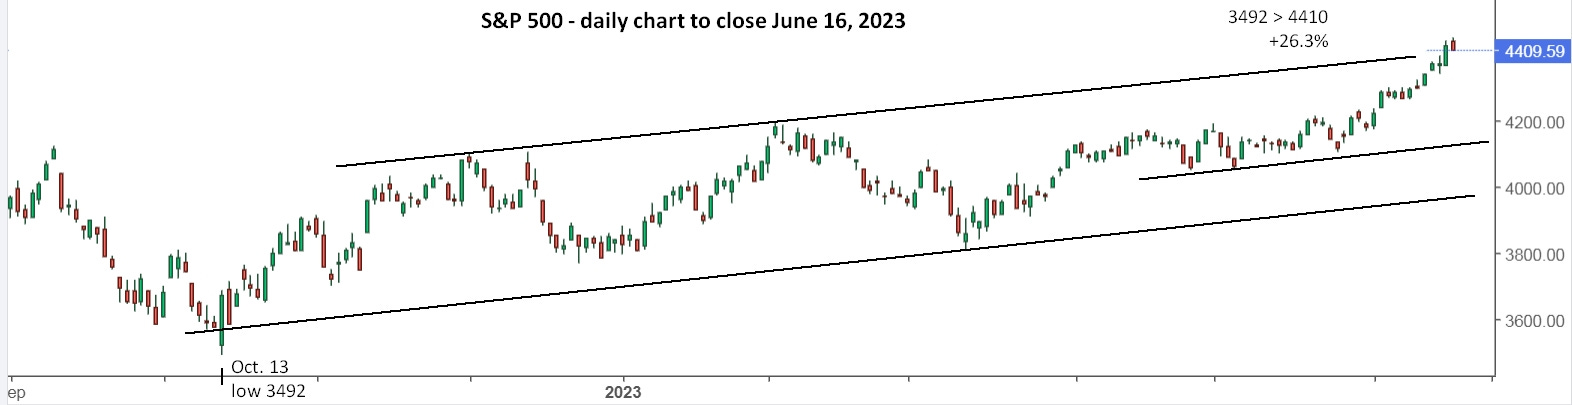
At the start of the year, I wrote, “Trends to start 2023.” and posed the question, will the markets move up in 2023, or will they crash to new lows? I replied, “History says they will rise, given that it’s the 3rd year of a presidency, and that is what occurred every single time in history. That’s a good ‘ace in the hole’ to remember, but simple trend lines have been remarkably helpful all year, so let’s see what they’re telling us now.”
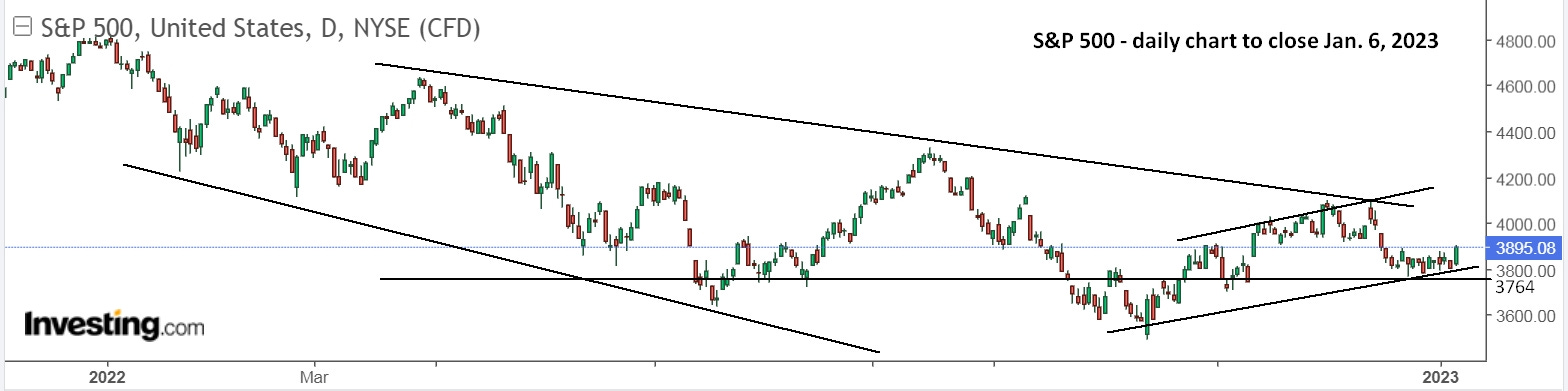
Note that the January rally hit the upper trendline, suggesting caution, then fell to the lower trendline by the end of February, rallied up for 3 days in early March and fell hard to a lower, parallel support line. Once that held, there was confidence for the bull trend to resume.
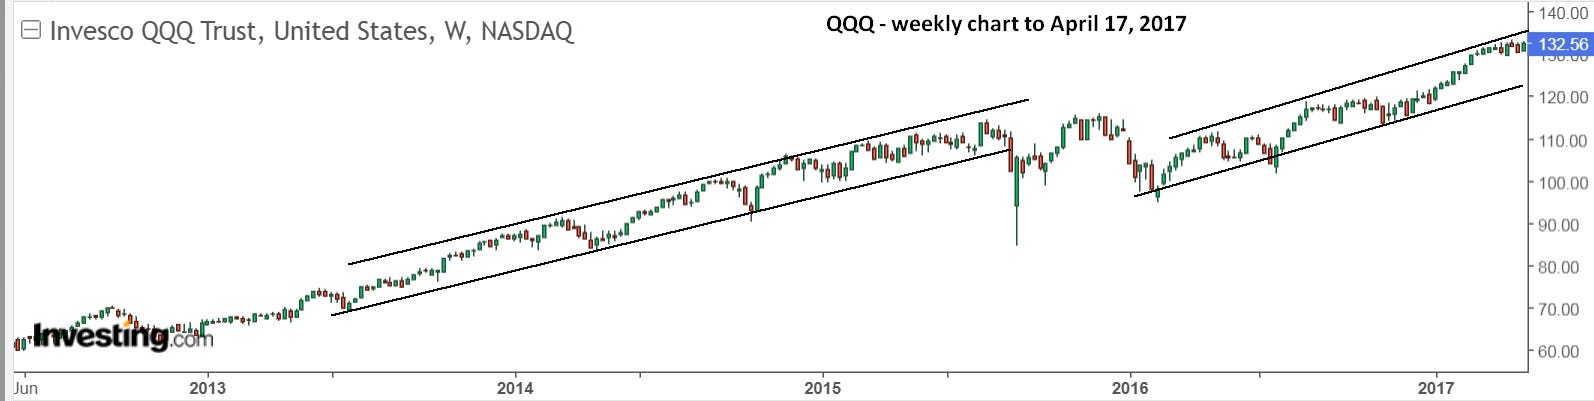
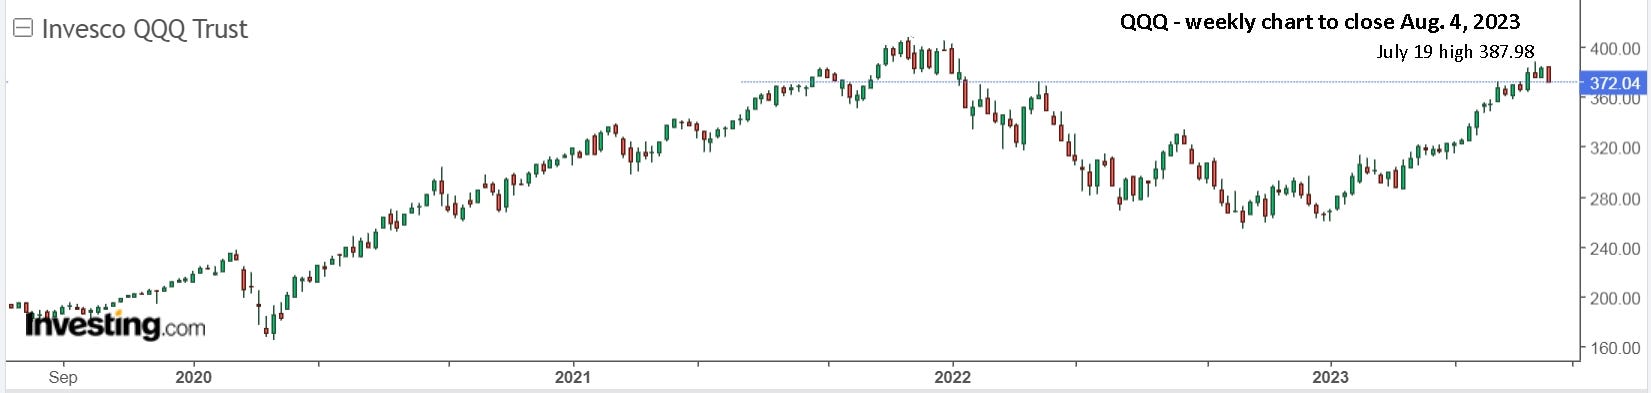
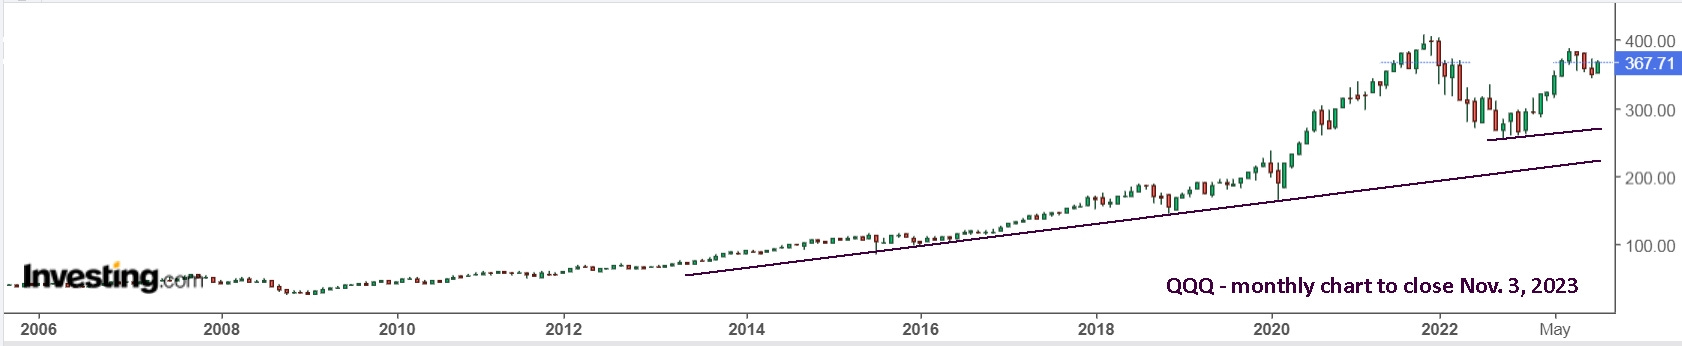
A review of the trendlines for QQQ since 2009 shows how powerful they are.

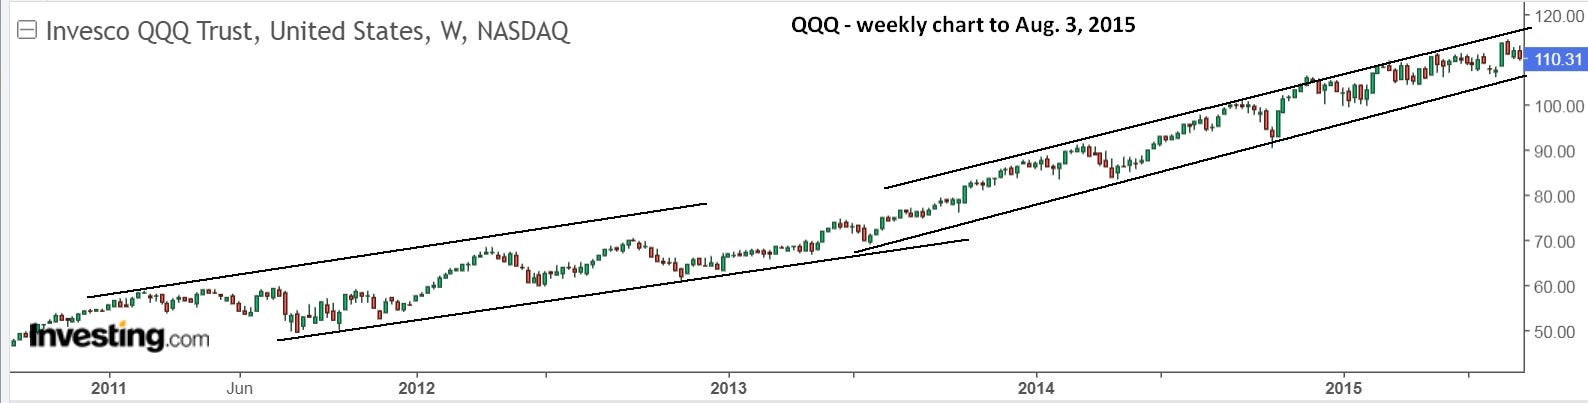
Sure, you could simply do nothing and still have done well, but selling on drops from the upper trendline avoids significant drops, and more importantly, has you safely on the sidelines in advance of the market breaking the lower trendline support.
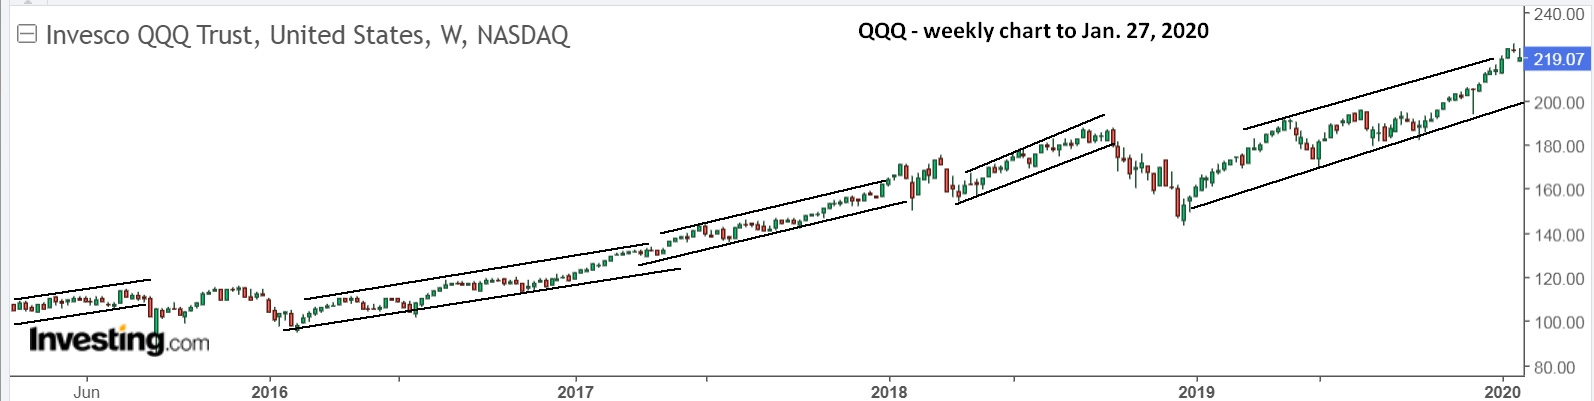
From the above chart, you were clearly cautious and taking gains off the table in early 2020. It seems that covid was simply a trigger for a market drop that was ready and waiting to happen. By late 2021, the charts were again shouting caution.
By the end of 2022, there were clearly bullish signs. Why wait for the market to move up 20% indicating a new bull market? The December low was clear support, so buy then and sell if the support is broken. It’s really that simple.

The May 26 weekly chart suggests caution again. Three weeks later, we were still on high alert and the markets pushed up sharply. We now remain on high alert, knowing that a drop of 12-15% is likely, in order to return to the lower trendline. You’re also up 41% YTD doing nothing, and significantly more if you sold and avoided the drop in February. Doing nothing now will likely be even more costly.
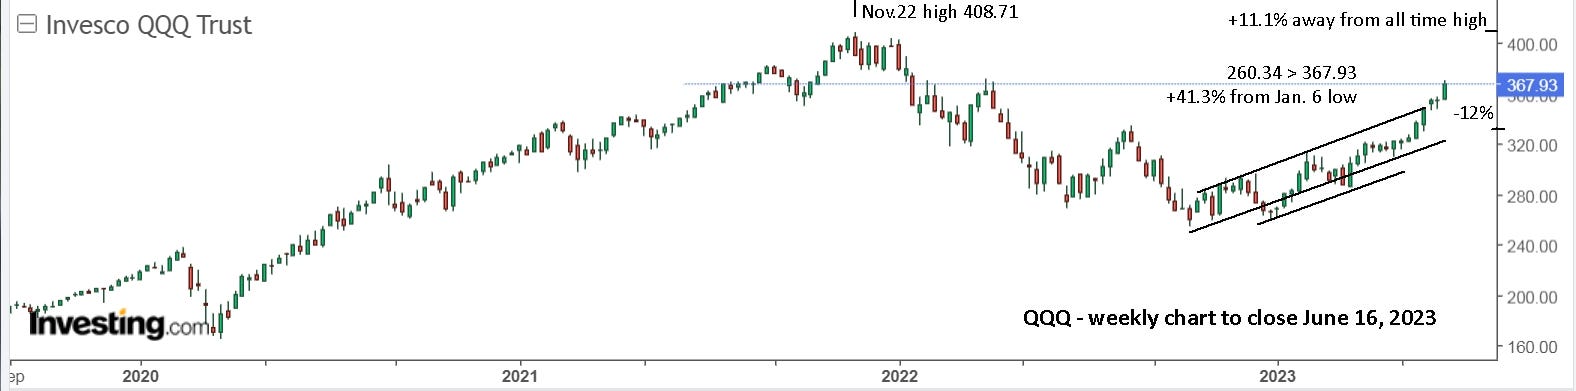
At the start of the year, I doubt many people expected or predicted the Nasdaq to be within 11% of its all time high in less than 6 months. Yet, the trendlines you drew then suggested that exact outcome, albeit not for several more months. Let’s see what might be in store for the remaining 6 months of 2023.
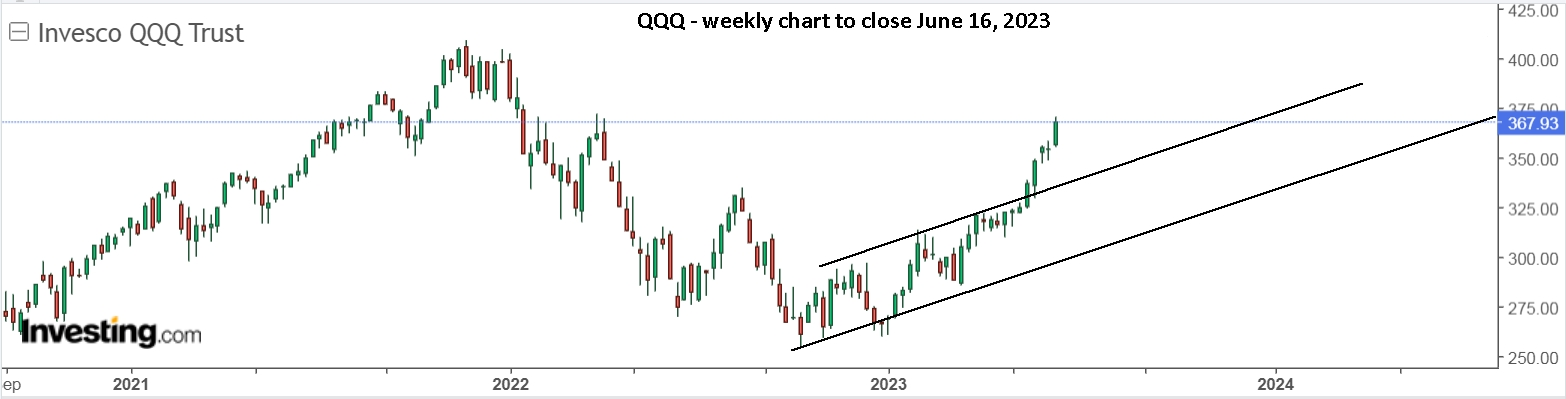
Wow! This chart is surprising and not at all what I was expecting. It’s telling me that we may have hit the high for the year, or could hit it soon. It could then take a year or more to make a new high while maintaining the overall bullish trend. Many individual stocks tell a completely different story, but the above chart presents an interesting potential. Note that although JC is currently holding SQQQ and SOXS, he is very bullish for the remainder of the year. (Here’s his charts for QQQ.) If you draw a higher upper trendline, parallel to the others, then a steady climb looks reasonable and the shown upper trendline could become support. I’ll continue updating this article like I did with the “Trends to start 2023.” article.
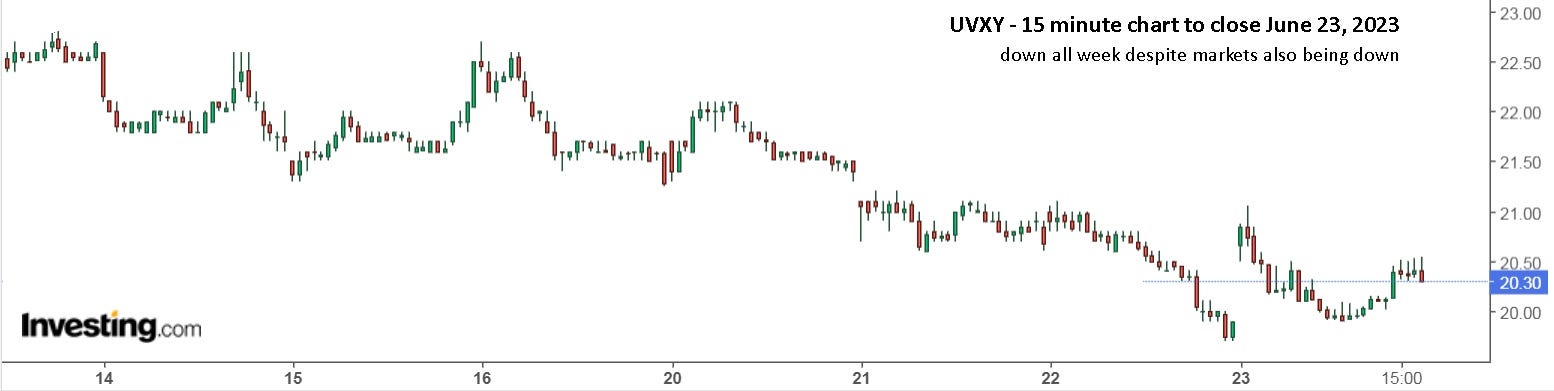
Update to Fri. June 23: The markets did indeed pullback, but not significantly. There could be more coming next week, or they may push higher. There certainly seems to be a lot of bullish momentum still. SQQQ gave 8% from Friday’s buy and the safest spot since is on the sidelines. Volatility was also down with the markets, which sometimes happens when a pullback is expected.
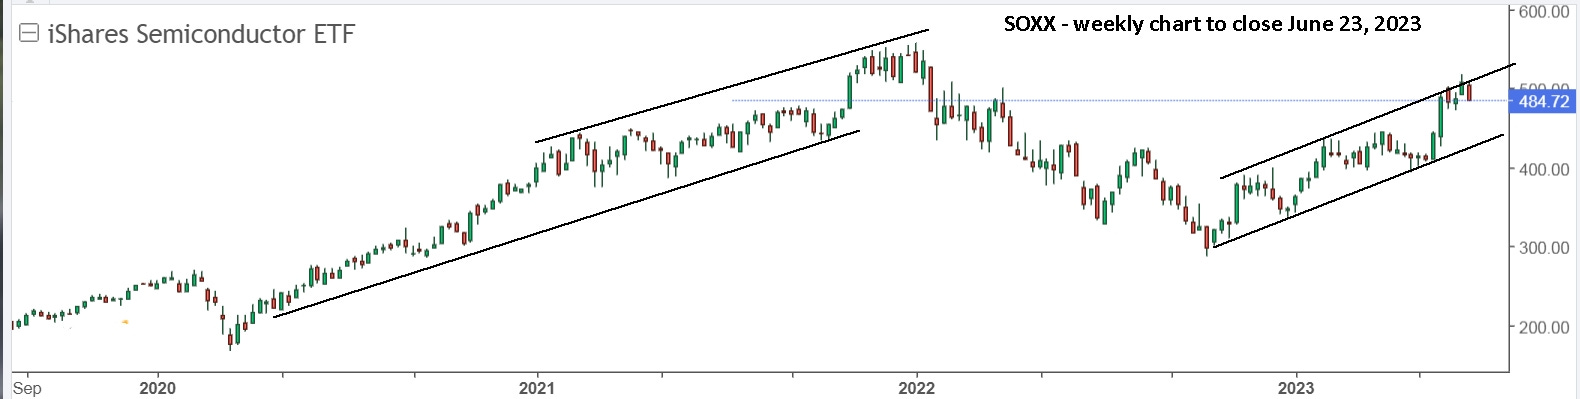
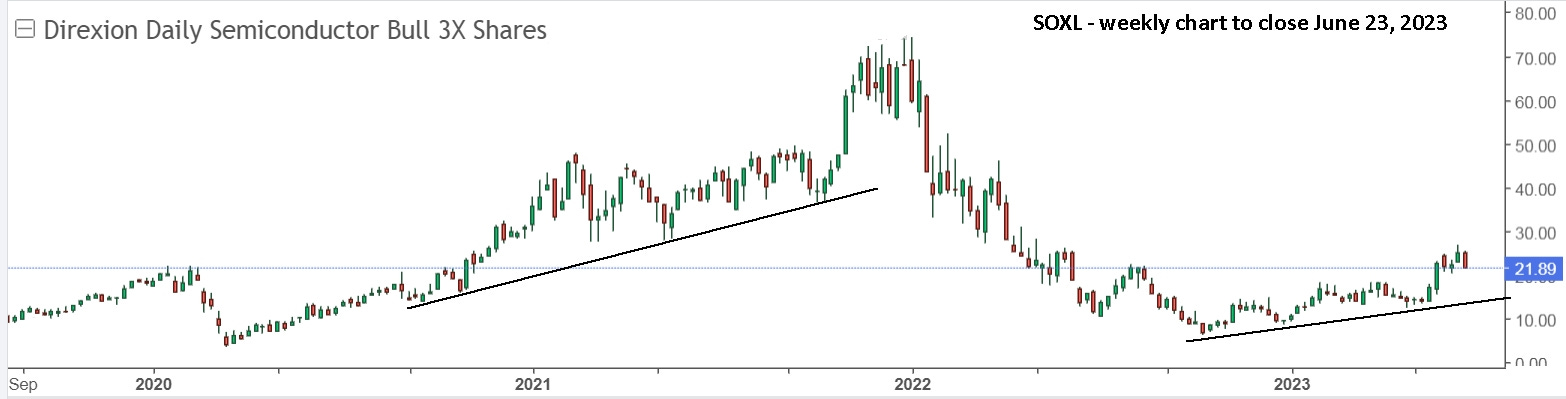
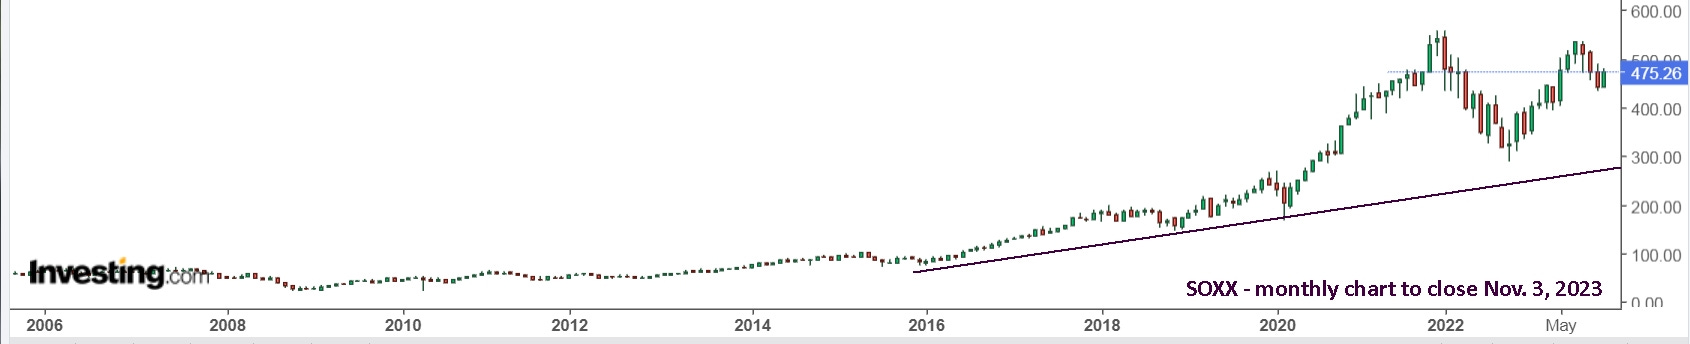
I plan to be watching for a chance to buy SOXL, which is the leveraged version of the semiconductor ETF, SOXX. From the October 13, 2022 low to the recent high, SOXX was up 79.5% and SOXL was up 320.6%.
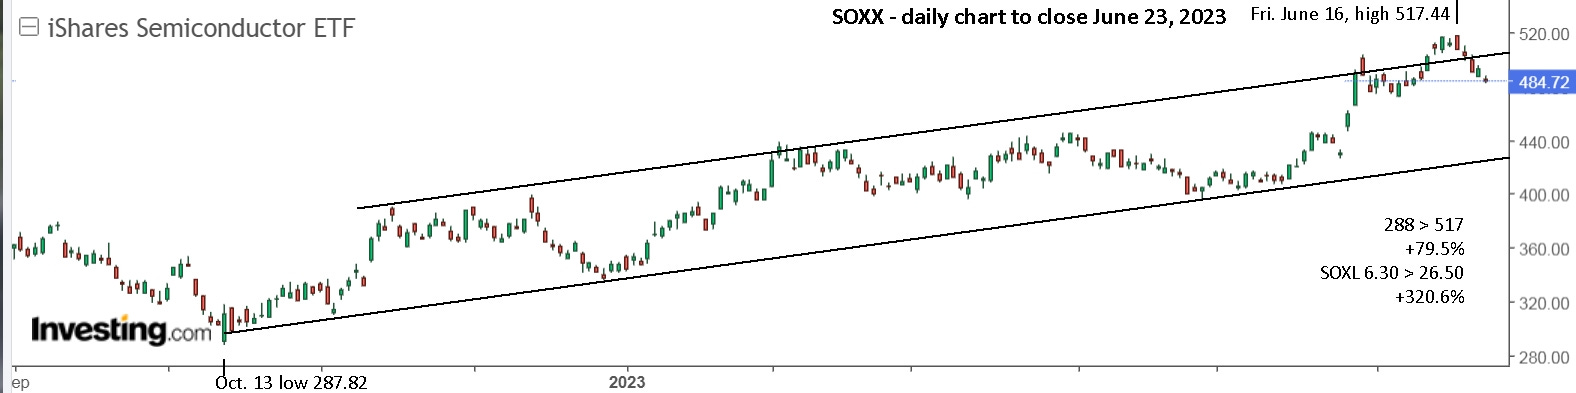
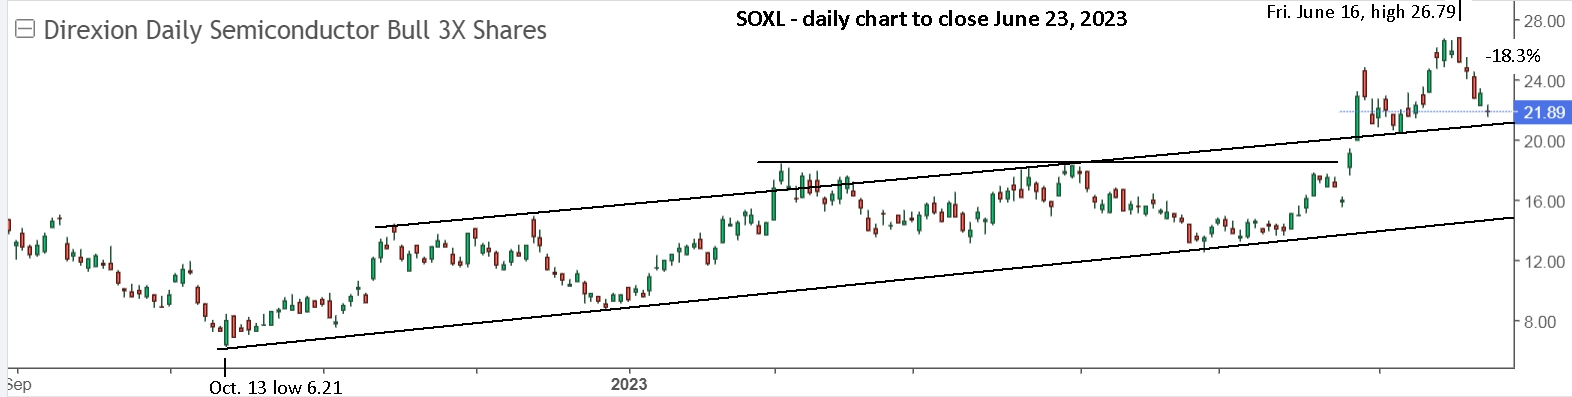
Be careful not to be too enamoured with SOXL and just hold it. The ‘width’ of that channel is nearly 25% so be sure to sell at the upper resistance. From the June 16 high, it’s down 18.3% a week later. Great if you switched to SOXS, bad if you kept holding SOXL.
A weekly view shows the decay clearly between SOXX and SOXL.
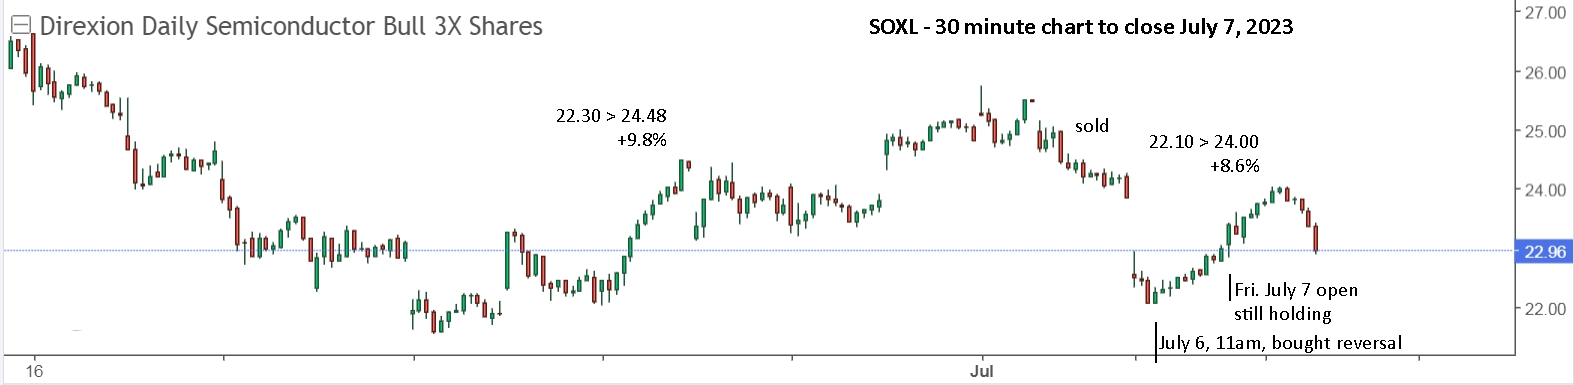
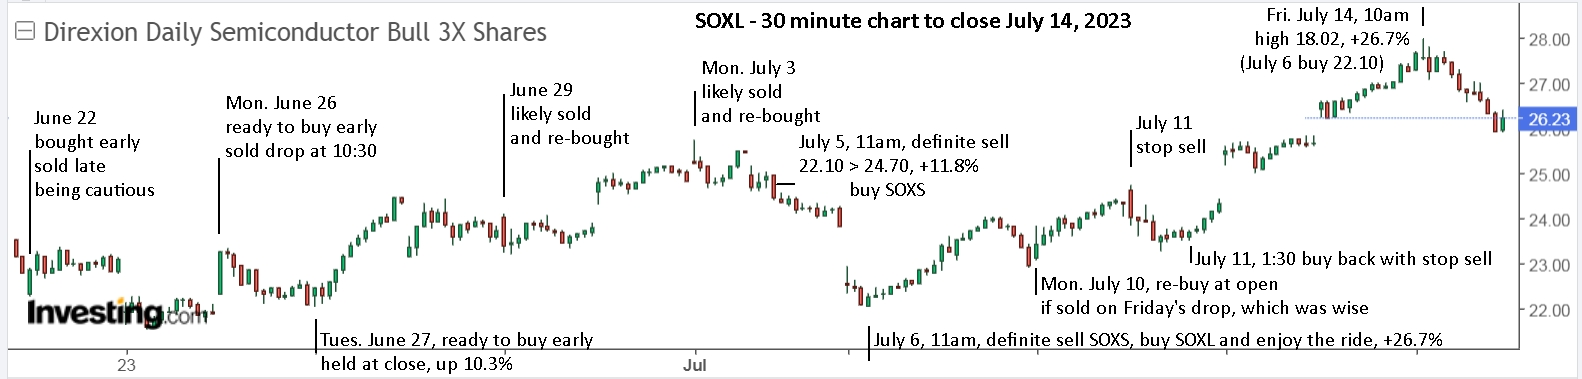
Update to Fri. July 7: Monday, June 26 turned out to be the low with the markets opening higher on Tuesday. SOXX/SOXL bottomed on Friday, June 23 and my plan to watch for a chance to buy SOXL paid off on Monday and Tuesday but it wasn’t easy.
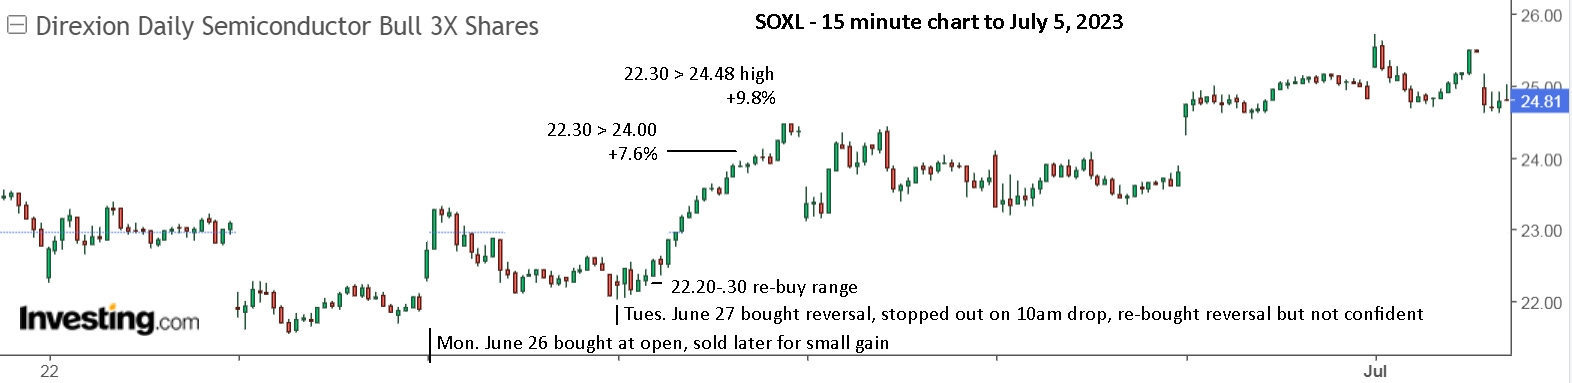
The key is to stay persistent and stick with your plan. The plan was to buy early on a move up and stay with a sustained move. June 22 was also an early buy and sell when it held flat. Monday was an early buy and sell on the reversal. Tuesday was a double, which paid off nicely if you made the effort. Honestly, it’s not always worth the effort.
Next week I will again be watching to go long SOXL, but the markets are still at the high end of their range so it’s best to be ready to short as well with SOXS, SQQQ or UVXY.
Stay safe!
Update to Fri. July 14: The roller-coaster continues! Being ready to buy SOXL on Monday paid off again this week, and again, it wasn’t easy to stay on for the full ride, +21.2% at the high early Friday, more if you sold on Tuesday and then re-bought later in the day.
On Thursday, it was clear that Friday, July 14 could be a repeat of Friday, June 16 with the markets opening higher and falling. I still find it difficult to execute the trades, even with a plan clear in my head. A bit like scoring the goal when it’s clear in your head but still has to be executed.
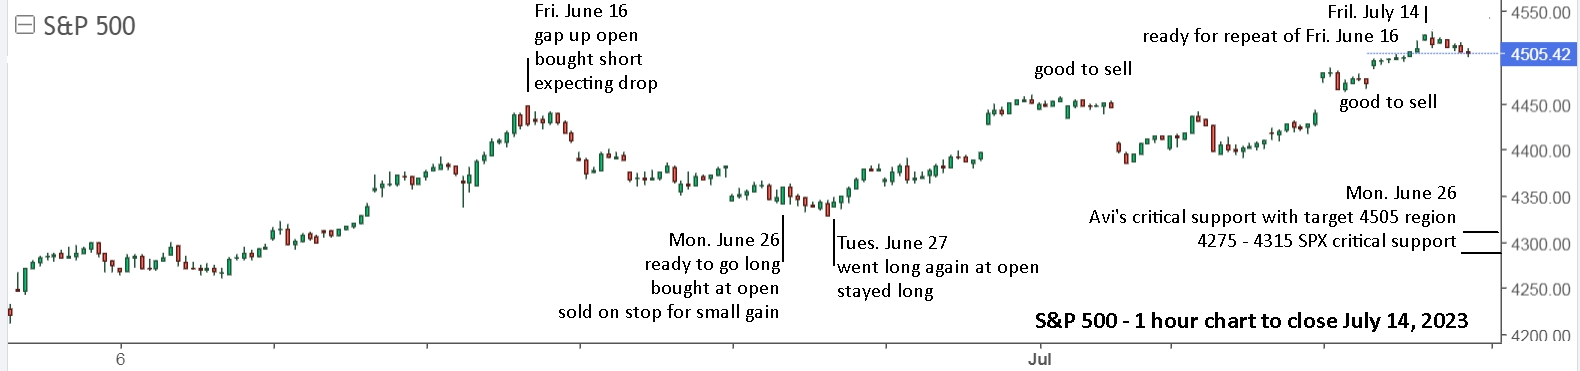
Needless to say, the markets are due for another pullback, and logically more than the mild dip in June. That said, ‘logical’ isn’t a term that normally fits the markets.
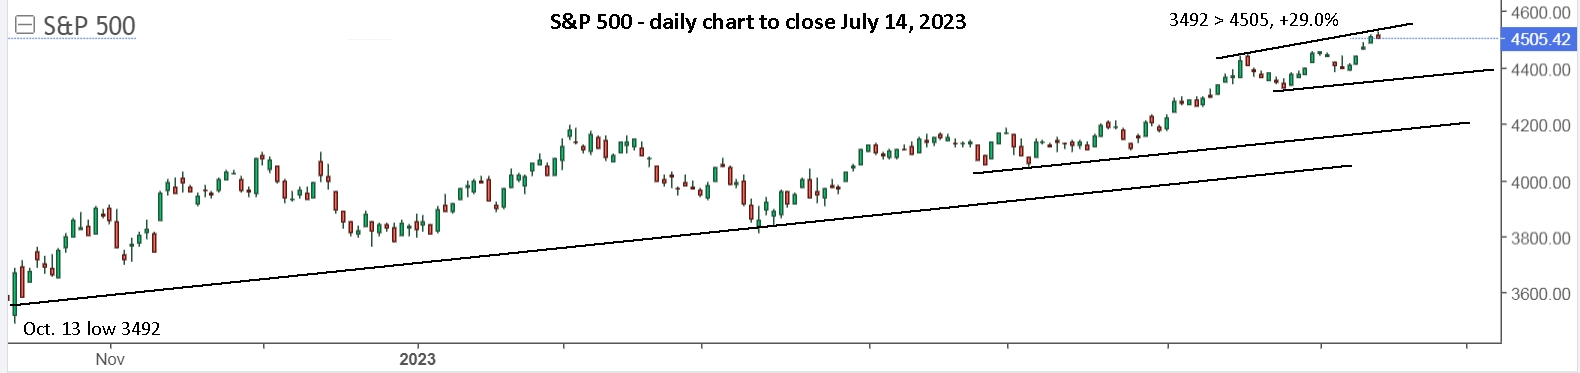
If you’re not trading actively and simply holding SPY, then set your stop sell for $440, a mere 2.2% drop from the current level and locking in a gain of 26.8% from Oct. 13. Making some effort with SOXL gave you a similar return in the last 7 trading days.
The Nasdaq is similarly stretched again and for those holding QQQ, you’re up 45.6% since buying Jan. 6 and best to set a trailing stop 2-3% lower and enjoy your summer.
An important lesson for those shorting the markets, is to time your entries well and don’t hold if it goes against you. On May 25, JC wrote, “SOXS (3x bear ETF) can only be employed VERY short-term tactics (usually February, June, September) ~ 4 weeks maximum duration for profits, on account of bear ETFs being notorious in time decay.” Despite this, he’s still holding SOXS bought June 7 and 14.
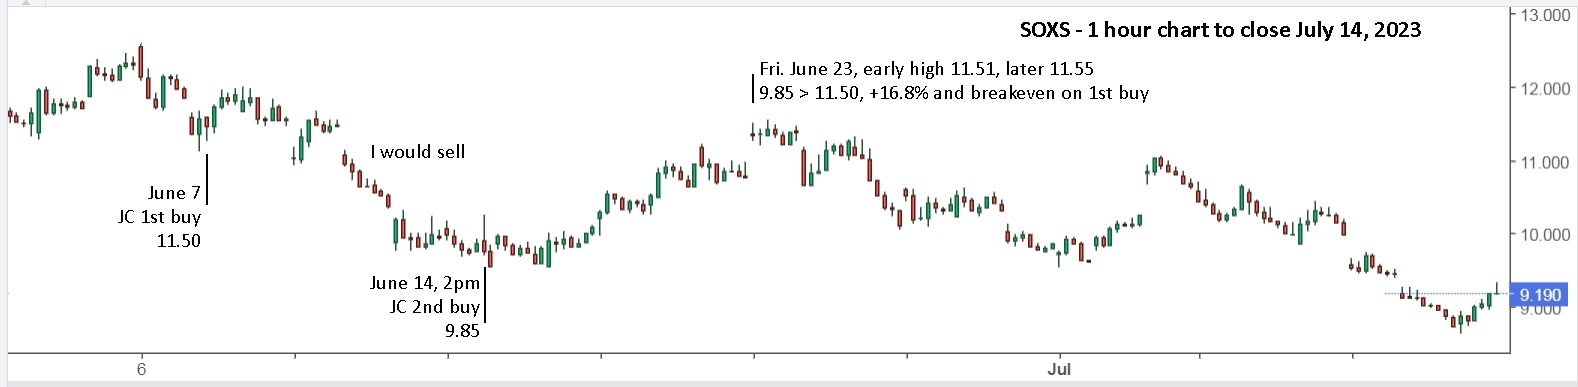
He is very confident in his system and given the current market levels, I’m sure he will eventually sell both buys for profits. I hate going underwater with a position so prefer to be more proactive. Holding a short ETF for a loss also means you missed holding the long version for a profit. In this case, SOXL for a gain of 26.7% in 7 trading days.
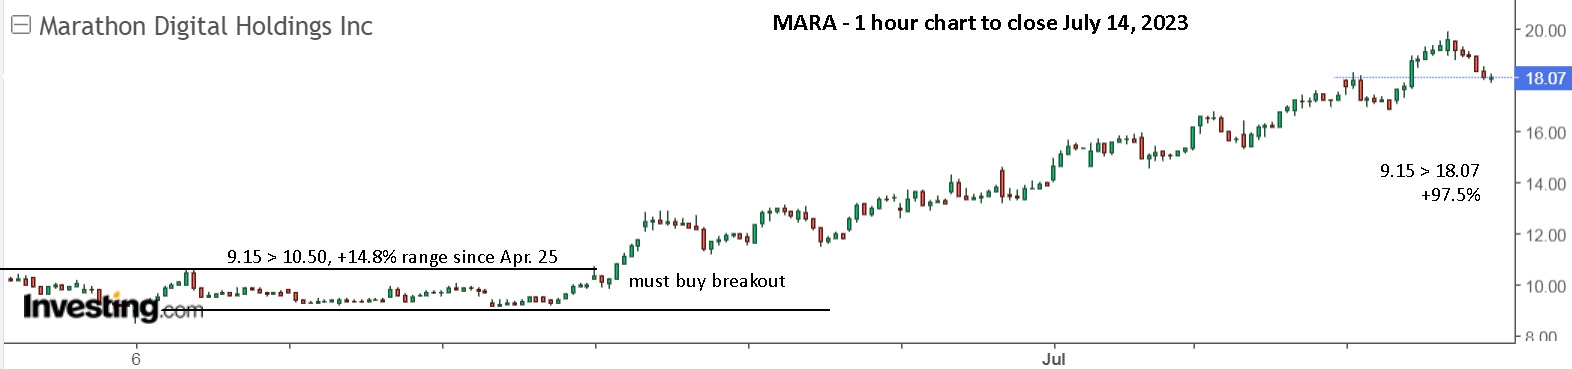
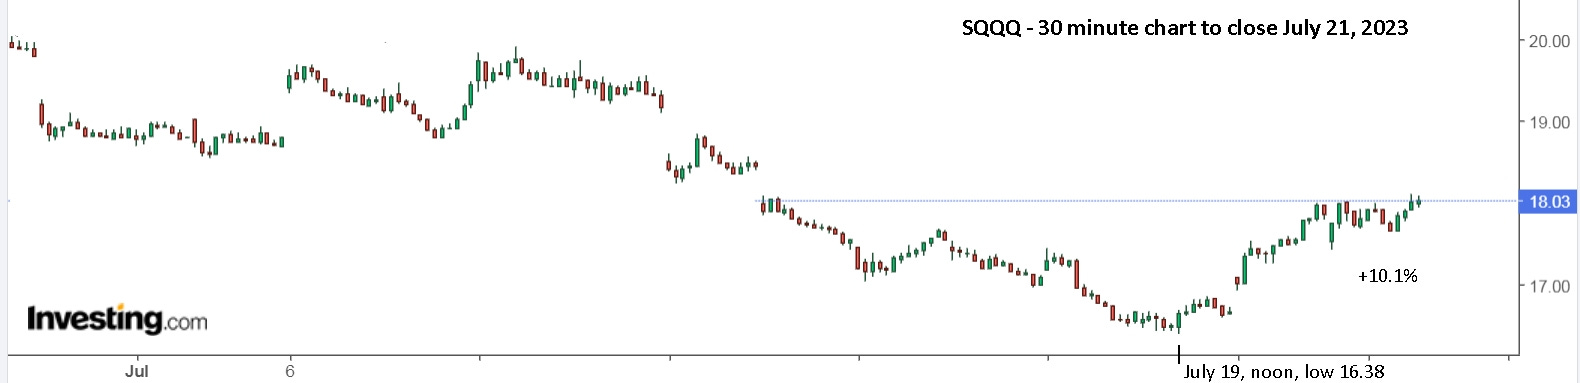
SQQQ is also down since Greg and JC bought in June. Not significantly, but their money was parked going nowhere instead of jumping on another opportunity, like bitcoin, with MARA up 100% since holding a horizontal 10% trading range of $9-10.
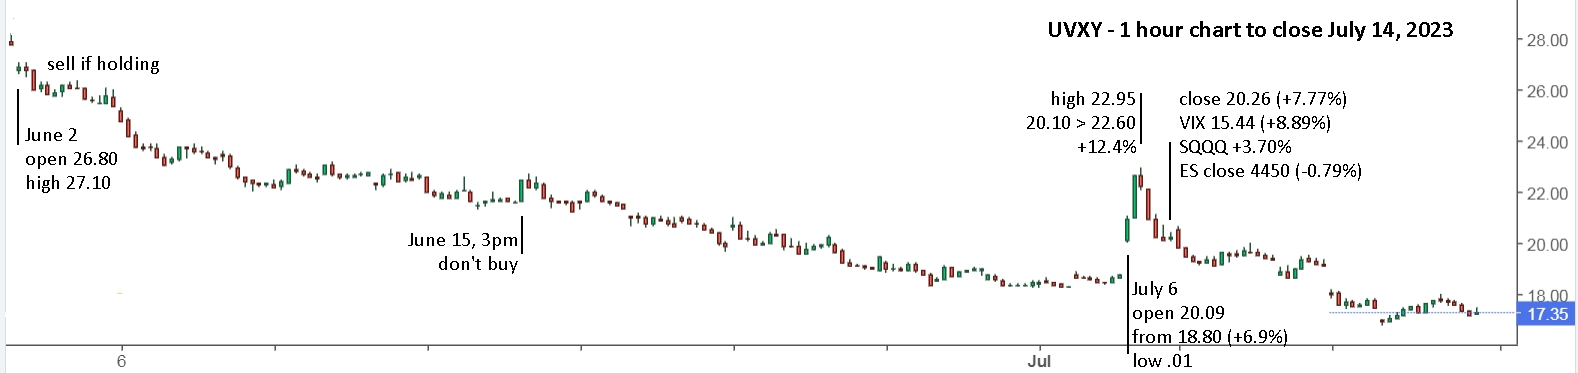
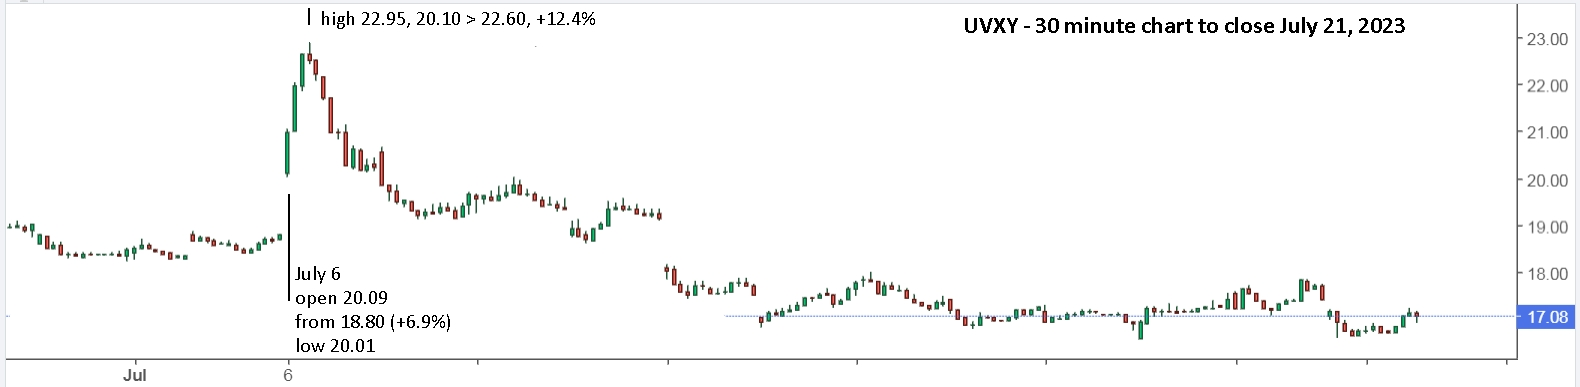
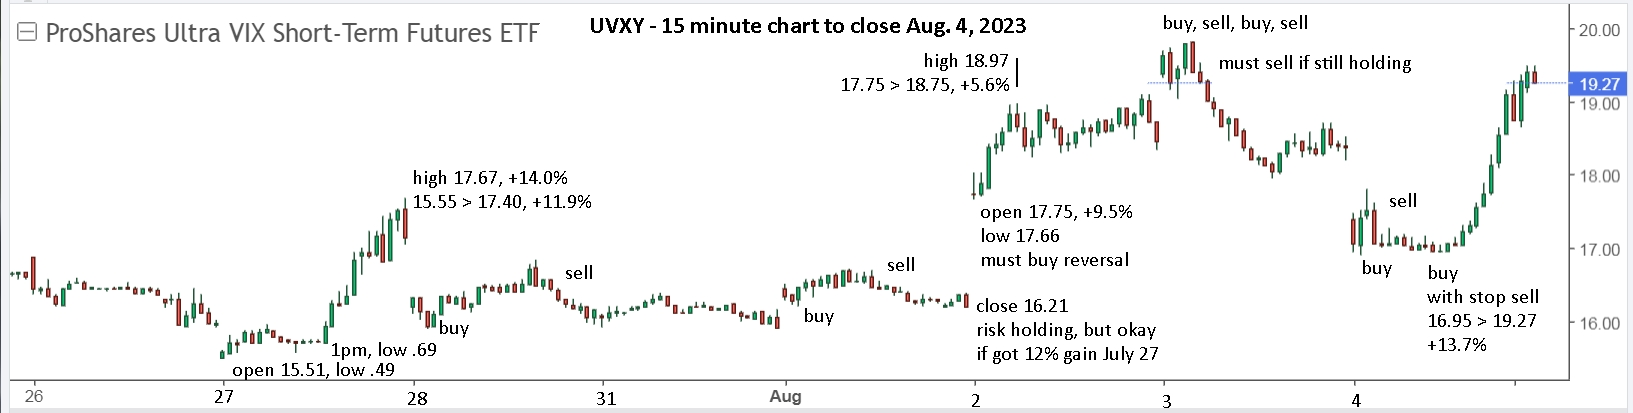
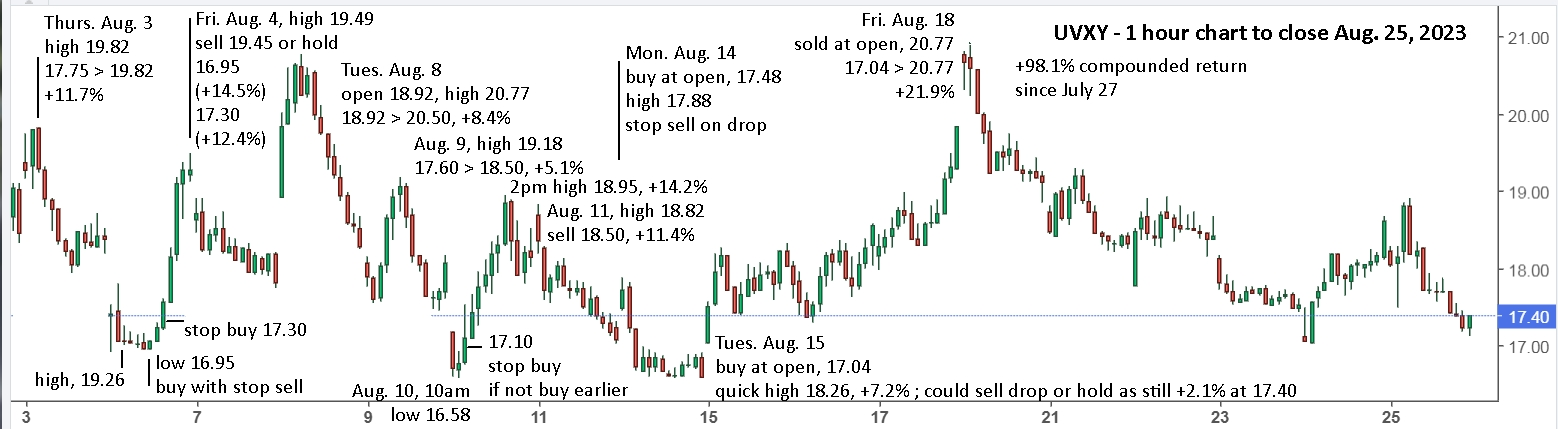
The other short trade, UVXY, has also been in a slow slide lower but had one 2.5 hour blast for +12.4%. This was a very unusual move with the markets not making a severe move. Simply following the set strategy of buying early with a stop had you on board for the ride.
I chose to hold PSQ for Monday and small positions in SQQQ and SOXS. If they open lower, then I’ll watch to buy more or sell if it drops. As before, stay safe!
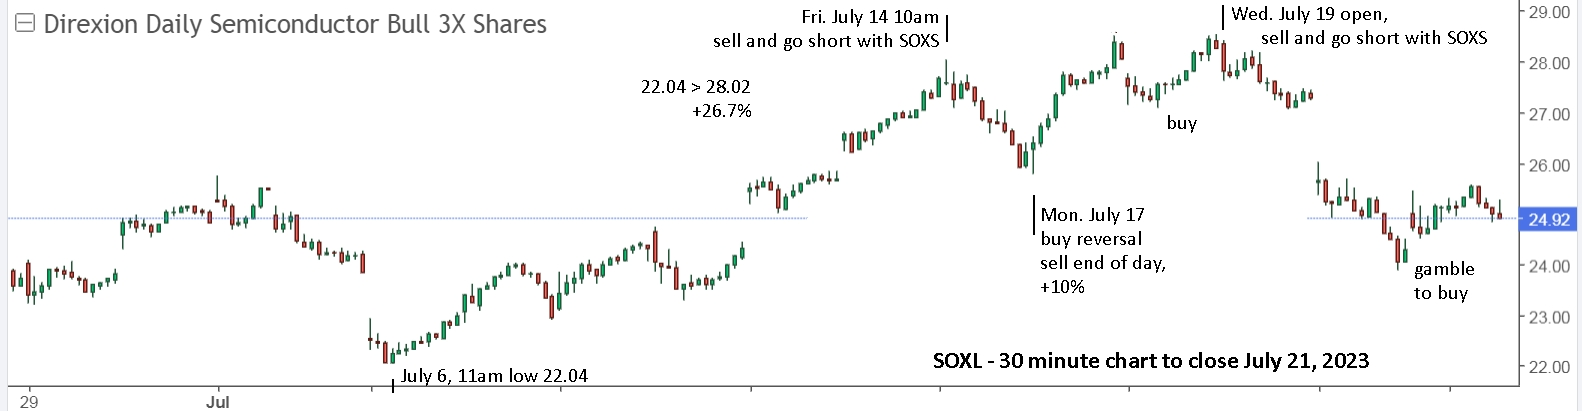
Update to Fri. July 21: “The roller-coaster continues! Being ready to buy SOXL on Monday paid off again this week.” That’s what I wrote in last week’s update and the exact same comment applies for this past week. SOXL moved up 10.7% from the early low to the high. I closed my SOXS for slightly more than I could have Fri. July 14 and closed SQQQ and PSQ for slightly less. After such a run on the day, I sold SOXL late and Tuesday provided a smaller repeat performance. Knowing that prices are really stretched, going short early on Wednesday should have been easy. Again, buy early with a stop sell if it goes against you. Buying SOXL late on Thursday was a reasonable gamble, but a gamble none the less. Buying the low on Friday and holding over the weekend is also a gamble.
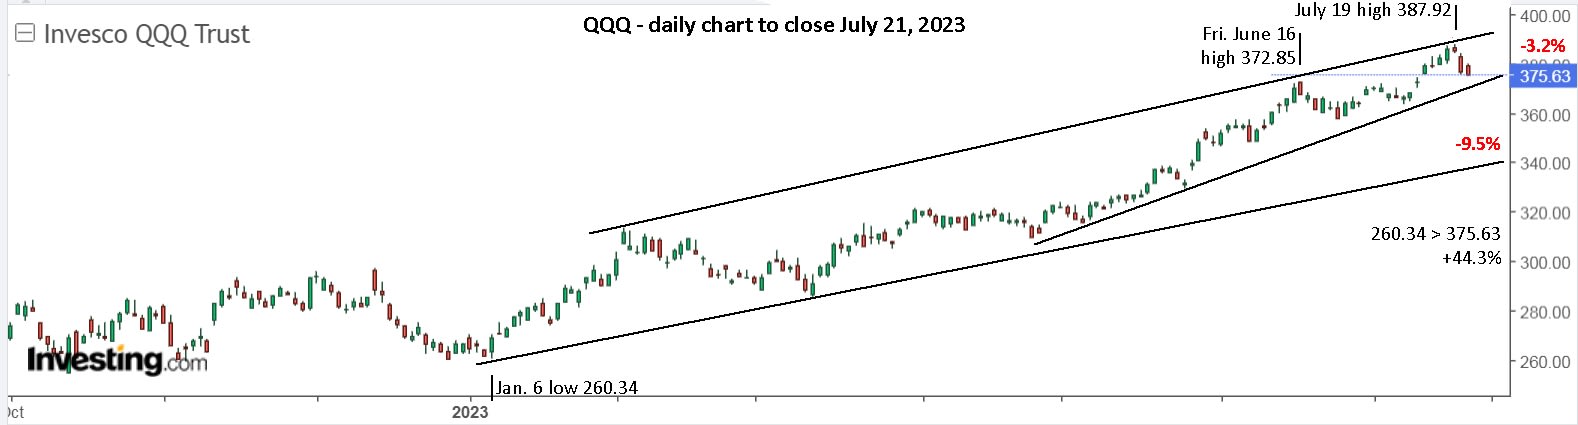
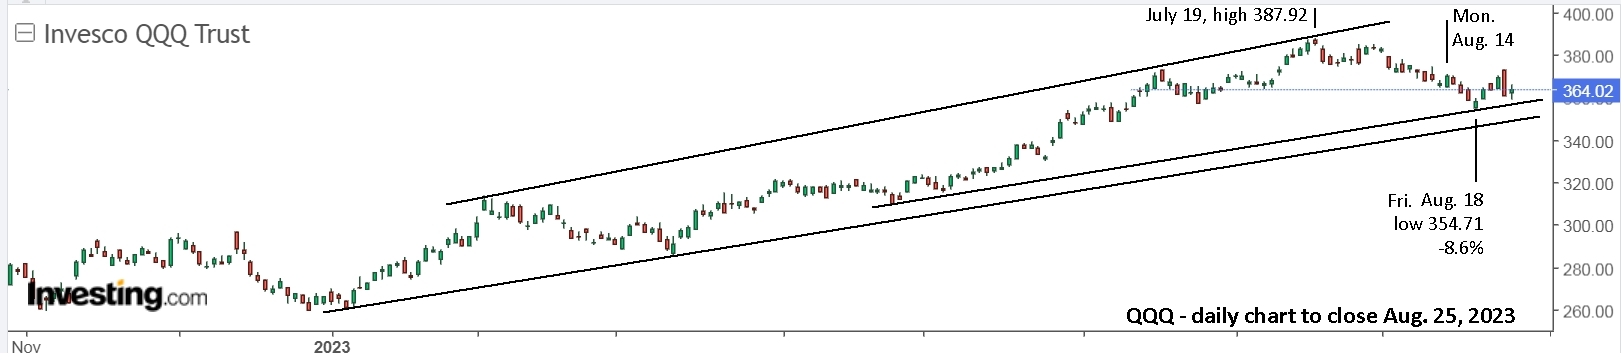
The high of 387.92 on Wednesday is just 5.4% below the 2021 high of 408.71. I’ll be surprised if that’s not surpassed this year, but I wouldn’t be surprised if it falls back to the lower support line. That’s potentially a 9% drop from the current price. No problem if you already sold Wednesday and avoided the 3.2% drop.
Last week I wrote, “If you’re not trading actively and simply holding SPY, then set your stop sell for $440, a mere 2.2% drop from the current level and locking in a gain of 26.8% from Oct. 13. The Nasdaq is similarly stretched again and for those holding QQQ, you’re up 45.6% since buying Jan. 6 and best to set a trailing stop 2-3% lower and enjoy your summer.” I would have sold both on Wednesday (SPY $456, QQQ $387.50). QQQ closed Friday -3.1% from 387.50 (Wed. high 387.92), so you should be out and should be out on Thursday at 380+. You can now set alerts at 368 and 380 and wait to see what happens. If you’re still holding SPY, up your stop sell to 445 or 450 and continue enjoying your summer.
If you don’t believe there will be a large pullback, then perhaps you don’t want to play the short side with SQQQ or PSQ, but it is still important to sell your QQQ so you don’t hold it through a 10% drop, decide not to sell then with it holding support and then not sell when it breaks lower for a further drop of 20-30%. You hopefully learned that lesson already in 2022.
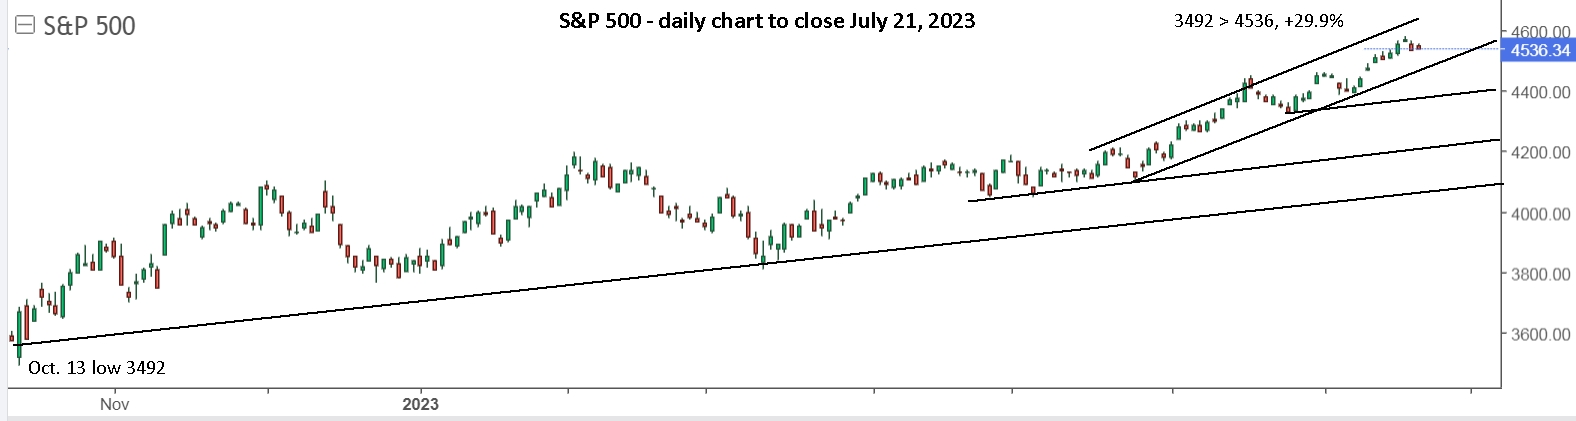
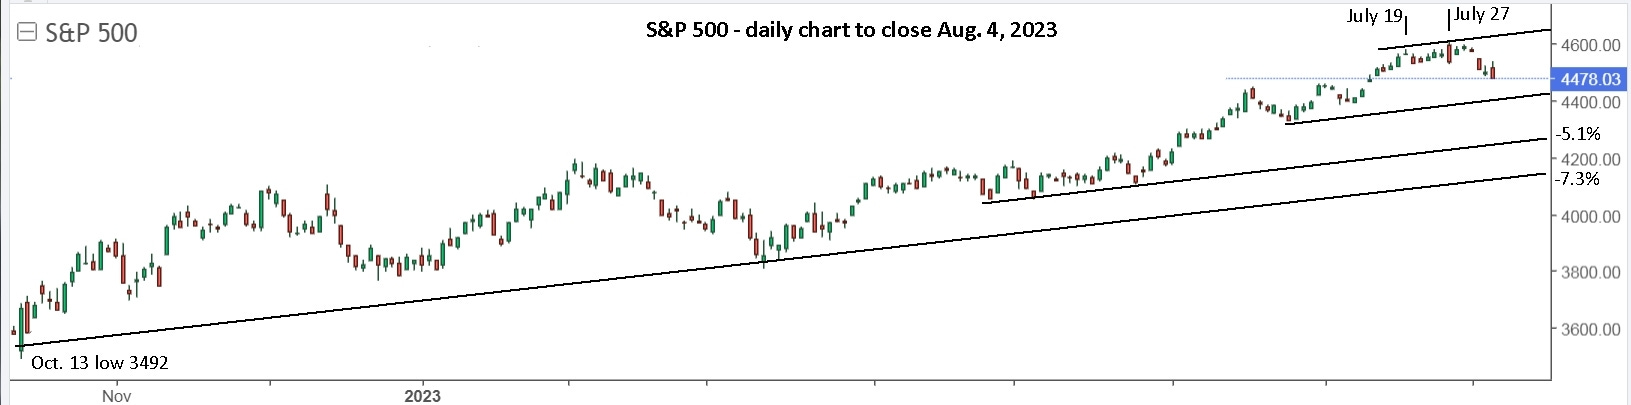
Similarly with the S&P 500 (and anything else), so long as it stays between the lines, you’re okay. If it hits or breaks the upper line, be ready to sell and go short. Then you can buy when it hits the lower support line, or before if it reverses, but always be ready to sell again if it continues lower. There is potentially a large drop coming so you don’t want to be long when that happens.
For those who want the extra reward potential of going short, it’s wise to be patient and late, than early. Sometimes it’s easier to simply sell your long and wait to re-enter.
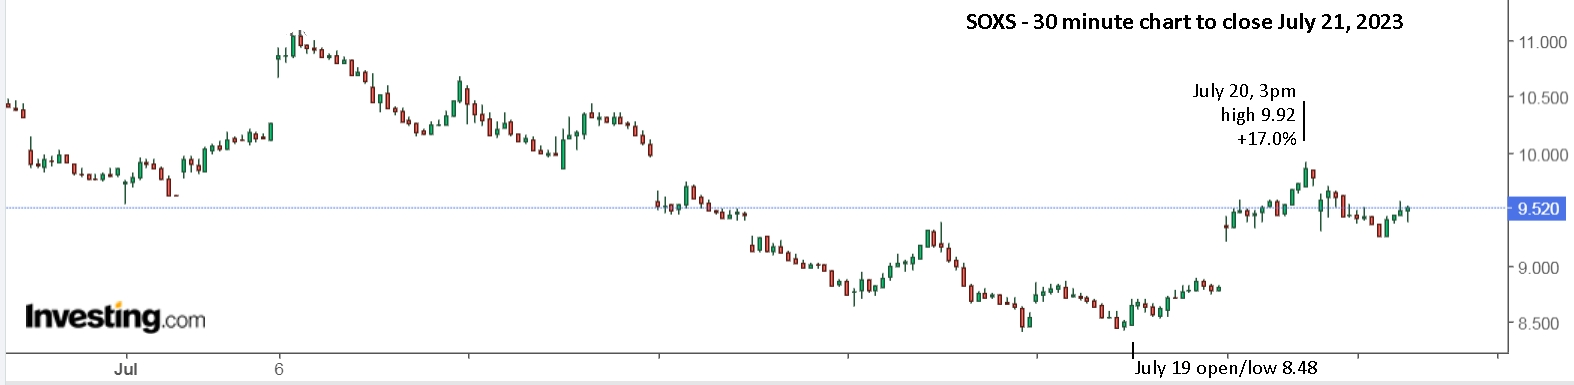
Much to my surprise, JC made a third purchase of SOXS on Friday at $9.26 (1/2 of 2 batch). I really don’t understand why he didn’t buy Monday or Wednesday at $8.50 but he follows his system and it works. Knowing that he’s short should add to our caution, but I’m still watching SOXL for trades, and knowing JC missed the last 26% move, provides confidence that our strategy is also working. Good luck next week if you’re watching the markets, and enjoy your fun activities if you’re not.
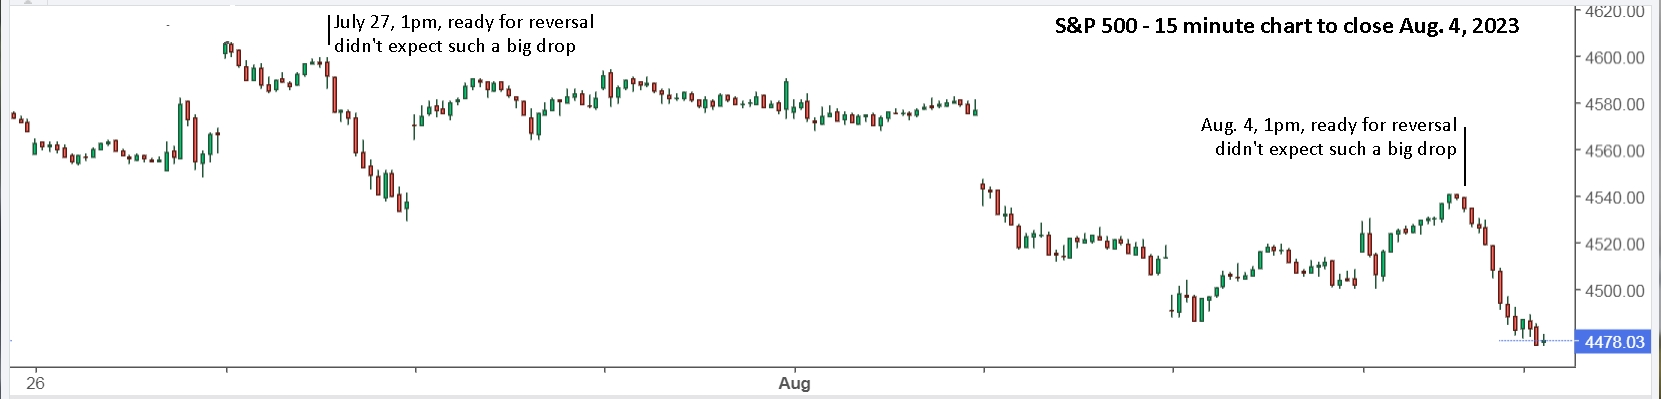
Update to Fri. Aug. 4: The markets finally made a sudden and ‘surprise’ drop on Wednesday this past week. I write ‘surprise’ since it was unexpected from the day before, even though we’ve been expecting a drop from upper resistance since July 19.
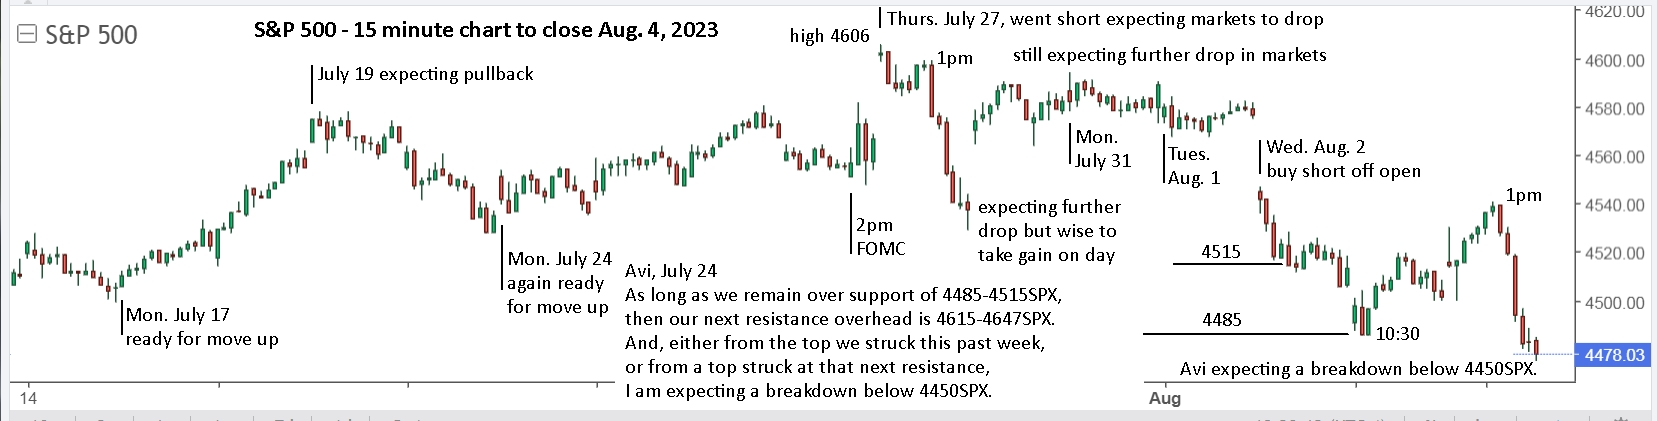
Thursday, July 27 gapped higher and fell hard on the day, which was ‘expected’. Gapping higher and holding up on Friday, July 28 was rather surprising. With the markets moving up on Friday, August 4, following through on Thursday’s reversal, I was expecting a general continuation. Like July 27, somebody flipped the switch at 1pm, opening the trap door, and down they went. Remembering the gap higher July 28, I sold my shorts and headed to the sidelines for the weekend.
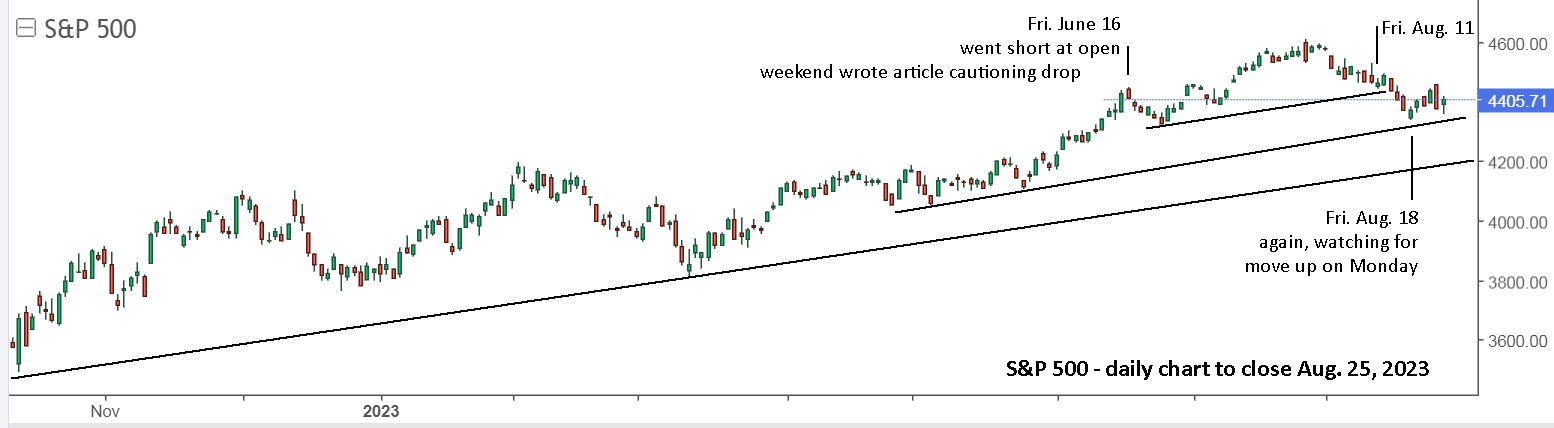
Avi’s targets given July 24 have been quite accurate and helpful. His support range of 4485-4515 was broken late Friday, so next week may produce his expected breakdown below 4450SPX. Interesting that it matches our highest support trendline and it could drop an additional 5-7% to the lower support trendlines.
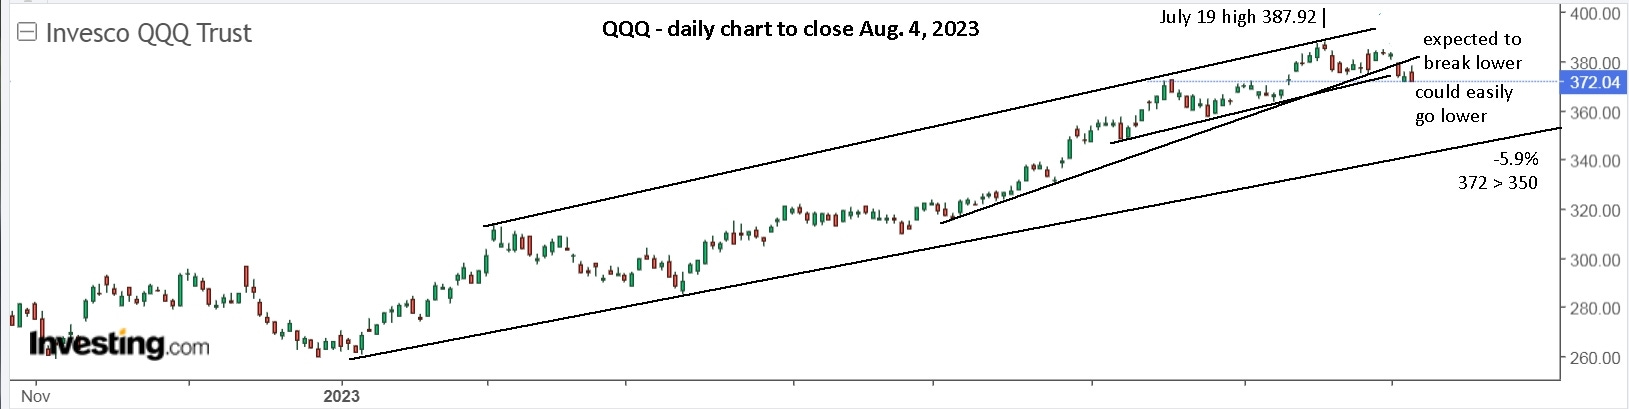
QQQ also has plenty of downside left before reaching support, but it could also head higher next week. The 1pm hard reversal on Friday really opened up the downside risk, but it could also gap open higher on Monday, like it did after the July 27 drop. Shorting the market with SQQQ has provided gains, but not easy trades. Staying on the sidelines and enjoying summer activities was a great option.
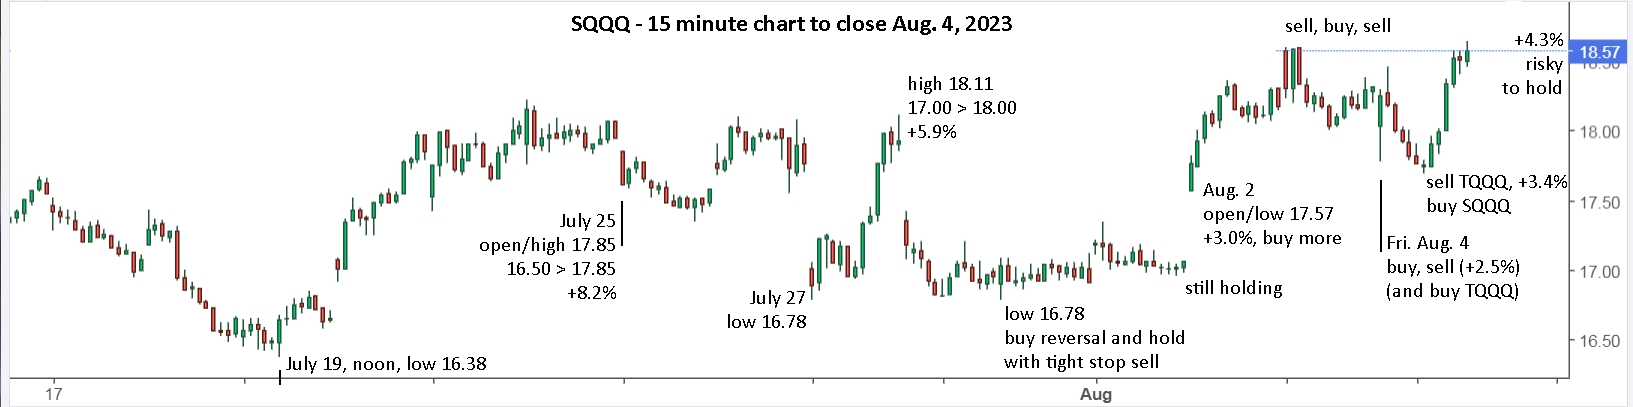
In the chart above, you can see that it ‘made sense’ to be ready to buy SQQQ and catch the 1pm reversals on July 27 and August 4. After all, we’re expecting the markets to drop. For me, Fri. Aug. 4 was more difficult since we’d gotten a drop and they had pushed up steadily after the early bounces. I really don’t understand how entire markets can drop on cue at 1pm but clearly large buyers simply decide when and when not to step up and buy. Or maybe it’s the algos combining to create the situation. I really don’t know, but I do know that it’s usually possible to ‘see it coming’ and position oneself accordingly. I sold my SOXL and bought UVXY and SQQQ, with stop sells and buys to switch back if I was wrong.
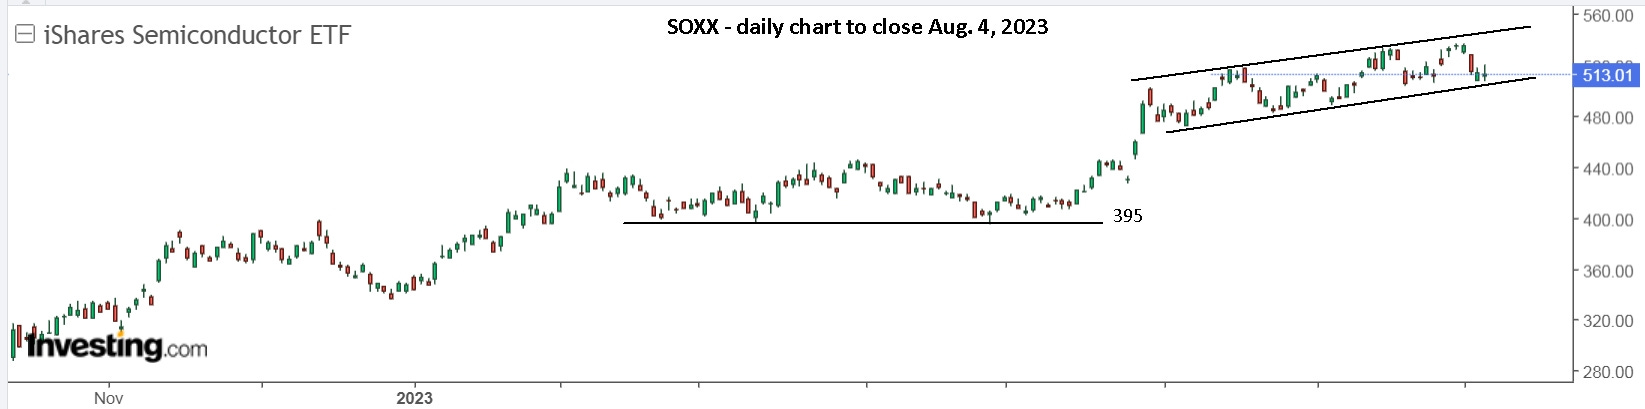
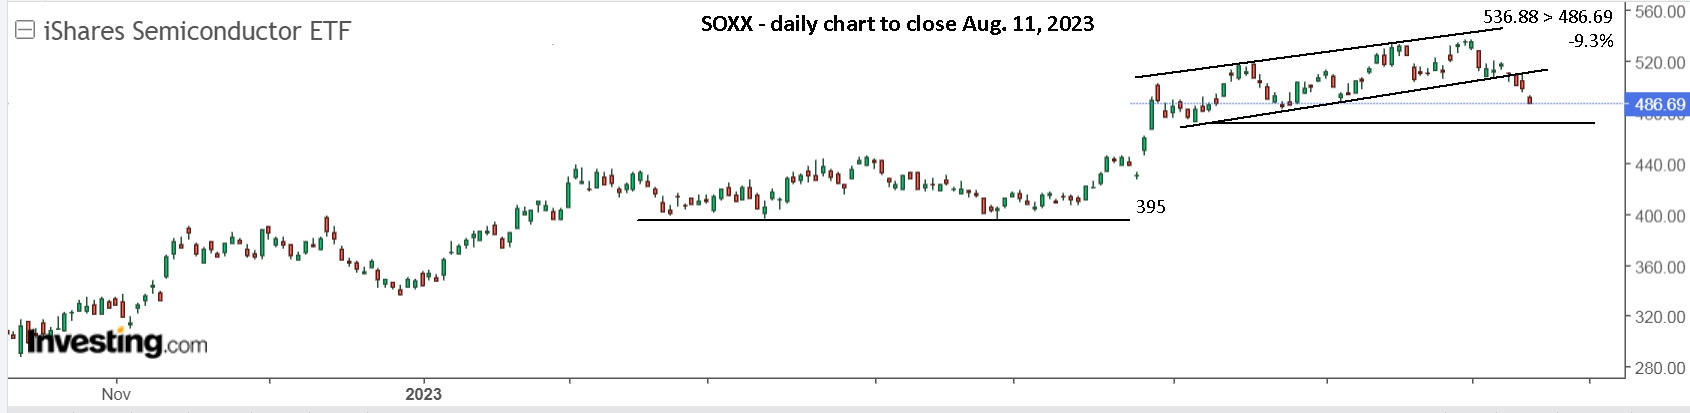
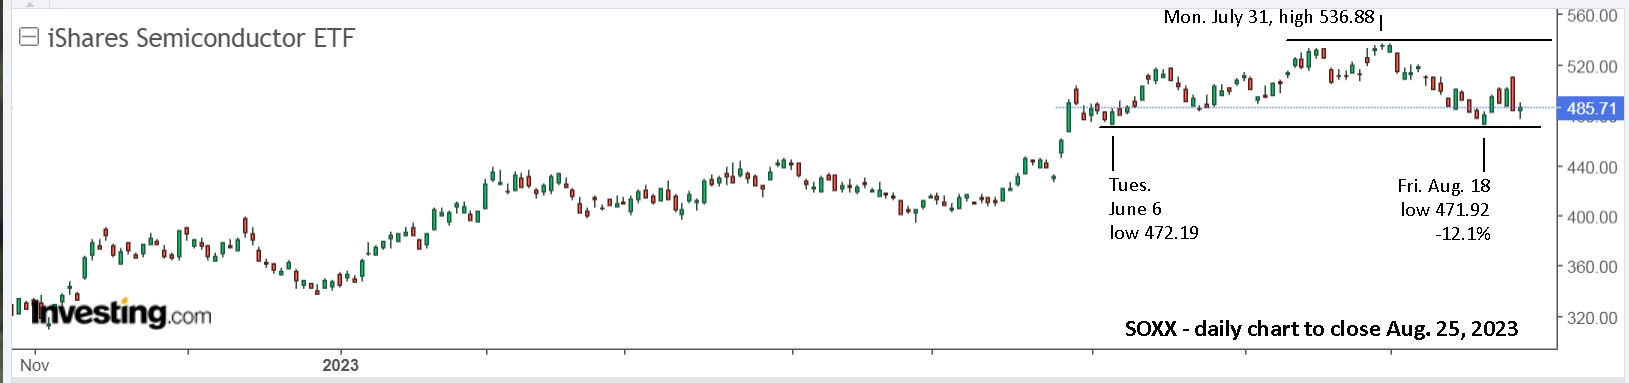
Semiconductors, SOXX have been moving rather differently and are back to support, ready for another potential trade with SOXL.
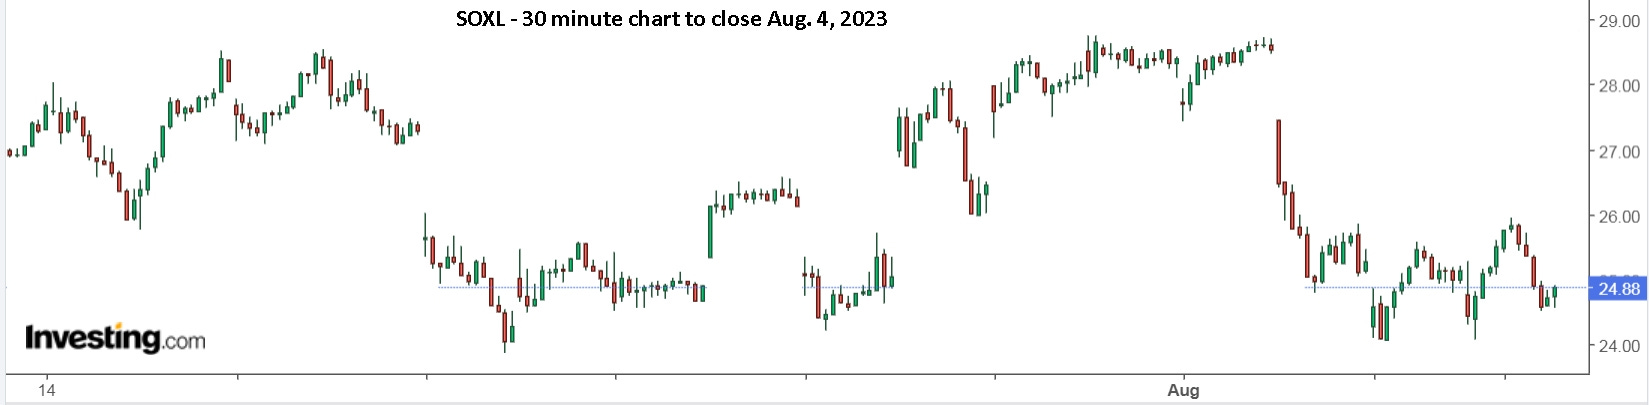
SOXL hasn’t been an easy trade either with its large gaps. Taking gains over the range and not expecting more has been profitable and could continue. Next week, simply watch to buy low when it stalls and begins to reverse. If it gaps higher on Monday, buy if it moves up and keep a tight stop and be ready to switch to SOXS. I prefer to jump in and out during such ranges until a break occurs in one direction or the other. JC is now up to 4 buys with SOXS and expects it to move higher.
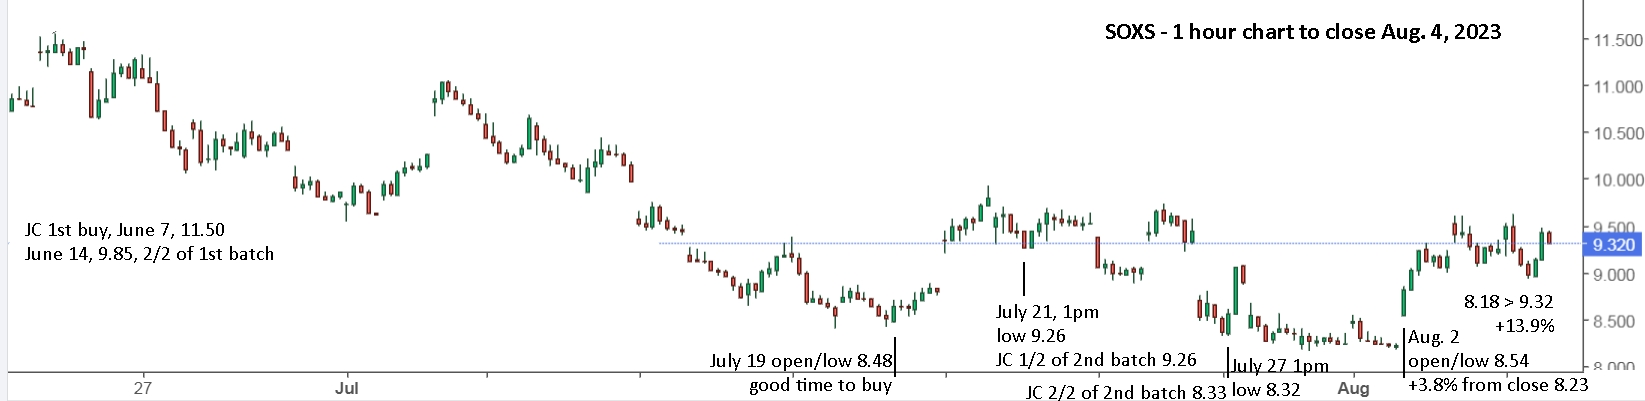
A move to 11.50, back to his first buy, would be a terrific gain if you waited to buy at 8.50 on July 19, sold the next day at 9.90 (+16.5%), took a trade with SOXL and bought SOXS again at 8.20. Clearly, next week could have it going in either direction, so best to remain patient and jump on opportunities as they come.
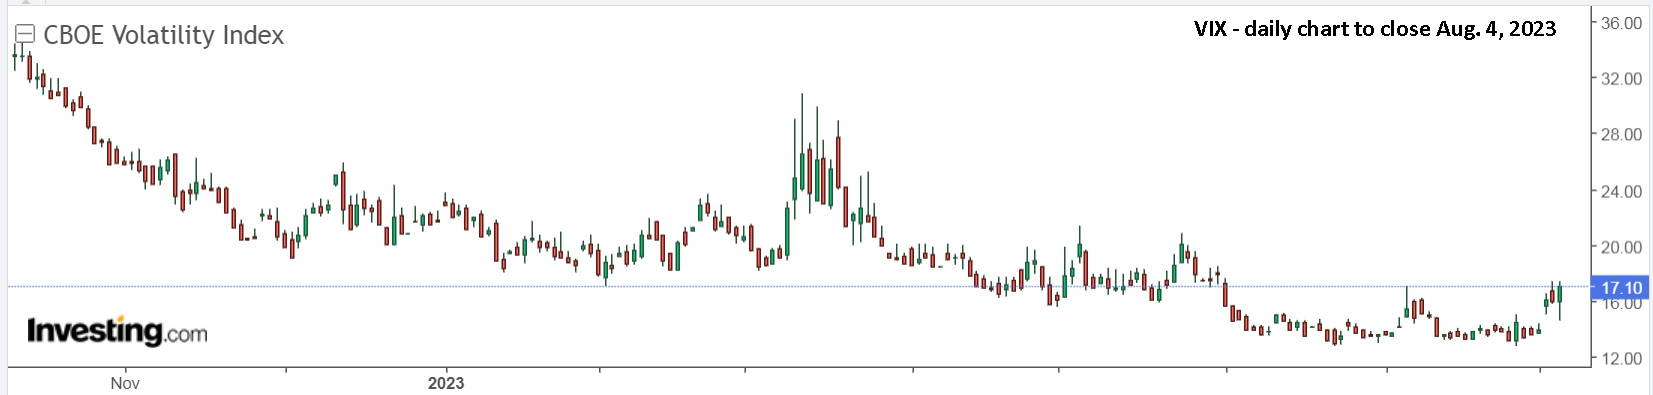
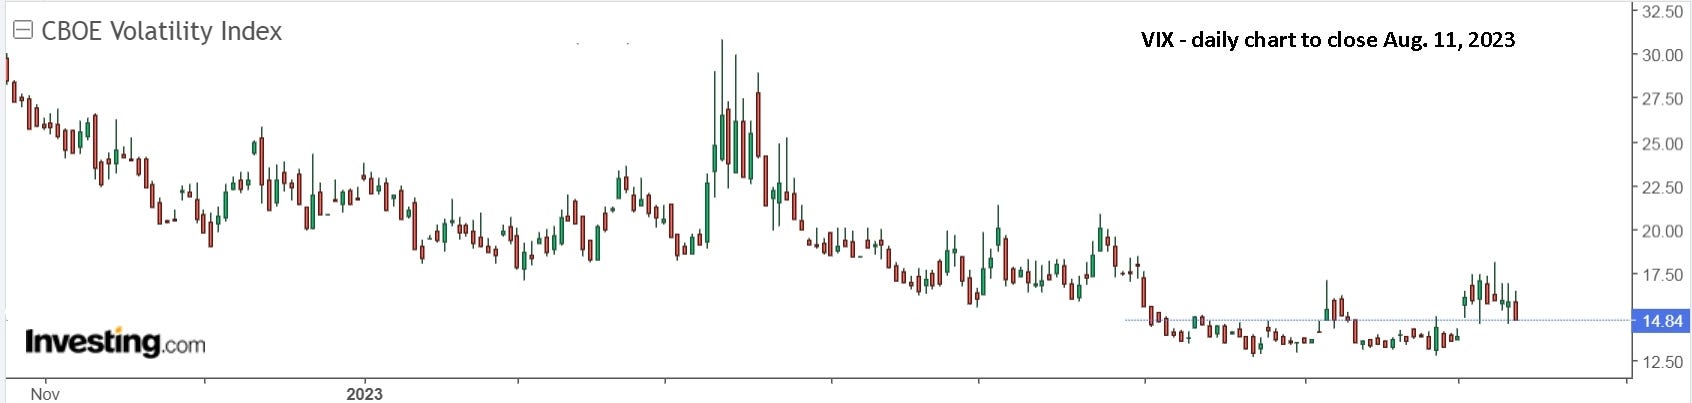
UVXY showed a lot more life last week, finally, and might be the optimum trade next week as well, if the markets drop. That said, VIX is back to 17 and could easily fall back to 13. It all depends on what the markets do. And remember, when the markets do finally crash, VIX will pop to 30-40 minimum and potentially up to 80+ so you want to be ready to cash in your UVXY lottery ticket then.
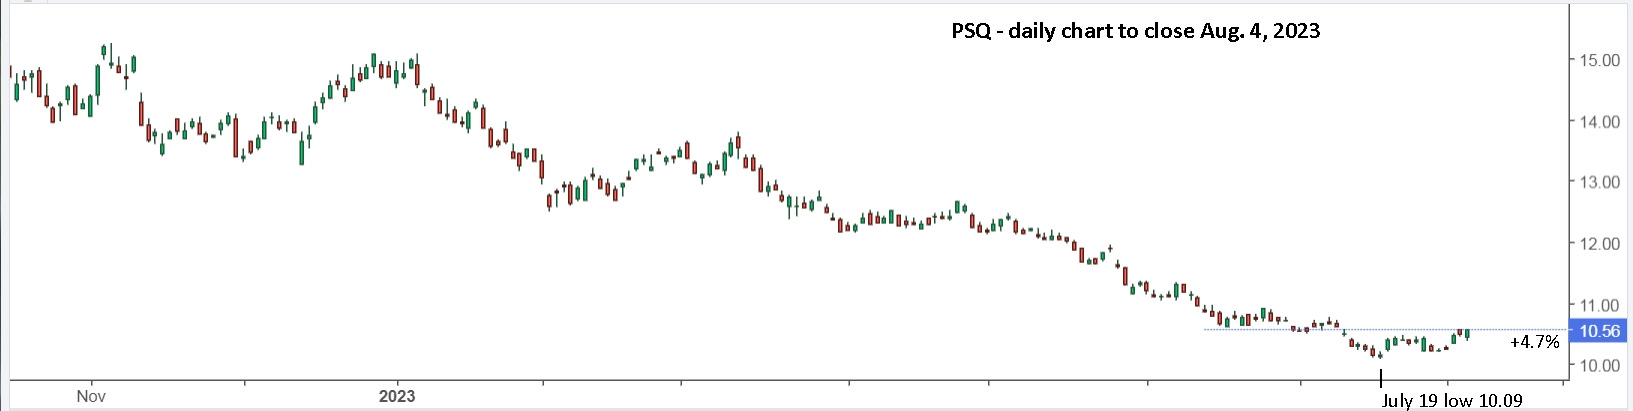
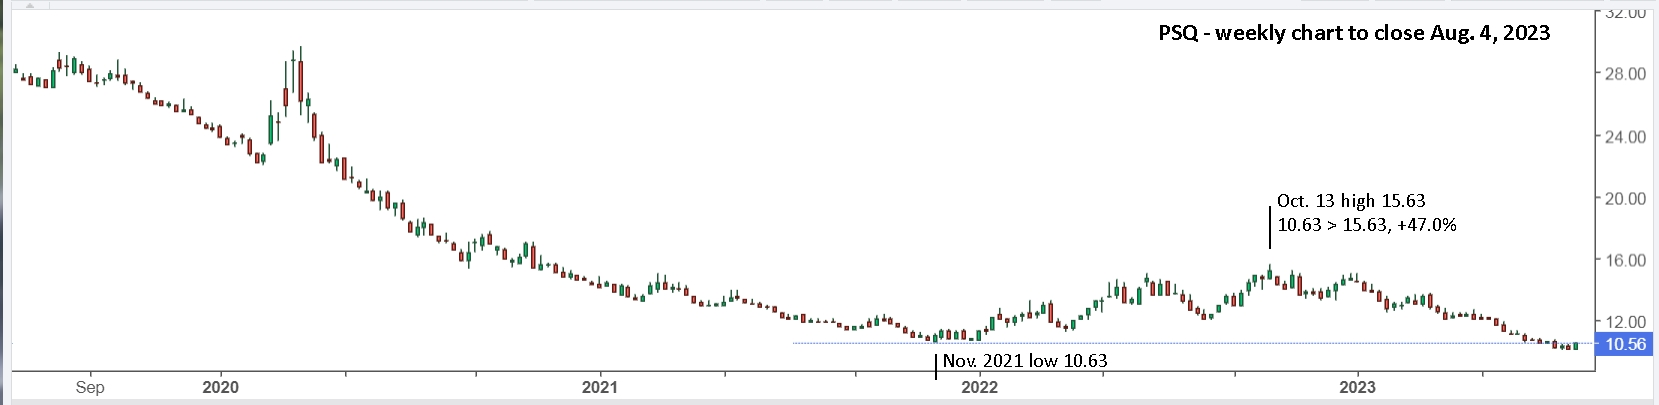
For those wanting a slow, low maintenance way to short the market, PSQ is a good option. As said before, you don’t want to be early and a gain of 4.7% from the July 19 low is nothing to write home about, and simply being out of QQQ with alerts set to buy might be the better option. That said, a gain of 47% with PSQ from November 2021 to October 13, 2022 is pretty darn good for a slow, low maintenance way to short the market.
Update to Fri. Aug. 11: The markets continued sliding lower despite showing occasional rallies. The S&P 500 has now touched the highest support trendline. Will it rally from there, like it did from June 26, or will it continue lower? I have no idea and will be ready for either outcome. Its drop of 3.1% is very mild compared to -5.6% for NDX/QQQ and -9.3% for SOXX, semiconductors. Still, it’s so much better to be safely on the sidelines already and even better to have locked in gains with short positions.
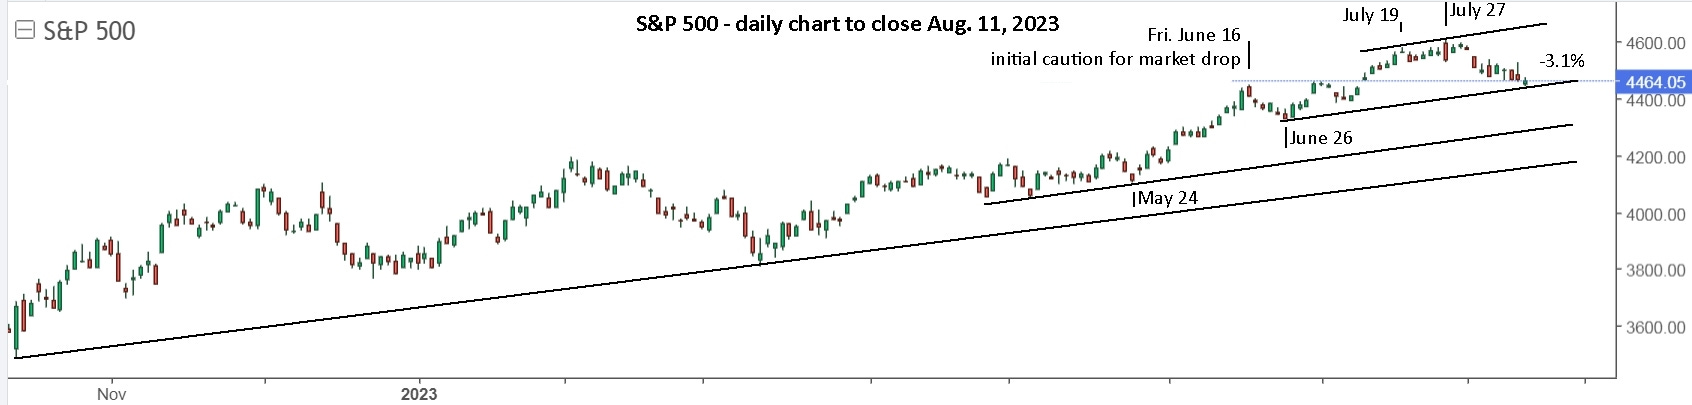
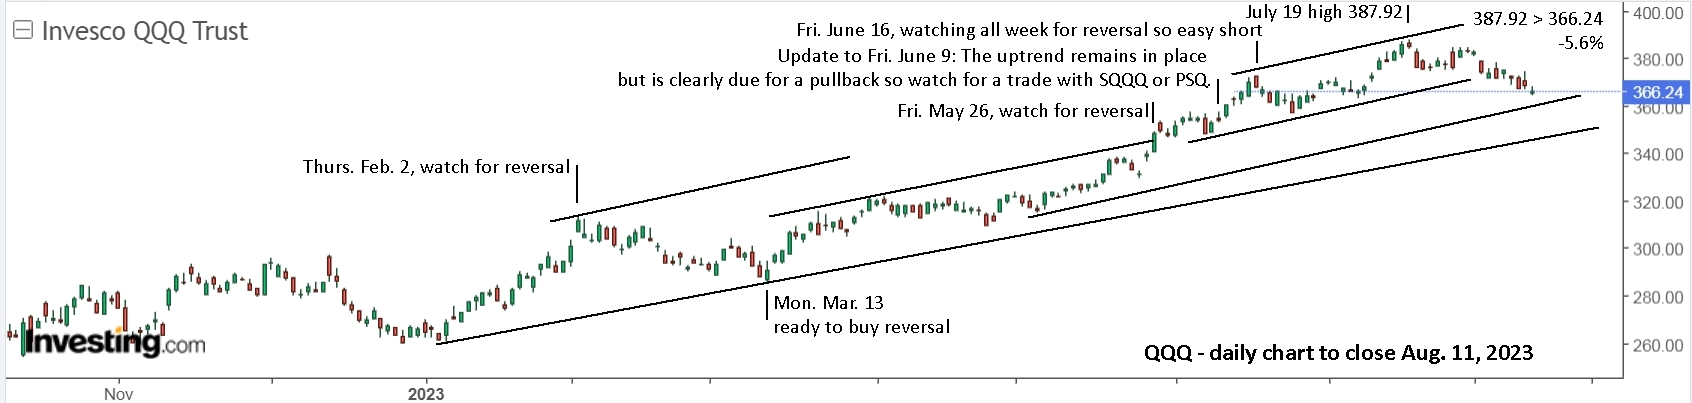
It’s useful to note that, from the simple trendlines, you first went on alert for a reversal after the strong move up Friday, May 26 when it broke through the upper resistance trendline. On the following Monday, it gapped higher and fell, a perfect time to hit the exits and go short. When it held and rallied on Wednesday, that was the “all clear”, and the previous resistance line now became support. It was tested a week later, held and in my update to Fri. June 9, I wrote: “The uptrend remains in place but is clearly due for a pullback so watch for a trade with SQQQ or PSQ.” From the gap higher on Friday, June 16, it should have been easy to sell and buy short. I mean, you had the ‘drill’ on Monday, May 29, just 3 weeks ago, when you were watching for a reversal, it gapped higher and fell.. You then also had a clear support line to let you when it was “all clear” again. It dropped near support on Monday, June 26, then gapped higher and rallied on Tuesday, signalling “all clear”. By July 19, it was again clearly time to be watching for a pullback. The fall from that high continues to date and may be approaching support (depending on how you draw your lines), but the bias is still clearly to the downside. As always, be ready for a move in either direction.
The power of simple trendlines is also clear in the SOXX chart.
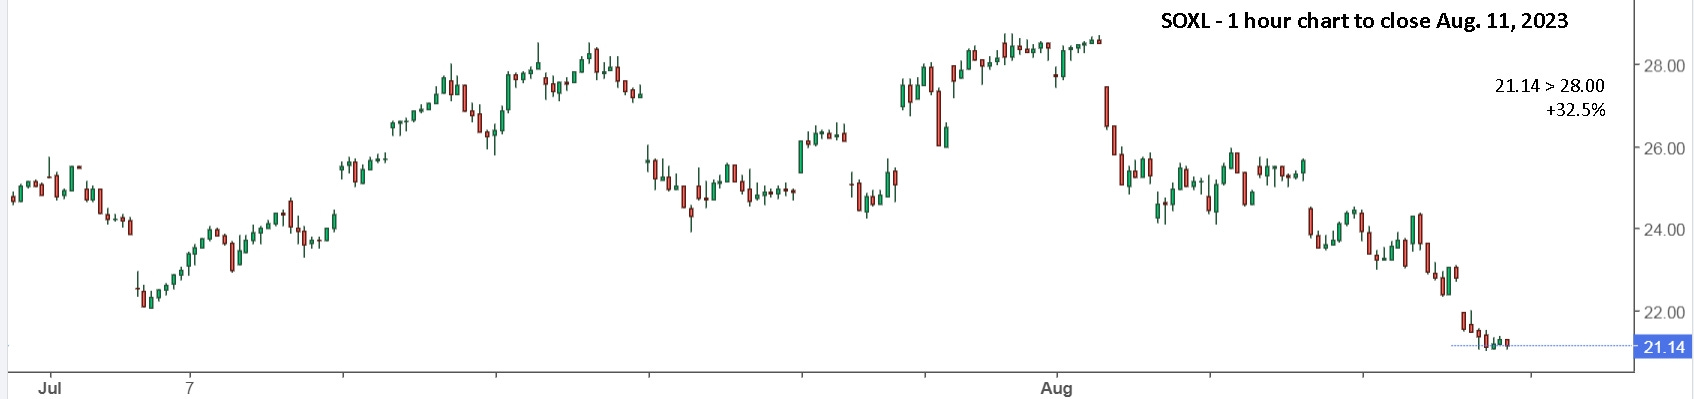
JC closed out 3 of his 4 SOXS buys for good gains (+28.4% in 2 weeks, +10.9% and +17.7% in 8 weeks). He’s still holding his first buy at 11.50 and he made his first buy of SOXL 1/2 of 1 batch $21.45. I don’t like to hold shares in both directions but I would have sold the first 2 SOXS buys on June 23 at 11.50 for +16.8% and break even.
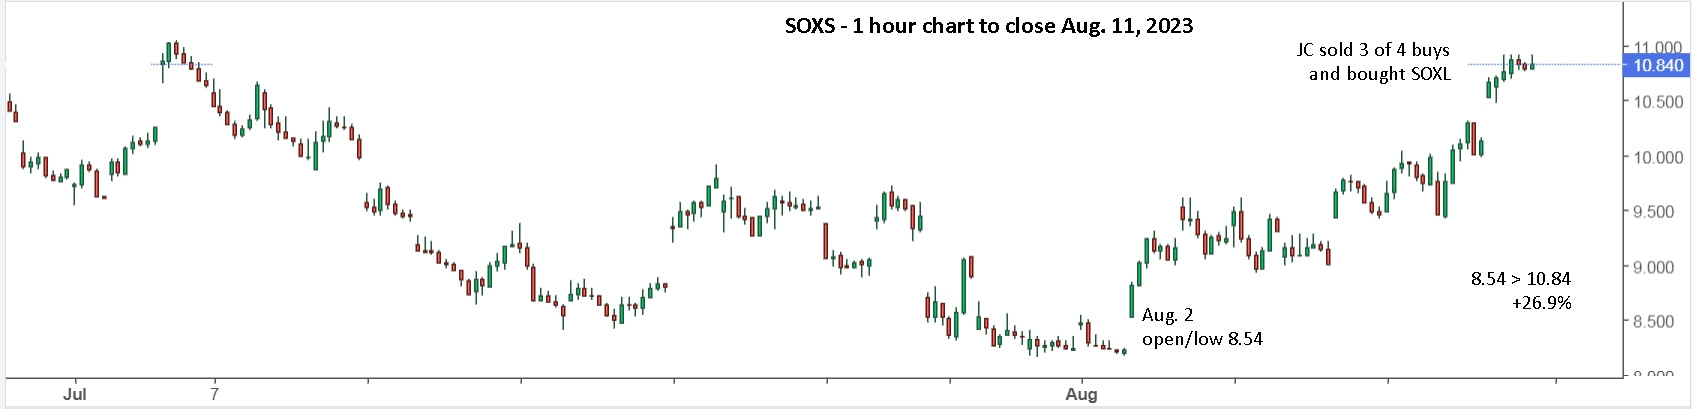
The SOXX chart above shows there’s more downside to reach the horizontal support, so I’d stay cautious buying SOXL. Locking in gains with SOXS on Friday certainly made sense, same as it made sense to sell SOXL July 31 or Aug. 1. Buying SOXS then was a gamble that paid off, but buying Aug. 2 at the open was nearly as good. Buying SOXL on Friday may turn out to be wise in hindsight, but buying on Monday will be nearly as good with 33% upside to get back to the Aug. 1 high. (SOXL gapped 3.8% lower Monday so gambling wouldn’t have paid off.)
Volatility is also set to drop if the markets are able to hold support. The VIX only hit 17-18 this past week, but there were good trades to be had with UVXY and cumulative compound return since July 27 is an amazing +71%! Remember that potential for future drops that are more severe, when +1000% returns are possible. In 2022, the compounded return was an even more amazing 40x. This is truly the game you (and I) need to learn to play well.
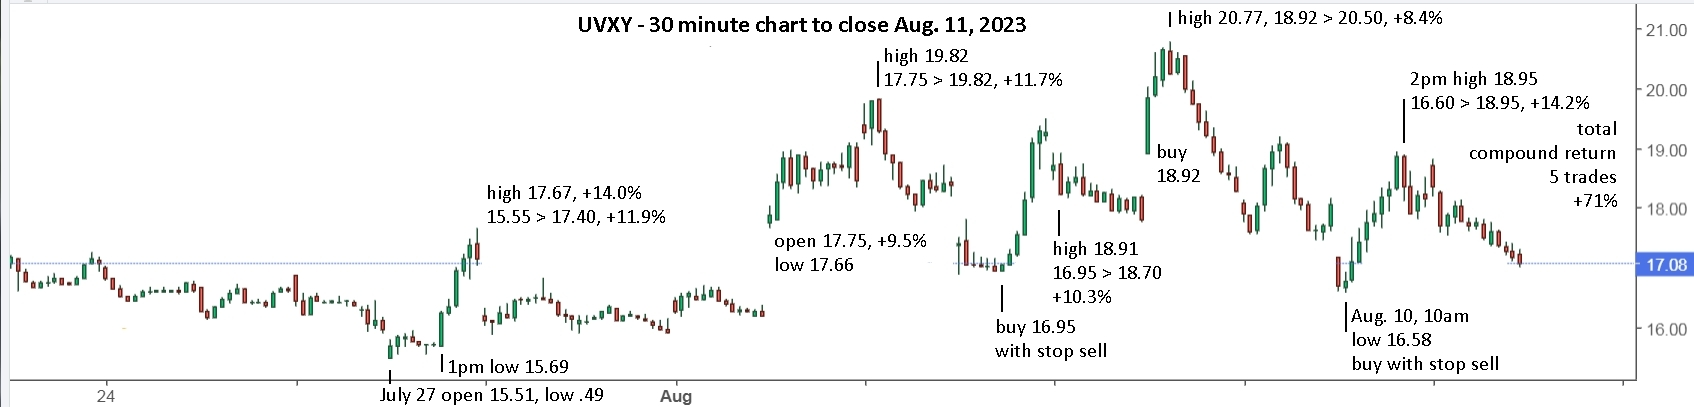
I’ll write an article soon with detailed thoughts on trading UVXY. For now, review what you did and didn’t do right the past 2 weeks since the July 27 wake-up call.
Update to Fri. Aug. 25: Here’s the link to my recent UVXY article, “Make UVXY your winning lottery ticket that keeps on winning.” From July 27 to Fri. Aug. 18 it made a compounded return of 98%.
With NVDA earnings and Jackson Hole now in the rear view mirror, and with markets holding above their support trendlines, there’s every reason for optimism and you may have cautiously started some long positions on Friday. Once again, waiting till Monday is by far the safest choice. If these lower support trendlines are broken, then there’s a strong chance of a much larger drop and perhaps new all time highs won’t be reached. They could also break support and then rally, but now is clearly a good time to remain cautious and aware that a decade long bear market may have started last year.
Update to Fri. Sep. 22: I have been cautiously bullish since the Fri. Aug. 18 reversal, but the bears took over this week. The prior week, I was ready and waiting for a drop after the CPI report on Sep. 13, or the PPI report on Sep. 14. Both inflation reports came in a bit hot, but the market shrugged it off and rallied. Then, on Friday, Sep. 15, with absolutely no news, the selling was relentless. This past week required more caution and after a fake drop and rally after FOMC, the markets dropped sharply to the close and gapped lower the next day and broke support. Friday opened up, rallied to 11:30, then lost traction and closed lower. Forget the news and how they spin it, giving reasons for the drop. It was clearly a possibility and the big money decided to make it happen. It’s that simple.
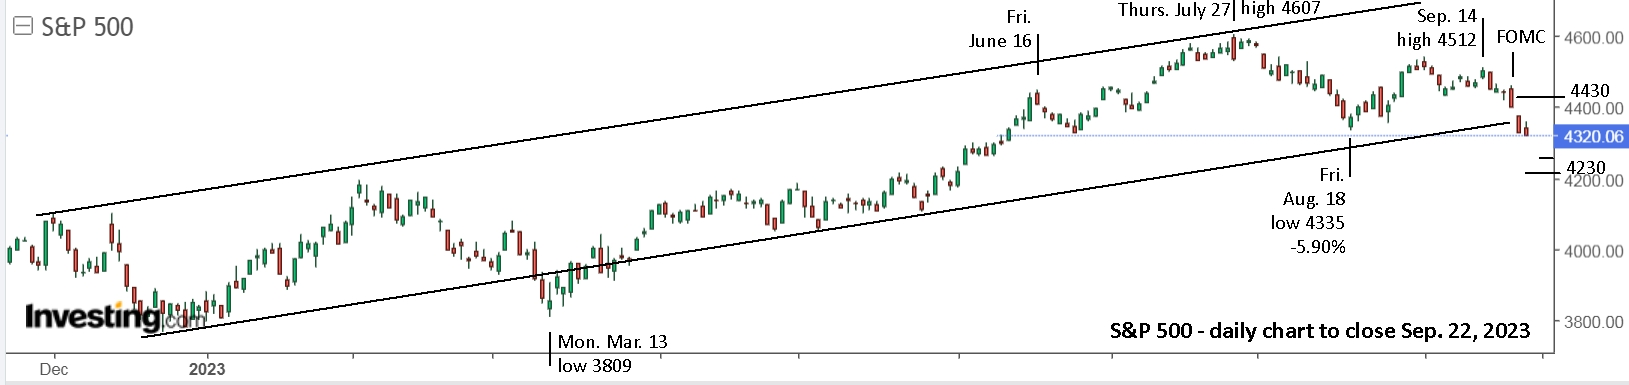
On Monday, Sep. 11, Avi wrote, “To put it very simply, our resistance is now 4486-4515SPX. (hit 4487 that day and 4512 Thurs, down hard Fri.) As long as this bounce is contained by that resistance, I will then be looking for a breakdown below 4430. Should we see a breakdown below 4430SPX, which then follows through below 4400SPX, that is a strong indication that we are going to be dropping towards the 4230-4274SPX region.” That’s some pretty amazing information to have in advance of the drop Friday, Sep. 15, and you knew to expect a further drop to 4430.
On Mon. Sep. 18, Avi wrote, “Will The Fed 'Cause' A Mini-Crash?” and commented on how the markets rallied on Wed. and Thurs. with bearish CPI and PPI data, then fell on Friday with no news. It made no sense at all, yet he practically predicted it. He also wrote, “I want to note that any break back out over 4512 before we break down below 4400SPX would open the door to rally towards the 4800SPX region sooner than I currently expect. Moreover, should we see that downside follow through in the set up I am outlining, then it will likely be blamed upon a reaction to the Fed this coming week.” Another amazing ‘prediction’ with the drop below 4430 coming after the FOMC announcement. The low on Wednesday was 4401 and closed 4402. Clearly it was likely to open lower Thursday, which sets up his next target of 4230-4274SPX region. That’s quite a bit lower from Friday’s close, 4320.
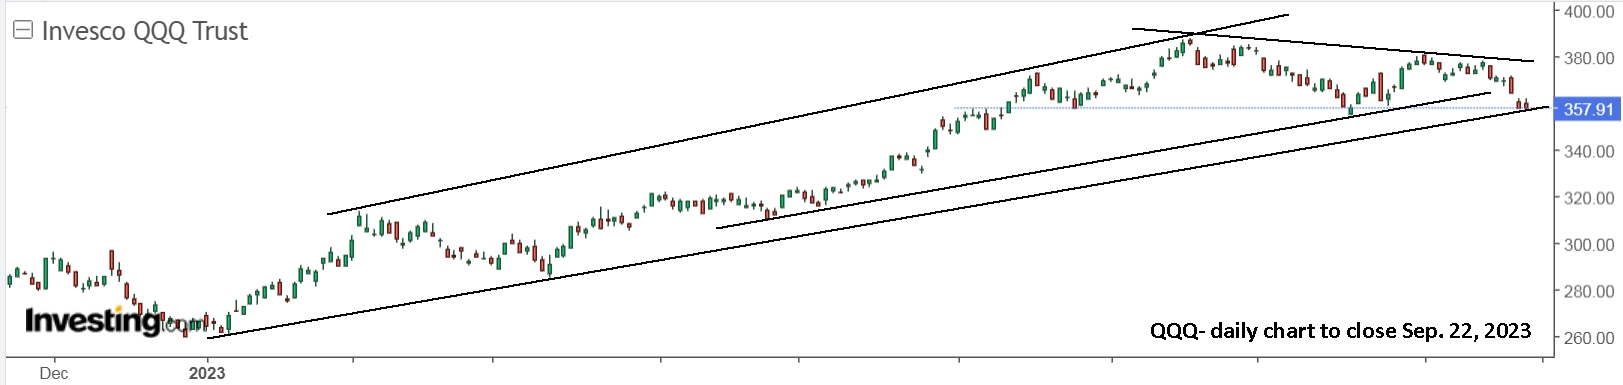
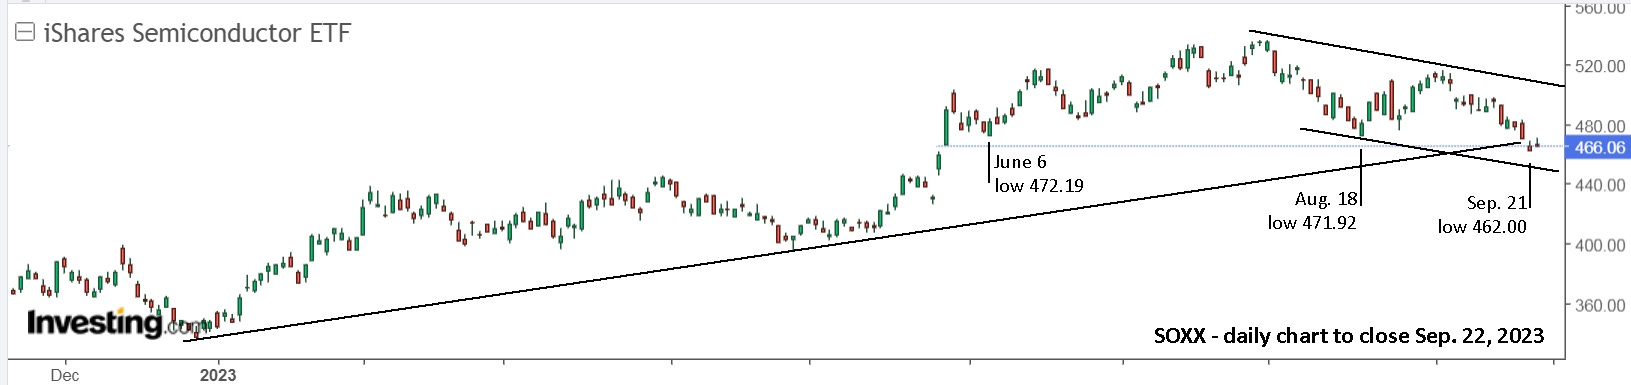
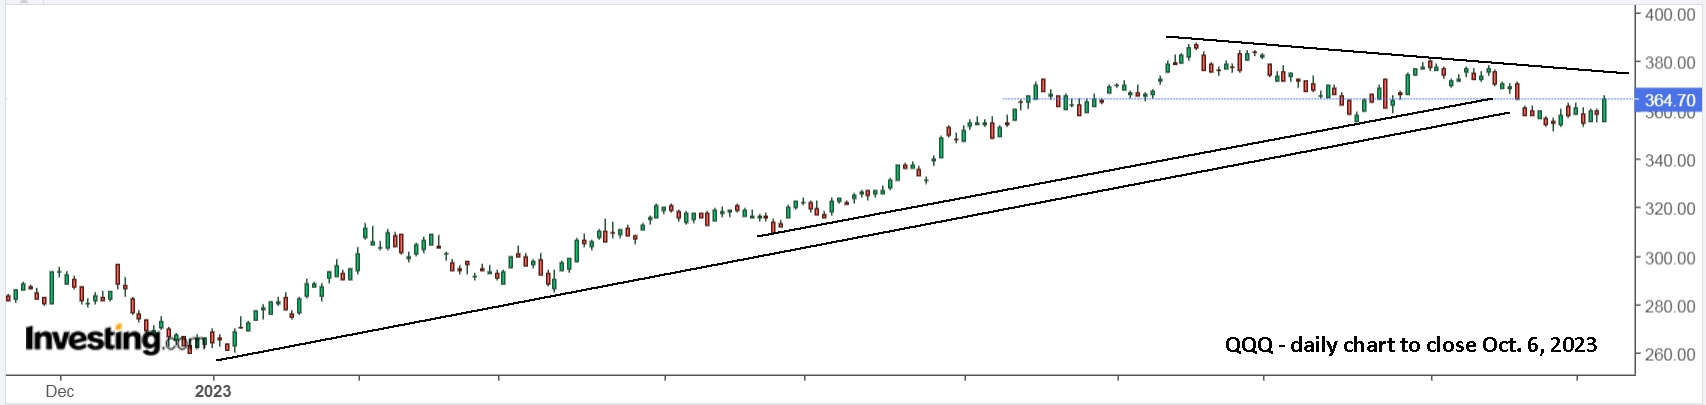
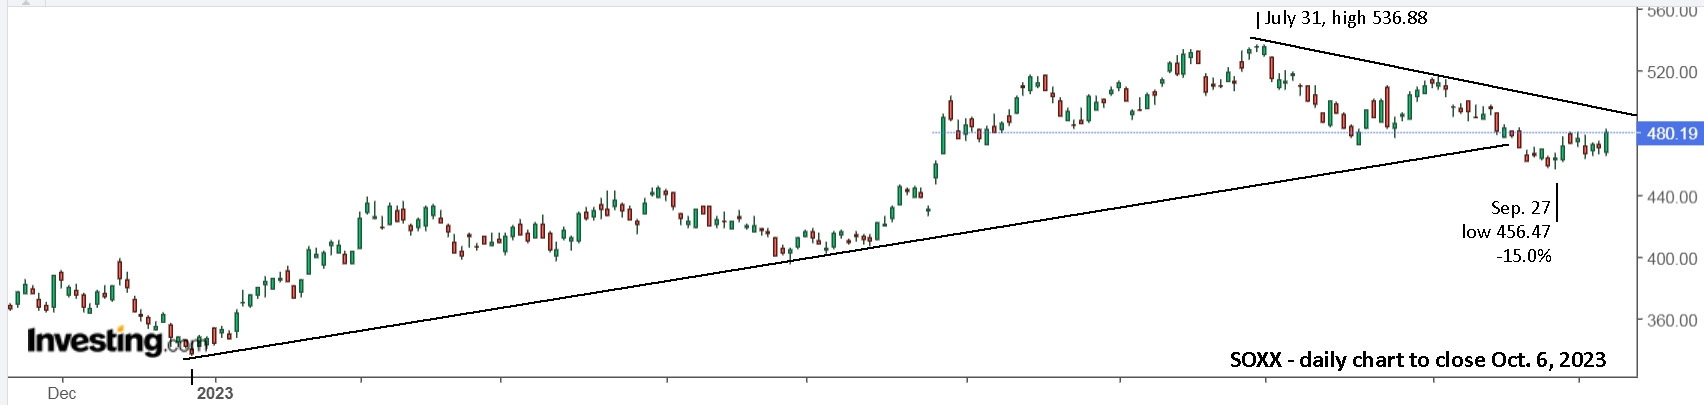
It’s still possible that the markets will rally to new highs after hitting Avi’s support targets. That would resemble the March break of support and recovery, but I wouldn’t count on it. Believe it when you see it. Until then remain in cash or short. QQQ and SOXX also broke support, albeit slightly. I suspect there’s more downside coming.
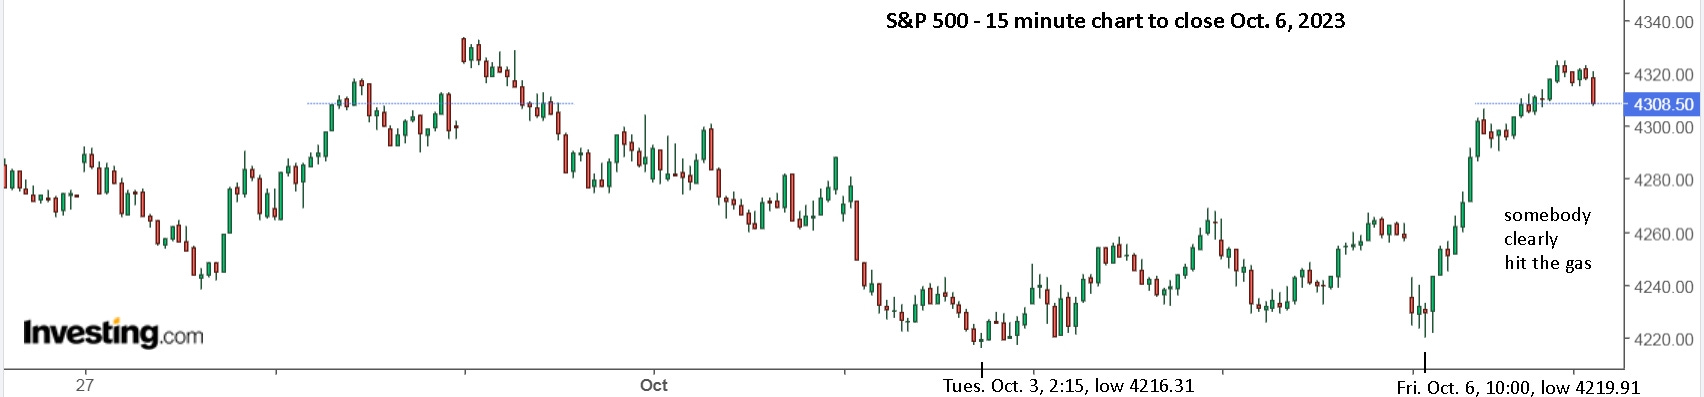
Update to Fri. Oct. 6: The markets have remained weak, Avi’s predictions have remained accurate and Friday was a strong up day, so there is a chance the bottom is now in.
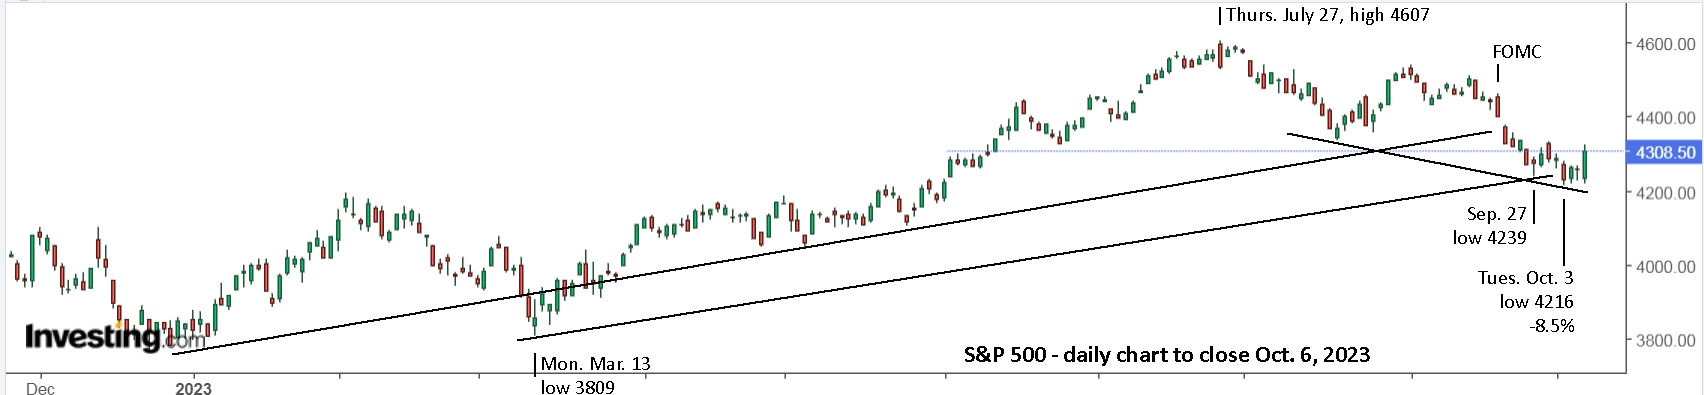
I was ready for a down day on Friday, and it did open lower and fall for the first 30 minutes, with multiple attempts to rally. At 10 am, they fell sharply for 10 minutes, then reversed sharply. It was quickly apparent that it was “game on”. For days, the markets have tried to rally but there was never any ‘juice’ in them, and they would fall back. On Friday, it was clear that big money was juicing things up.
On Sun. Oct. 1 (posted Monday), Avi wrote: “I am not quite certain we are done with the downside, as the downside pattern does not look truly complete. From an Elliott Wave perspective, if the market is unable to climb back through the 4370/75SPX resistance, then I am seeing strong potential for another drop to take shape. And, where that drop finds support is going to be very important to my expectations of another rally to 4800SPX.
At this point in time, I am adjusting our support down to the 4165-4230SPX region. Should we see that decline, then this should be the final test of this decline off the summer-time high. As long as the market successfully holds this support, then I am maintaining my expectation for a rally to the 4800SPX region next. Moreover, any move through the 4401SPX resistance region is a strong indication that the rally to 4800SPX has likely begun.” We hit 4216 on Tuesday and 4220 on Friday. I remain ‘worried’ we’ll still get to 4165, but Friday was a very strong move. Next week will tell the tale. Of course, I’m not worried as all, since the market weakness has presented terrific short opportunities with UVXY, SOXS and SQQQ.
The other indexes did not make a new low last week, which suggests SPX might do that this coming week. Basically, there’s now reason for cautious optimism. I’m sure people who sold and went to cash in late July are now deciding what and when to buy.
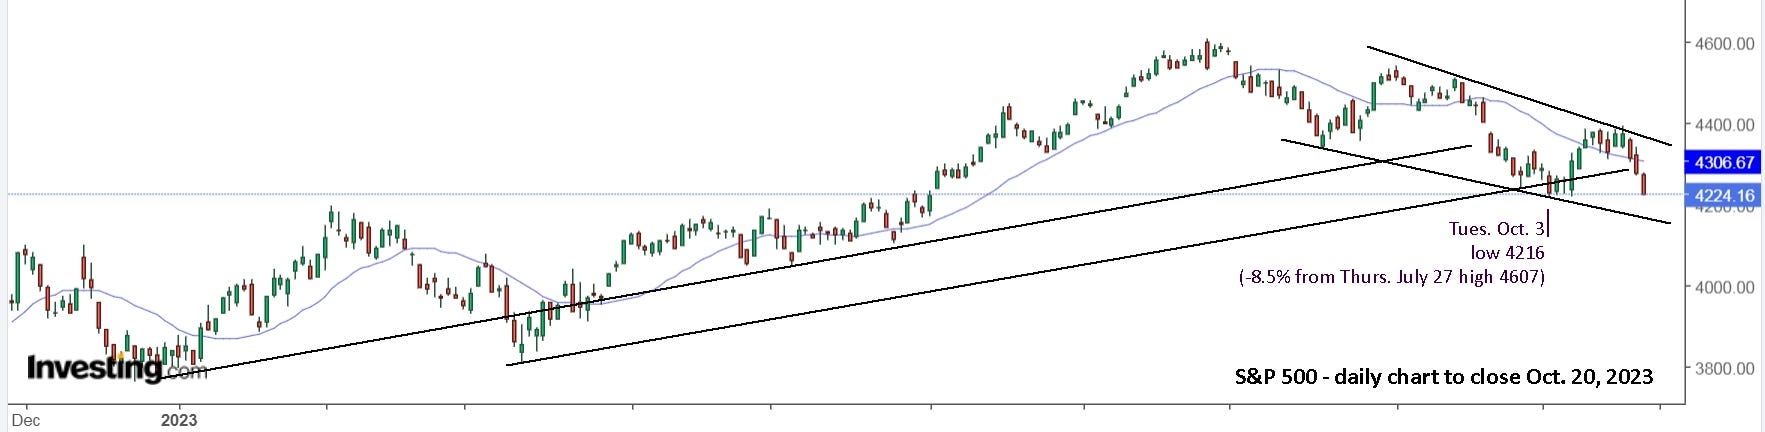
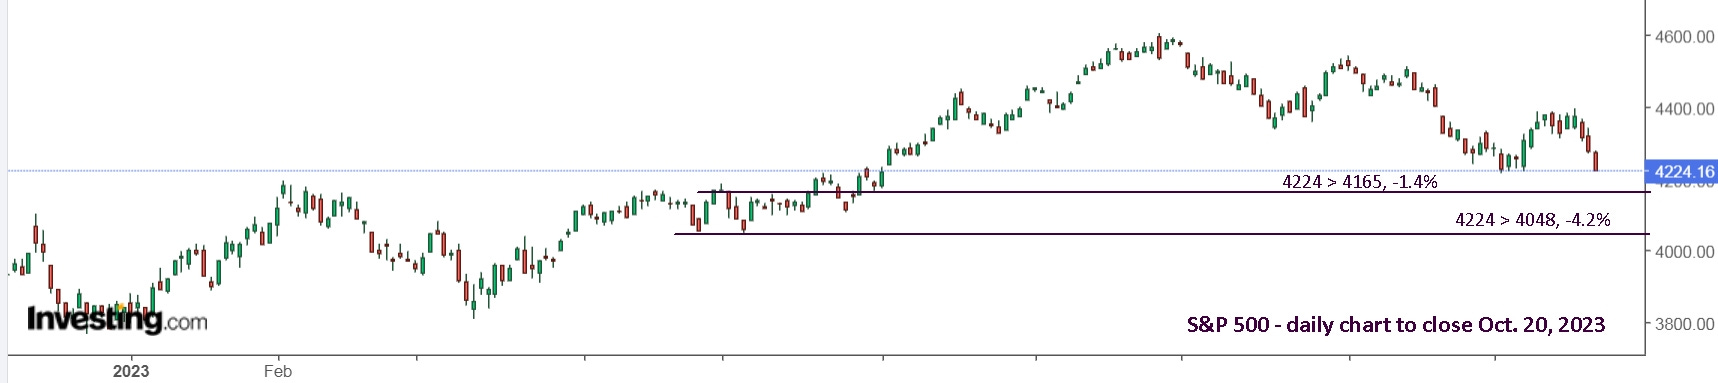
Update to Fri. Oct. 20: Since our last update, Oct. 6, the markets continued up from that Friday’s blast, then hit resistance at 4380+. For several weeks in advance, Avi outlined that the 4375-4401SPX region was going to be an important resistance region. If you had gone long SPY after Oct. 3, it was clearly time to sell and go back to cash. If you’re long and did nothing on Wednesday, Thursday or Friday this past week, then you’re clearly hoping for good results in your portfolio versus taking proper action to ensure good results in your portfolio.
I’ve been having a discussion recently with two friends who are blissfully content with their dividend investments, most which have been dropping in value since early 2022. How many investors have remained blissfully content with their investments over the past 4 months since I wrote this article, June 18, “Are you ready for a market drop?”?
From the chart above, do you want to be long or short the market at present? On the sidelines would also be a great answer, but I see no reason to be long. Yes, the current low may hold and then represent a double bottom, but I think it’s more likely to test the lower support trendline. If that breaks, then a very serious drop is likely and I would then suspect that the market highs were indeed hit in late 2021.
On Mon. Oct. 2, Avi wrote, “At this point in time, I am adjusting our support down to the 4165-4230SPX region. The reason I am adjusting the support is because the last segment of the drop exceeded the targets I set for that segment of the pattern. This opens the door to the lower end of support I highlighted in prior articles. …
In summary, as long as the market remains below the 4370/75SPX resistance region, I am expecting that we will test the 4165-4230 support region. Should we see that decline, then this should be the final test of this decline off the summer-time high. As long as the market successfully holds this support, then I am maintaining my expectation for a rally to the 4800SPX region next. Moreover, any move through the 4401SPX resistance region is a strong indication that the rally to 4800SPX has likely begun.
Alternatively, should the market instead see a sustained break down below 4165SPX, and then take us down to the 4000-4100SPX region, then the market is strongly signaling that a long-term top has likely been struck in the market, and we are setting up a decline that will likely take us down below the October 2022 low over the coming 6-9 months.
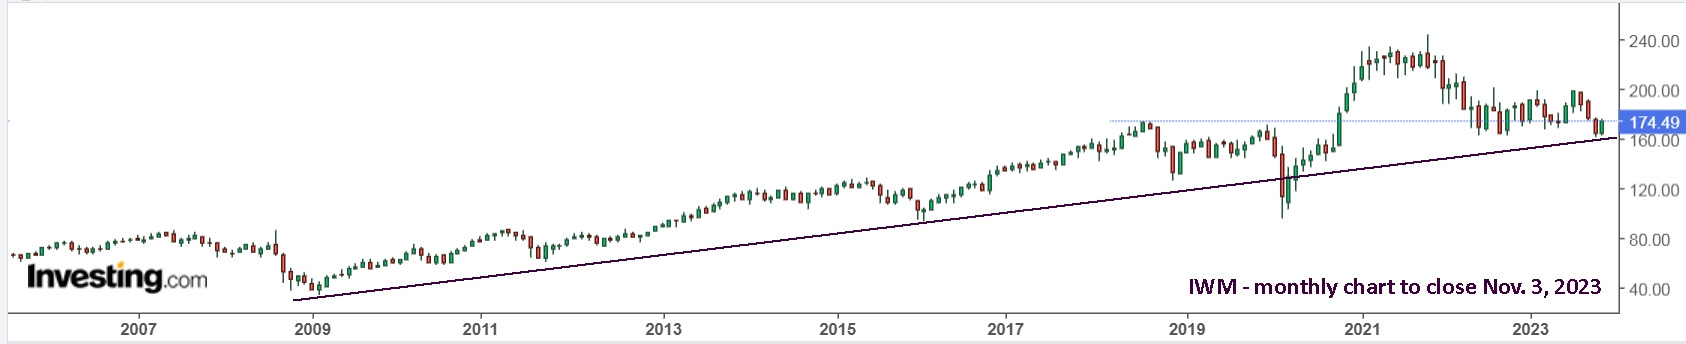
As for further confirmation for a bearish bias, I am also watching the IWM ETF, which represents the Russell Index. Should the IWM also break down below 167.46, then that would present another strong indication that a major top is in place, and that a bear market continuation will take hold over the coming 6-9 months.”
His bias was still bullish then and has remained bullish, but those are ominous predictions! On Friday, IWM hit closed below Avi’s support.
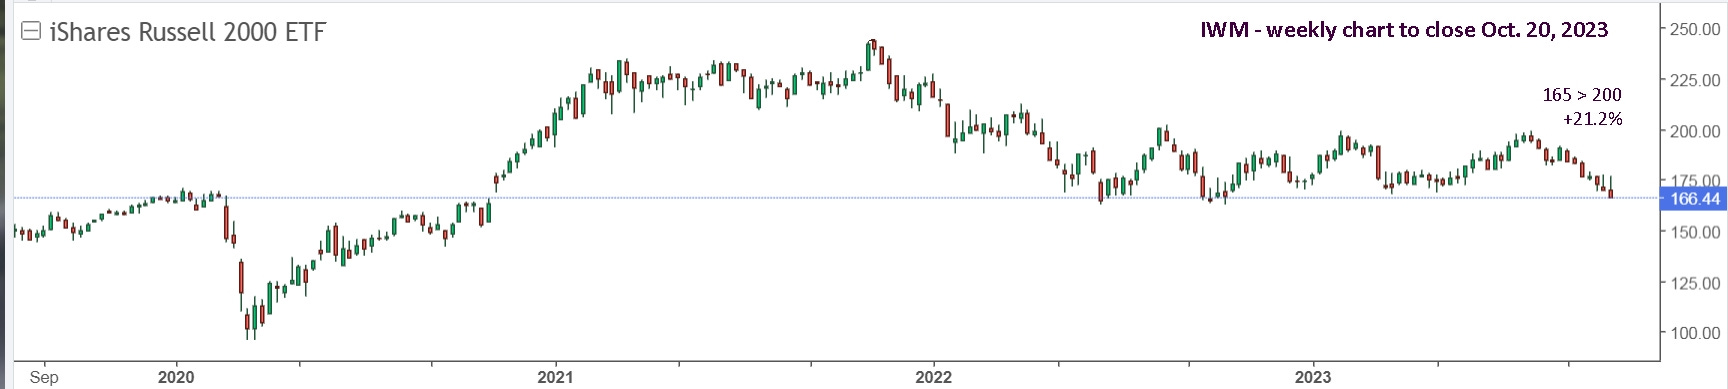
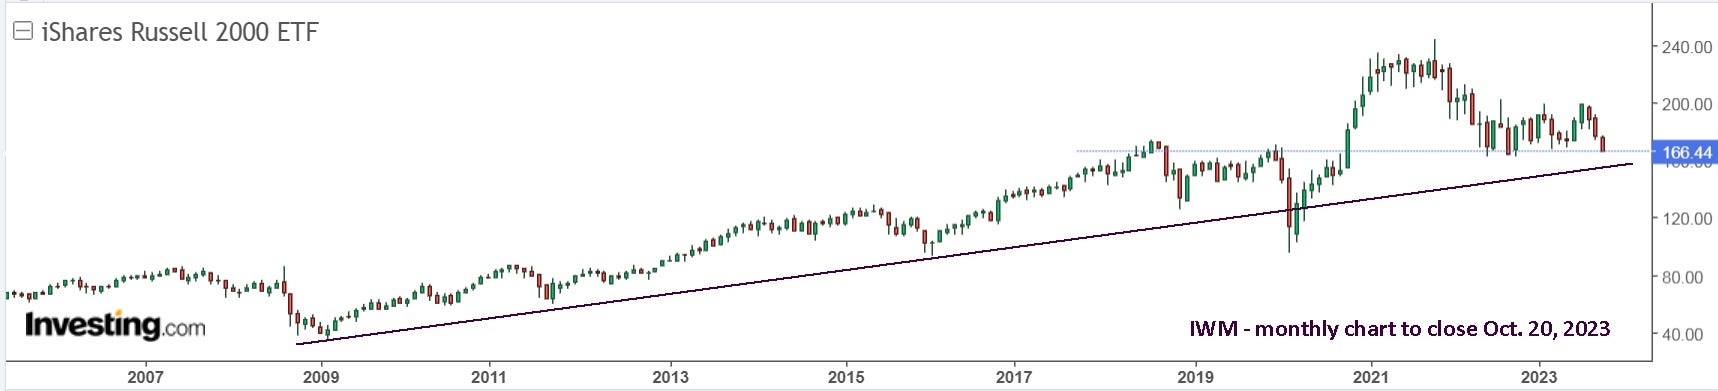
Will it bounce up from support again? I have no idea, but for sure I wouldn’t have bought on Friday in anticipation of a bounce. I think it will go lower and the monthly view shows possible support is near. If that support doesn’t hold, then it’s very likely that a decade long bear market is nearing its third birthday.
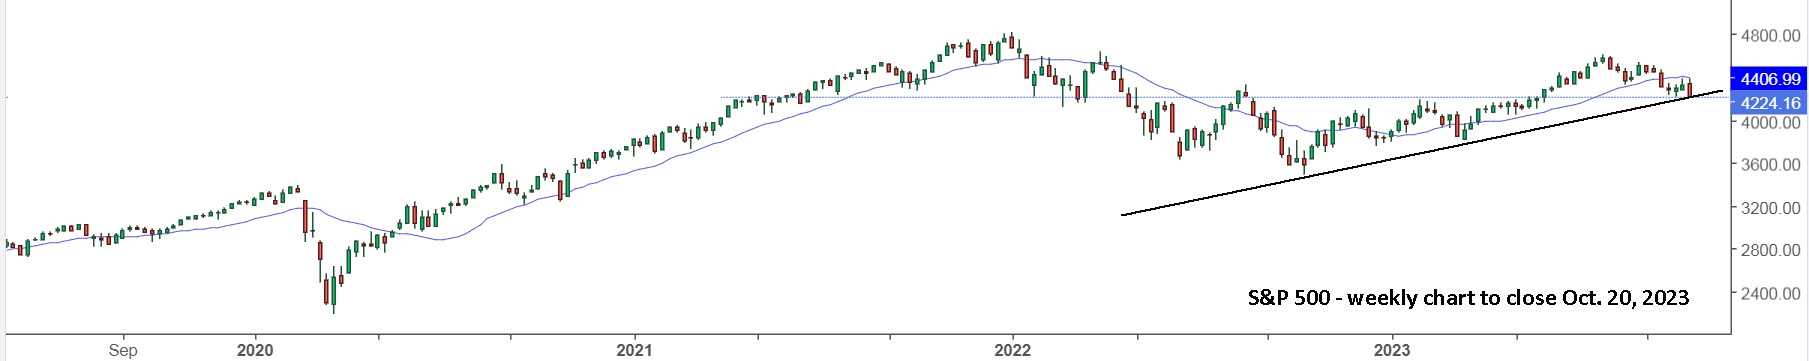
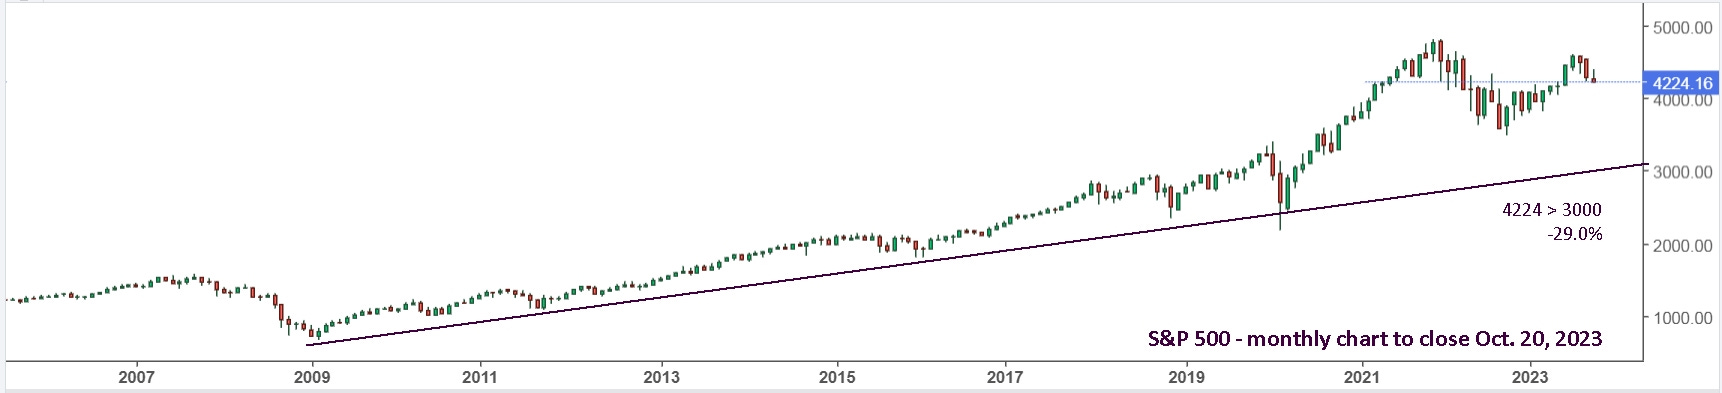
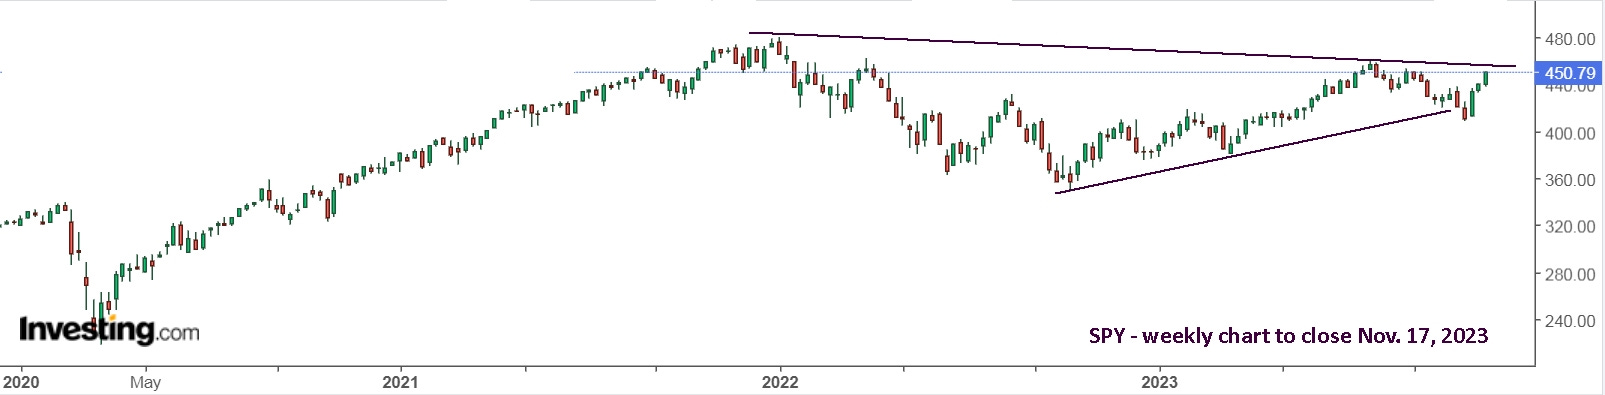
The S&P 500 is equally ominous looking. It’s at weekly support, but it’s a 29% drop to monthly support.
In his Mon. Oct. 16 update, Avi wrote, “As long as we hold the 4280-4302SPX region of support and then break out through 4401SPX, it would make it likely we are on our way to our next higher target in the 4800SPX region. However, a sustained break of that support would concern me that a major top may already be in place.” That support was broken on Thursday and smashed on Friday.
A week prior, on Mon. Oct. 9, Avi wrote, “Although it is a lower probability at this time, if the market breaks down below 4165SPX, it opens the door in a big way to the market setting up for a crash into 2024 which would point us down to the October 2022 low, and potentially well below it. But, it would still likely provide us with a multi-week “bounce” before we see a major break down below 4000SPX. Moreover, should this setup develop in the coming months, then it confirms that a long-term high has been struck in the market, and a multi-year bear market has begun.” We’re literally a day away from that happening, just -1.4%.
As he said, “it would still likely provide us with a multi-week “bounce” before we see a major break down below 4000SPX“, but you’d best have a plan in place for a long, cold winter! I suggest you read my Sept. 4 article, “Volatility can be super safe and life changing.”
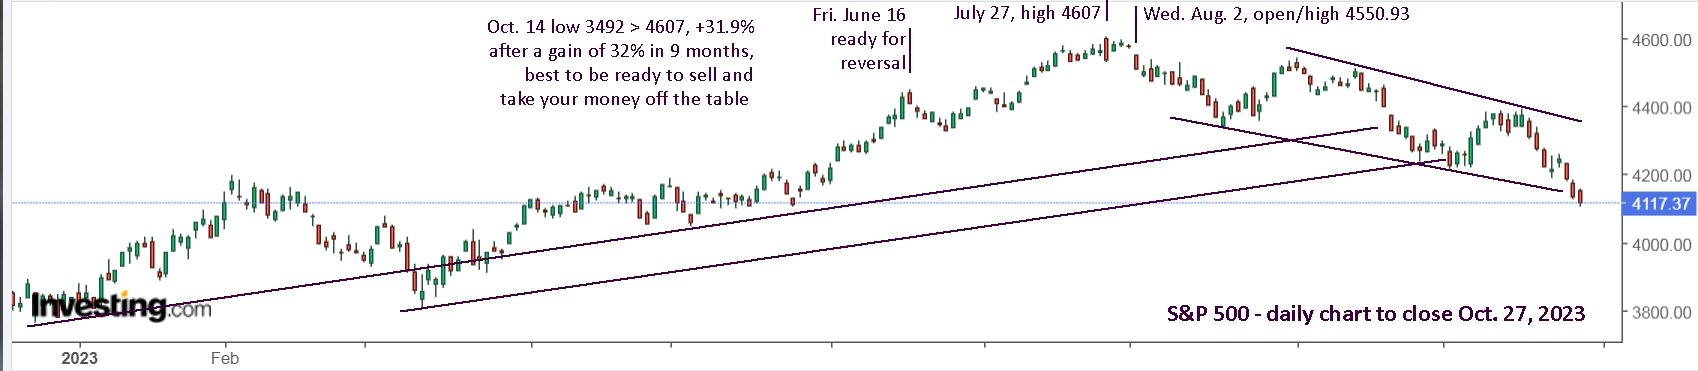
Update to Fri. Oct. 27: This past week was essentially a repeat of last week: up on Monday, Tuesday, then down hard the rest of the week. On Wednesday, one SA commenter wrote: “the nervous nellies are selling off today, great buying opportunities fellas”. I replied, “I remain a nervous nelly on the sidelines for any long positions.” JC has also been commenting on “bargains galore”, but we know his strategy is to buy in batches as the price falls. We may be approaching a bottom, but my motto is better to be a day late than weeks early.

Remember that last week, Avi wrote, “If we see a sustained break-down below 4165SPX which then takes us to the 4000-4100SPX region, then I will be forced to take a more bearish stance as we look towards 2024.” As Sandimas kindly pointed out, the simple trendlines have been just as effective as Avi’s guidelines which are based on complicated calculations.
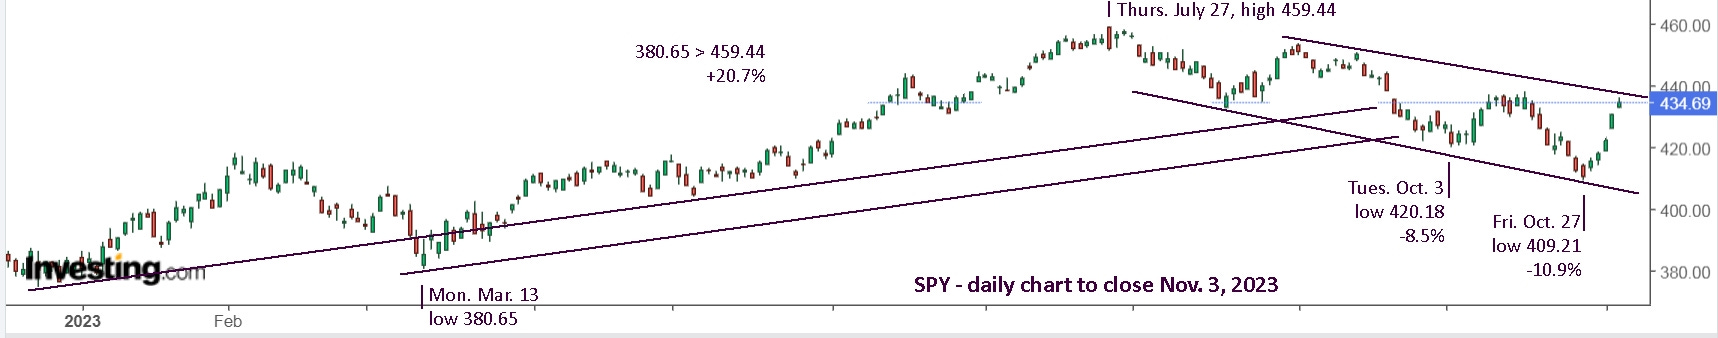
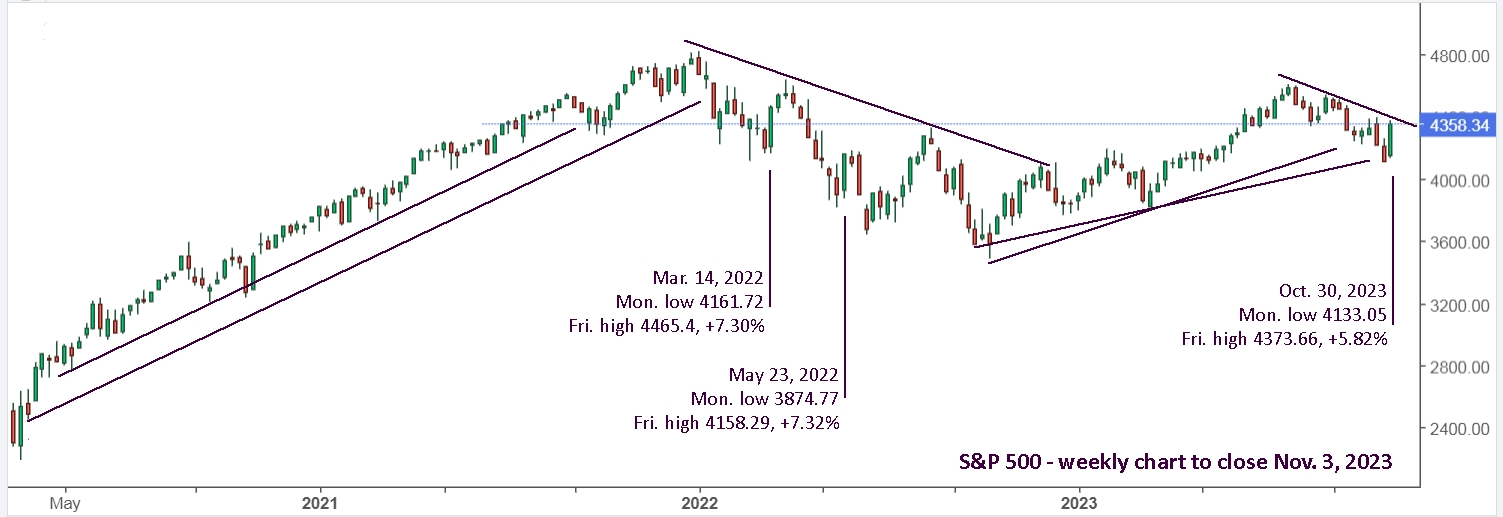
For curiosity, I took a look back to October, 2022 through to December, to see if the trendlines indicated a bottom and reversal. As you can see, the October 13 low was above the lower trendline support and two weeks later, an uptrend was indicated, that was already “too far, too fast”. Ideally, we’d like to see a slope similar to the preceding line, where it was also clearly “too far, too fast” at several points.
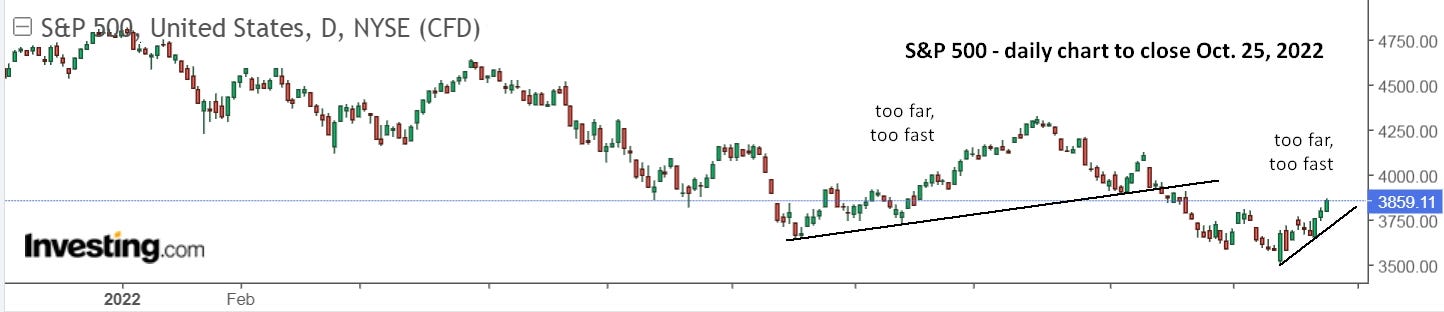
I realize that “too far, too fast” isn’t very technical, and drawing straight lines is something you practice in kindergarten, but it’s just so effective and easy that I love it.
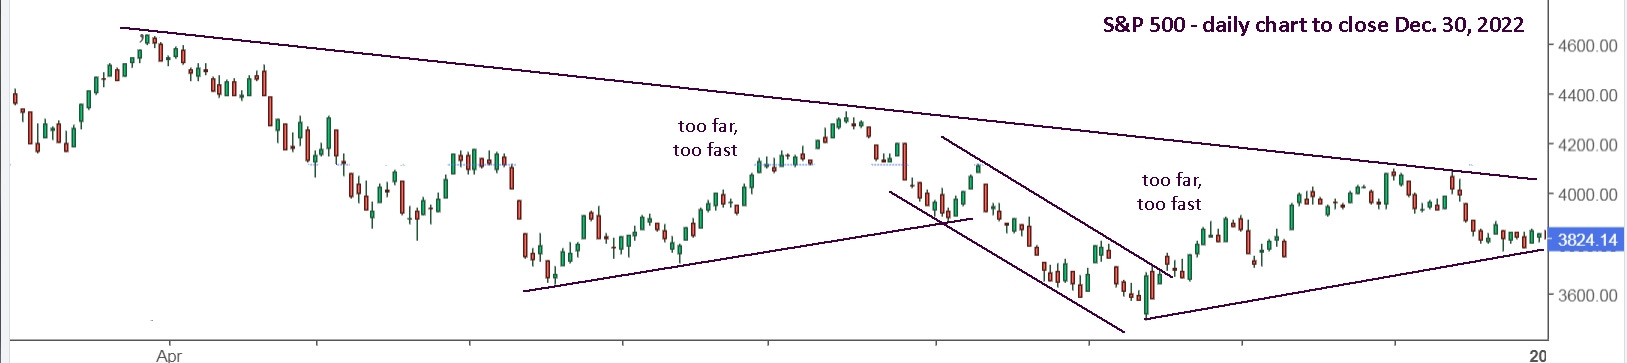
The rally from the Oct. 13 low, did indeed prove to be “too far, too fast” and the rising trendline to close out the year looked promising. In addition, the longer term downtrend line was going to soon intersect with the new rising trendline. One or the other was going to be “the winner”, and that would give you a clear idea of how the next few months would go. Here again is a view of the “winning” trendline.
The early warning signal this year, in February and June-July, was again “too far, too fast”. That got you safely to the sidelines early and deciding when to go long again. Since being turned back again from the upper falling trendline, you’ve been again comfortably watching from the sidelines as the nervous nellies have been selling and the bulls have been buying at ever lower prices. My advice, wait and watch for a reversal, but don’t be early. There’s always plenty of time to get on the bus at a fair price.
Update to Fri. Nov. 3: This past week started as a repeat of the last 2 weeks: up on Monday, Tuesday, then down hard the rest of the week. On Wednesday, SPX made an early high after 10:30 and began sliding lower till 12:30 when it held a floor. With FOMC on deck at 2:00, caution was the wisest action. Ideally, you bought at 10:45 on Monday and sold at 10:45 on Wednesday. That would have been +2.3% with SPY. Hardly worth the effort so a reminder of our general rules would have had you holding and willing to give up some of the gain.
The FOMC didn’t spark a wild swing in the markets like it normally does. It also has a tendency to eventually move opposite to how it started the week, so I was watching for that, which would make that 3 weeks in a row for such a pattern. The first move was up, then down for 15 minutes, hard up for 20 minutes to just under the 10:45 high, then down hard for 10 minutes to a new low for the day. Pretty much ‘predictable’ and a full triple fake: up, down, up, down. It then wobbled for 5 minutes, then roared up. Very hard to jump back on that bus, but that’s what was needed.
By the close on Friday, you might be looking bewilderingly at the back end of the bus, turned Formula 1 race car as it zoomed off into the sunset. SPX is up 6.2% from last Friday’s close, which was the end of a two week waterfall drop.
Obviously, there were no surprises in what was done or said at the FOMC, yet the markets shot up like a cork popped from a champagne bottle. I’m curious to read what Avi has to say on Monday. For us, the story is already abundantly clear in the two images above.
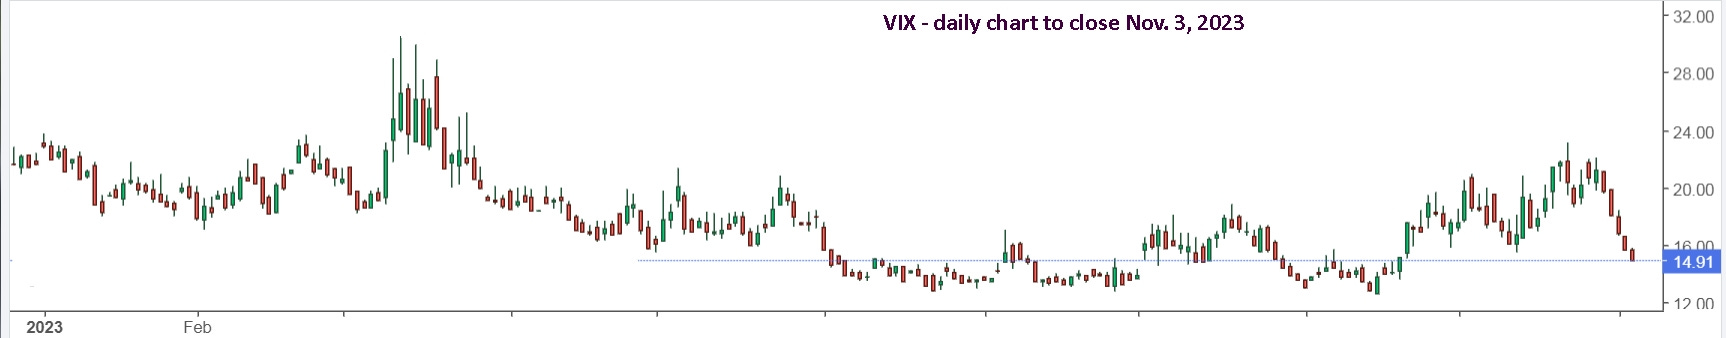
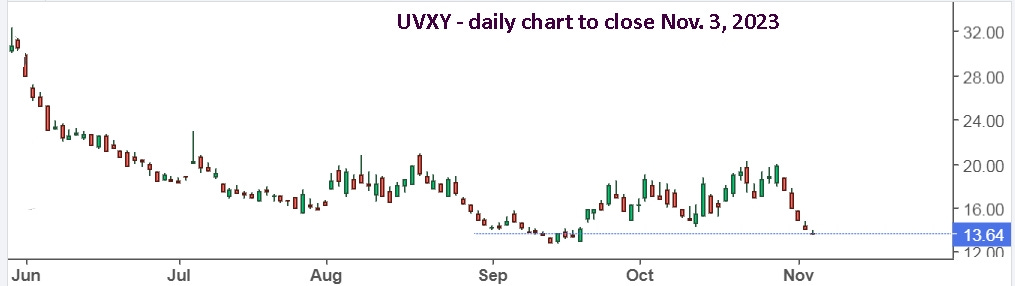
The good news, and for us, great news, is that VIX is way back down under 15 and UVXY is back near its September lows. Obviously, the VIX could continue to trend lower and UVXY could hit single digits in a few months if the markets are able to establish a new uptrend. If the markets fall back from resistance, then buckle up for a new ride with UVXY.
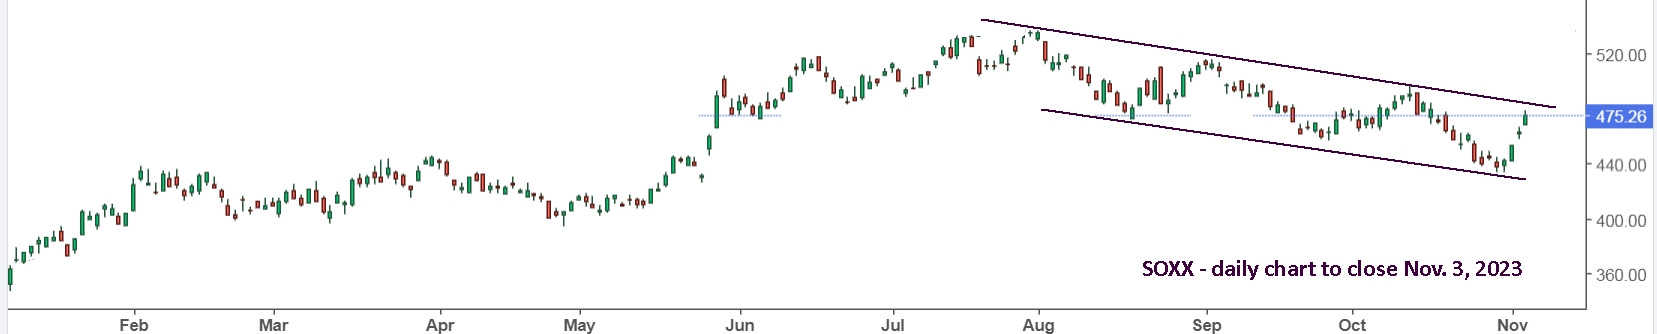
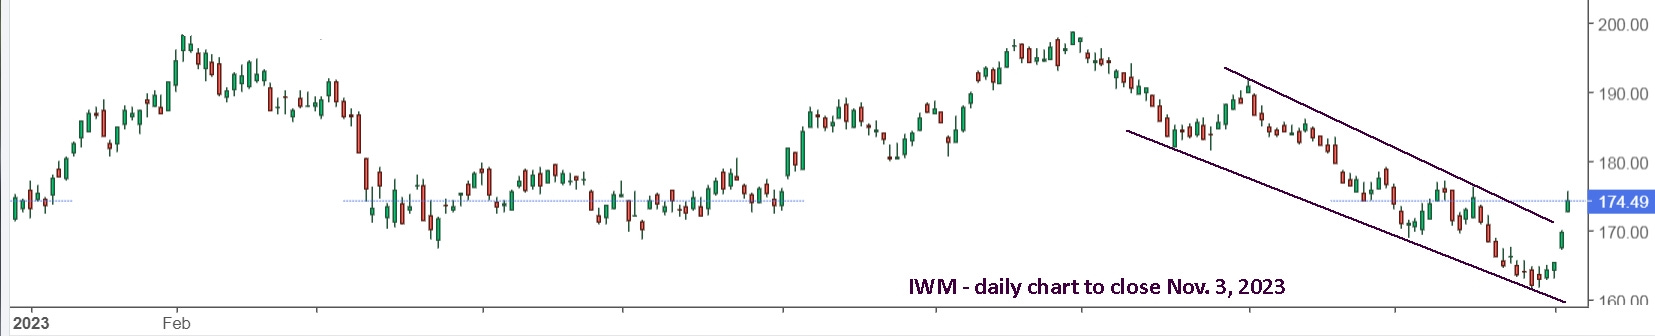
Moving back to the long side, here’s a look at SOXX, QQQ and IWM, the reference ETFs for the leveraged versions, SOXL, TQQQ and TNA. Two are at resistance with IWM clearly “too far, too fast”. I would also add that SOXX andQQQ are rather “too slow” for a typical bearish move. Drops are usually steeper than rallies
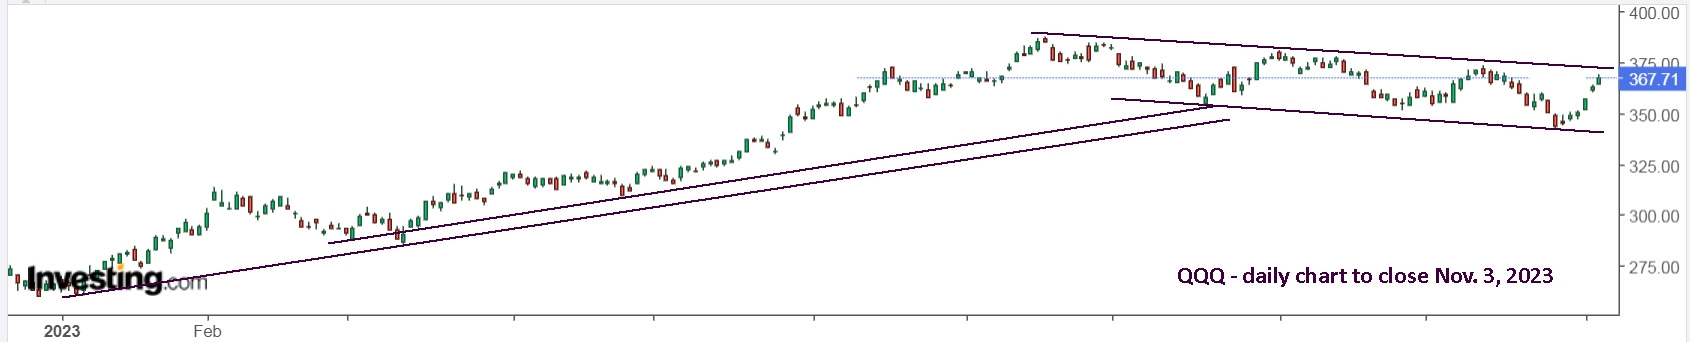
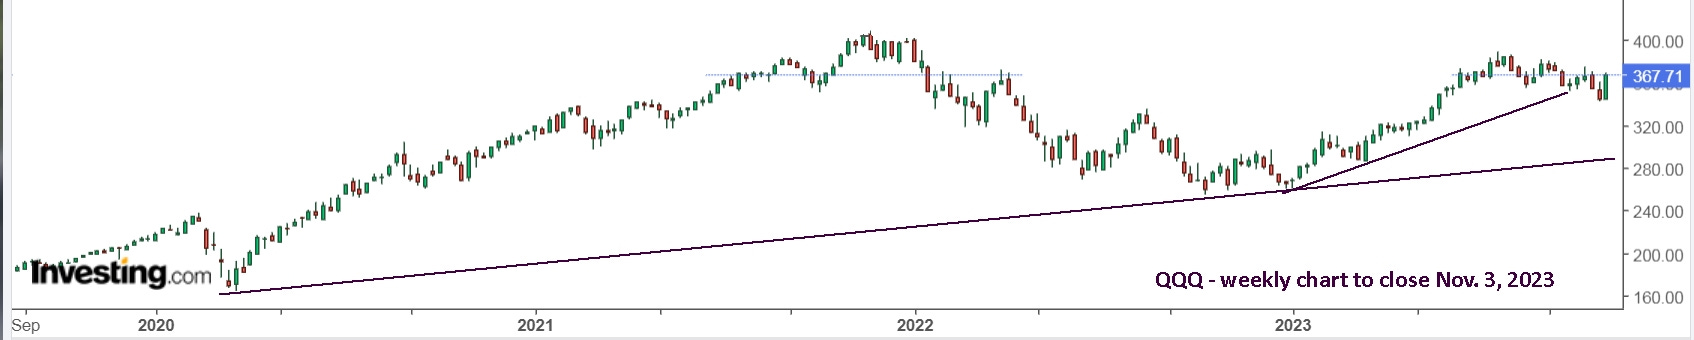
If we zoom out to a weekly and monthly view, some interesting thoughts arise. QQQ shows “too far, too fast” in 2023, and the shallow, drawn out pullback looks perfectly reasonable. On a monthly view, it’s still “too far, too fast” with a long way to fall and still remain in a bull trend from 2009.
SOXX shows a similar condition, whereas IWM is back to its monthly support and bounced sharply last week. That looks really healthy and we could see an uptrend going forward.
For now, the daily view should be watched closely and action taken accordingly. In general though, after a week where Avi capitulated to the decade long bearish possibility, and I was preparing for it, yet expecting a bounce last week, last week’s massive strength has me cautiously bullish again longer term. Was that the capitulation drop with fair winds and blue skies ahead?
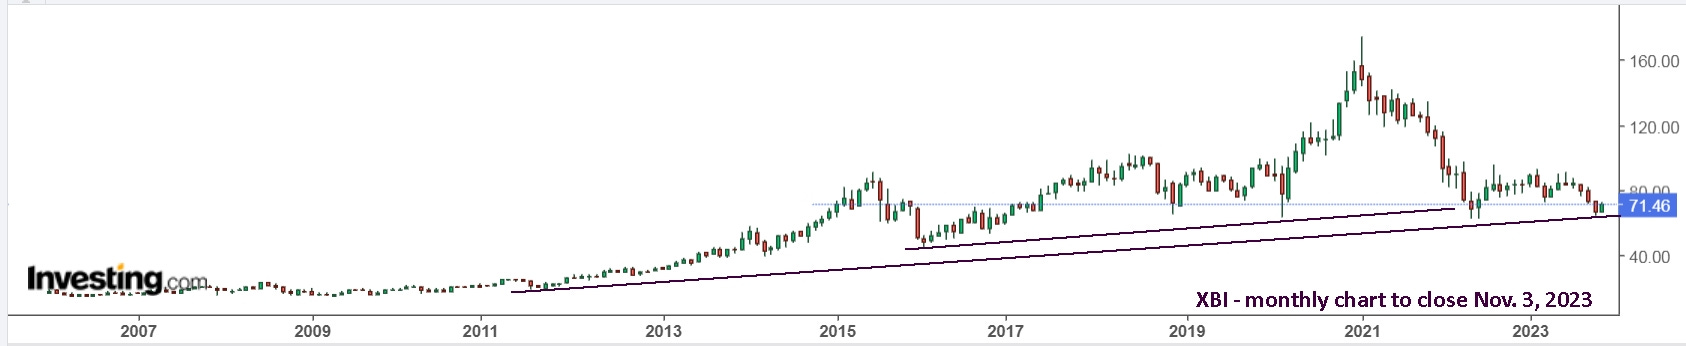
For something different, biotech ETF, XBI may have hit bottom last week. The leveraged versions, LABU/LABD, can be a miserable trade, with no logic or direction, but it can also be very profitable if you get it right. JC’s followers were badly underwater in early 2022 and I finally took the plunge off the June low, rode the rocket up to the August high, then got tossed around as I expected an upward trajectory that never came. I’ve mostly ignored it since July, and missed the nice move with LABD, but wasn’t caught holding LABU like some of JC’s followers again. I bought the early reversal Tuesday at 2.48 and sold Thursday at 3.02 (+21.8%) with a stop re-buy at 3.05 that never triggered. It opened Friday at 3.13, hit 3.10, I didn’t jump on, and off it went to 3.47 (+10.9% from the open, +14.9% from my sell at 3.02).
Remember, it’s hard enough to ride one bucking bull, let alone two, so pick your ride: SOXL, TQQQ, TNA or LABU and focus on that.
Another bullish indicator is something called the Zweig Thrust. You can read the comment here on Seeking Alpha.
To temper the bullish sentiment I’ve been reading, I decided to look for similar strong moves in a week. To my surprise, last year had two excellent examples, and the downtrend continued.
Now, forget all ideas of what might happen, and simply focus on what is happening and trade accordingly. Good luck!
Update to Fri. Nov. 10: This past week started pretty much as expected, holding the ceiling resistance, then it faked lower on Thursday and roared up on Friday. My best advice from last week was “forget all ideas of what might happen, and simply focus on what is happening and trade accordingly.” Too bad I didn’t do that on Friday. Oh well, what’s the plan now, assuming we missed going long Friday, or even a week ago.
Avi’s article on Monday had nothing useful to say, and JC sold his SOXL and SPXL on Thurs. Nov. 2, missing the extra move on Fr. Nov. 3 and this past Friday. He also went short buying SOXS on Thurs. Nov. 9. He bought SQQQ on Nov. 2, so it’s even more underwater as of Friday’s close. Naturally, he’s not the least bit worried, even though he wrote on Friday, that QQQ “will continue to ascend until K+ > 4 weeks”. Naturally, somebody asked, “What about all your shorts?”. He replied, “I will eagerly monitor TQQQ for anticipating -dvR next 2 days. At least, it will be assured of EMA20 for SQQQ taking profits. Ditto SOXS < $11.40.”
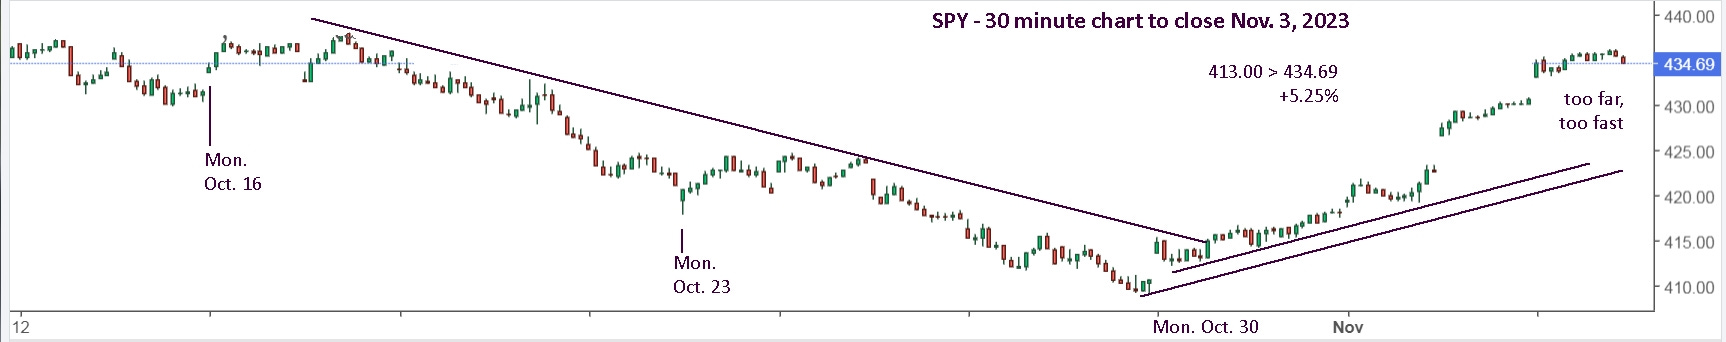
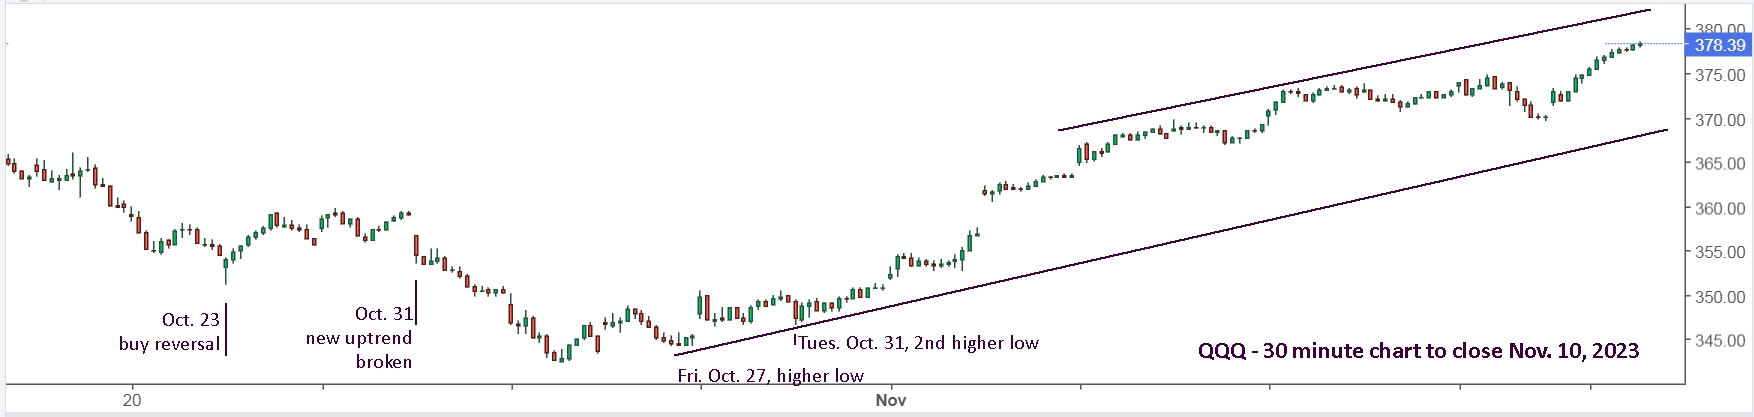
The 30 minute SPY chart I posted last week now shows just how helpful trendlines can be. And remember that different time frames can sometimes tell completely different stories.
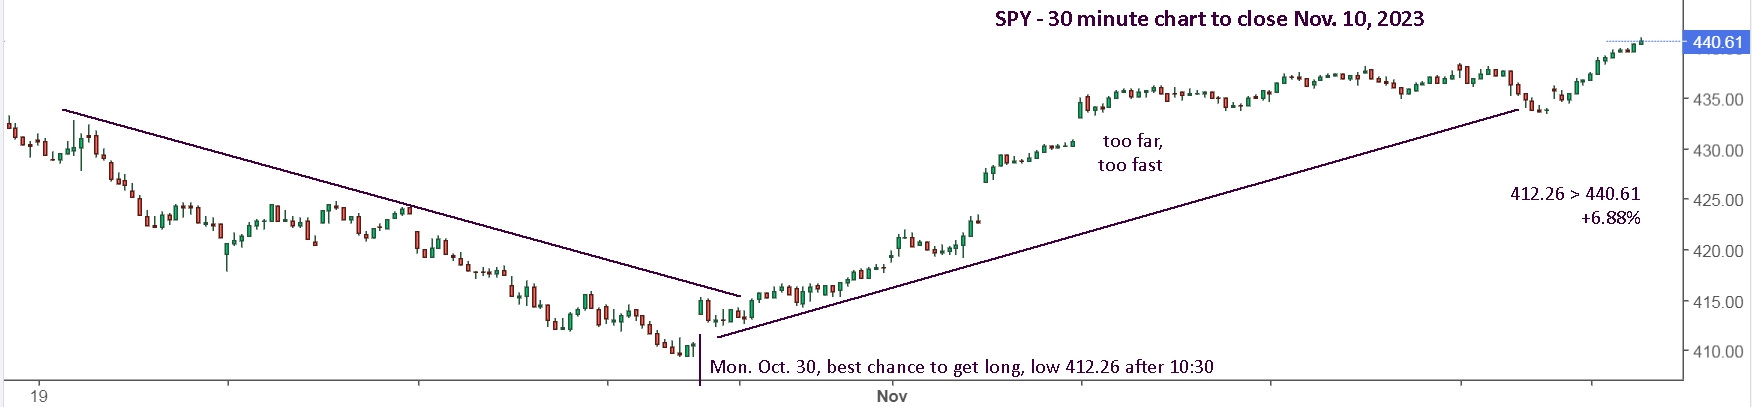
This shows clearly how “too far, too fast” can be resolved with a bit of time. The sharp drop on Thursday was very ominous and going short with SPXS, SOXS or UVXY was a good decision. Holding those positions overnight was also wise, but not profitable. Once the potential ‘storm’ passed on Friday and the sun came out, it was time to switch back to being long and sell your shorts. Making that switch is not easy.
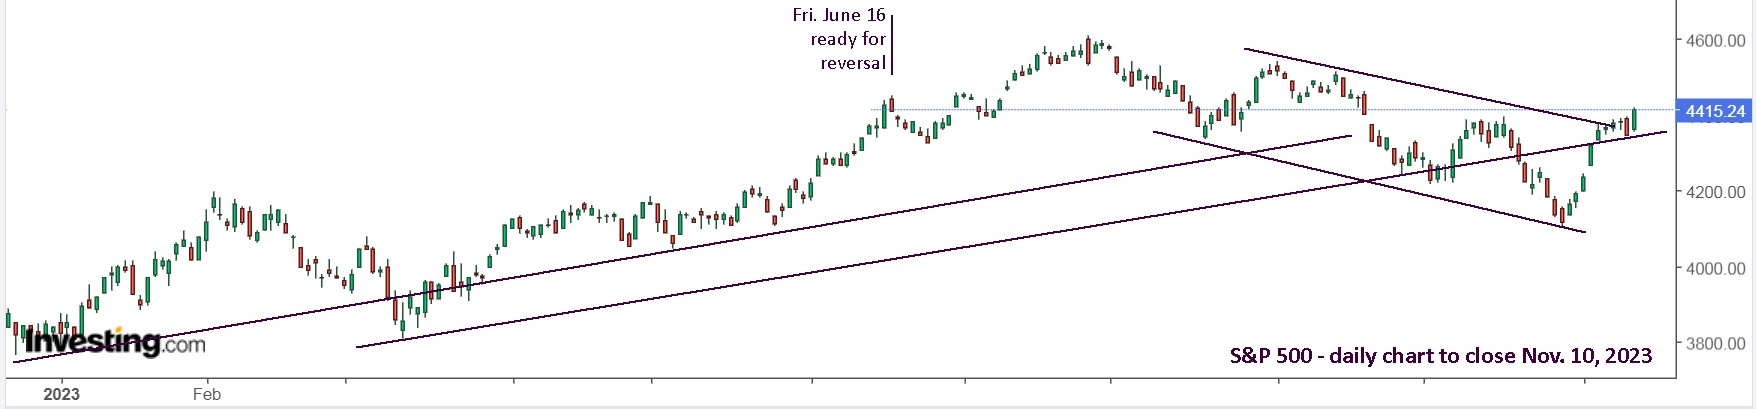
A daily view of SPX shows that we’re now out of the ditch and back to driving on the shoulder. Have you ever fallen asleep at the wheel? When you hit the ditch, the noise wakes you up immediately and you quickly crank it back to the road, or at least, that’s what I did, and that’s what the markets did recently. A mile down the road, your heart slows back to normal and you continue down the road like nothing happened, but not really. It sticks with you as a reminder.
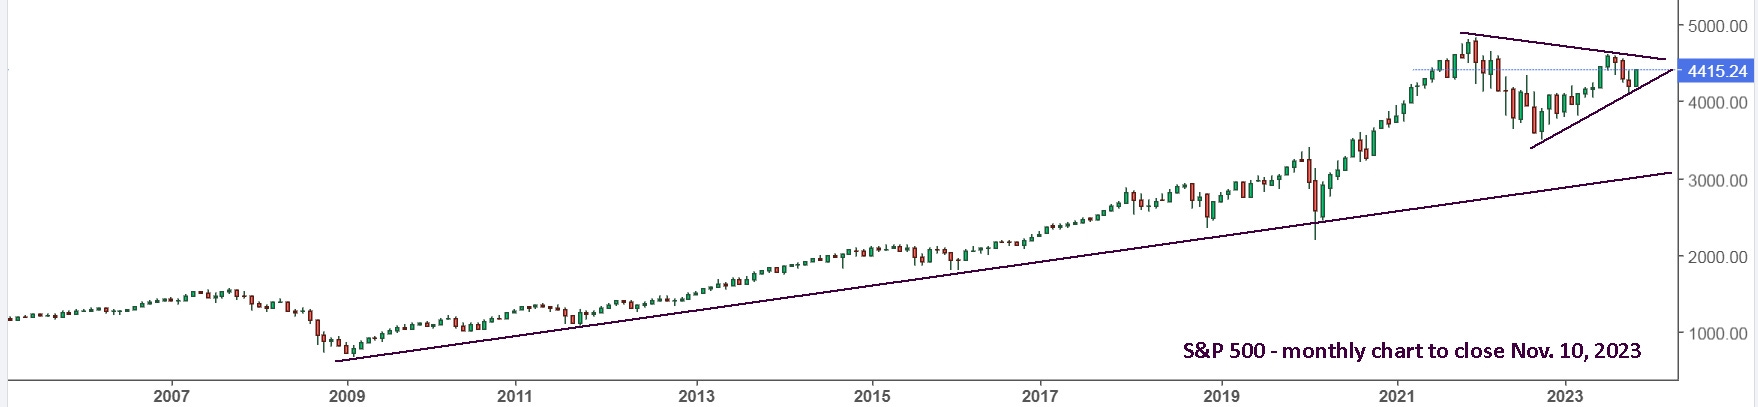
On a monthly view, the past few weeks that caused Avi to switch from bullish to bearish, doesn’t look that significant. What is clearly significant, is that we’re approaching a key intersection where the markets will decide to head north or south. Be sure that you’re positioned accordingly when it happens, or soon after it happens.
Two weeks ago, in my UVXY update, I noted the higher low for QQQ on Fri. Oct. 27. Sure, Avi was now bearish based on SPX hitting a lower low, but they both gapped higher on Mon. Oct. 30. A second higher low held on Tuesday, so the trend was clearly bullish and worrying about a potential drop after the FOMC announcement on Wednesday, simply had you unnecessarily on the sidelines and then scrambling to get long, or simply watching the bus leave the station without you.
Friday was a good chance to go long and if you missed that, like me, then simply look for an opportunity Monday, and it could be long or short.
Update to Fri. Nov. 17: This week’s action all happened pre-open on Tuesday after the CPI report, and if you weren’t already long, well, the bus left without you. So, let’s review and make a plan for moving forward. It may seem like this 3 week move was extreme, but it actually wasn’t. There are even 3 periods this year that were nearly as large. Yes, it was a significant fake lower just prior, and maybe this is a fake higher, but I suspect the uptrend will continue. Regardless what you think, trust the trendlines to be your guide.

On an hourly basis, the 3 week returns were terrific, but looking back, they were still terrific in June and July, which was the end of a long uptrend, so there’s potentially more terrific returns available going forward. You simply need to plan your strategy, take the leap and be ready to hit the ejection button if your chosen ETF takes a nose dive.
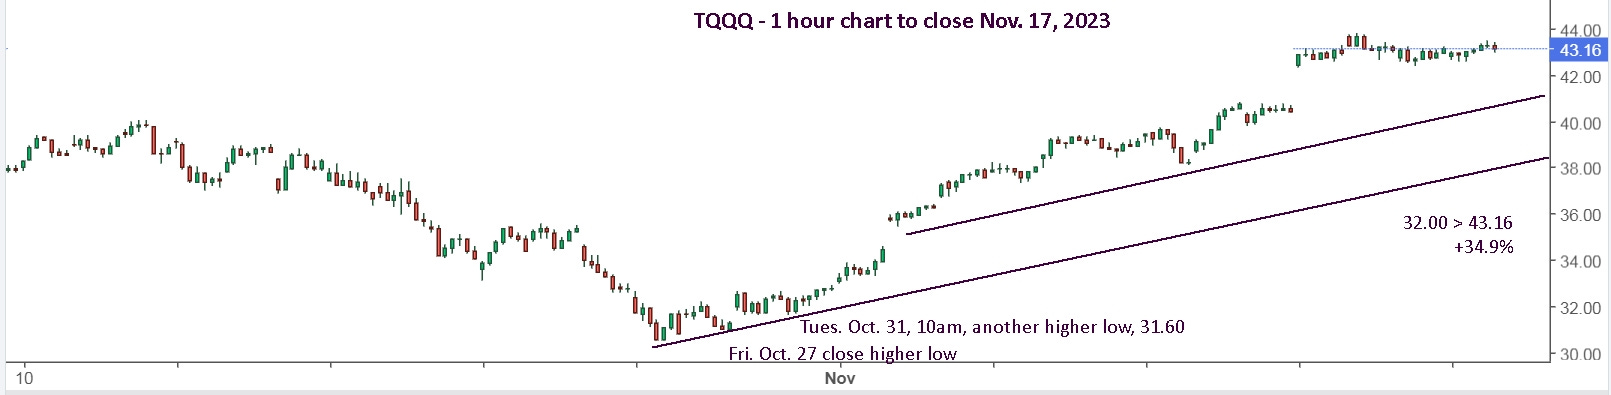
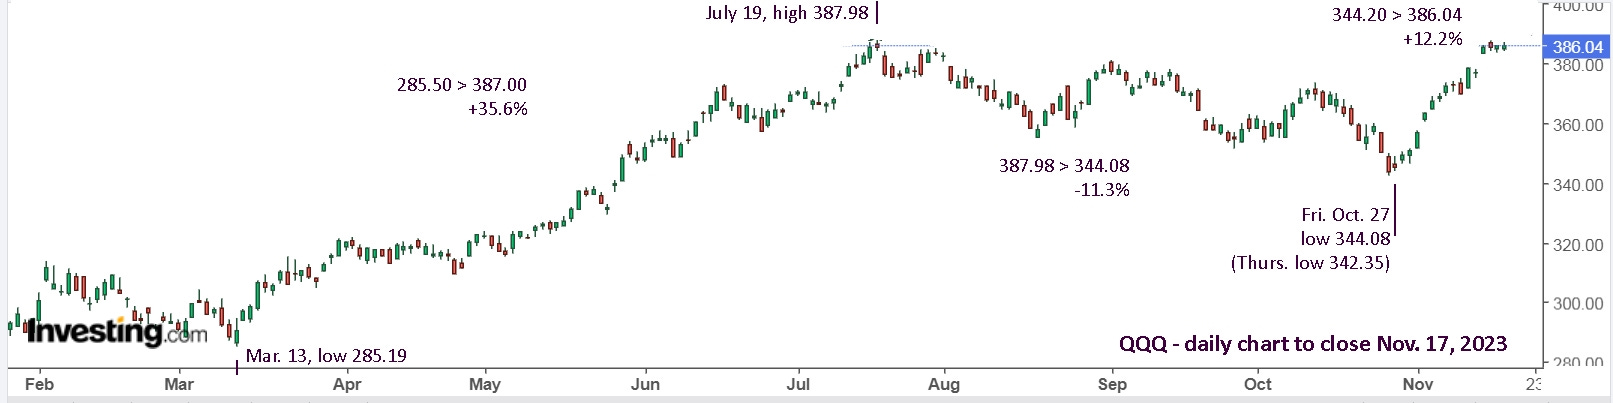
For those who don’t want to trade leveraged ETFs, it still makes a big difference to your portfolio if you make an effort to follow the larger trends and exit to avoid the drops. Buying on March 13 and doing nothing is now up 18.4%. Selling in July locked in 20% and re-buying on Monday, Oct. 30 allowed you to bag an extra 9.3%. Your compound return from those 2 actions is 31.7%. That’s nearly double your 18.4% doing nothing. The choice is yours which you want to do in the future.
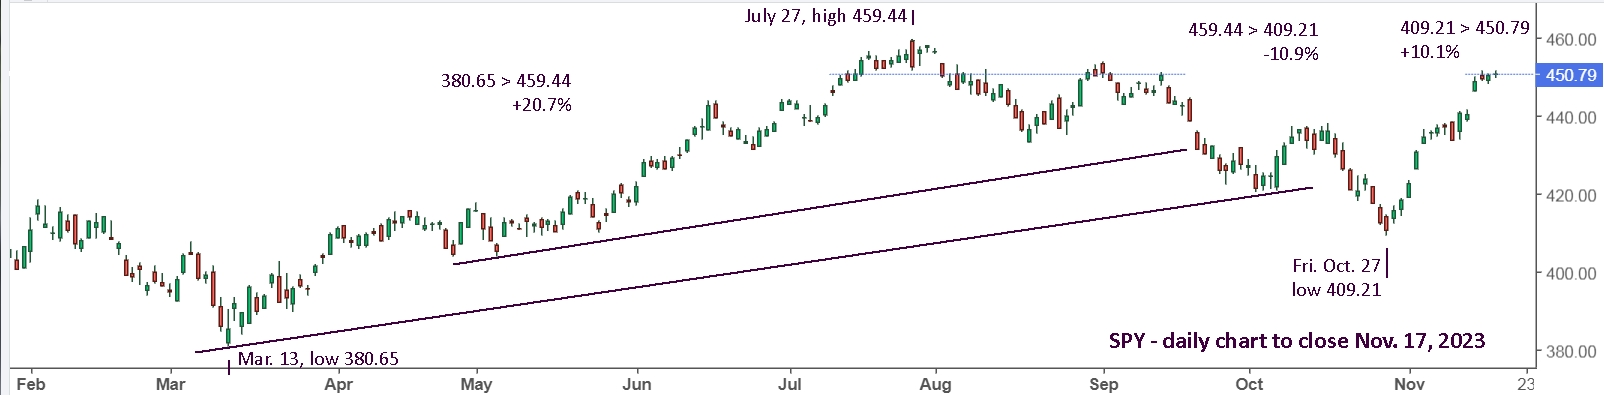
And if you’re going to make the effort, you might as well pick a better horse. QQQ would have you up about 52%.
Good luck going forward! I may not update this again and I’m planning to write a new article, “Trendlines can keep you on the road to success.”
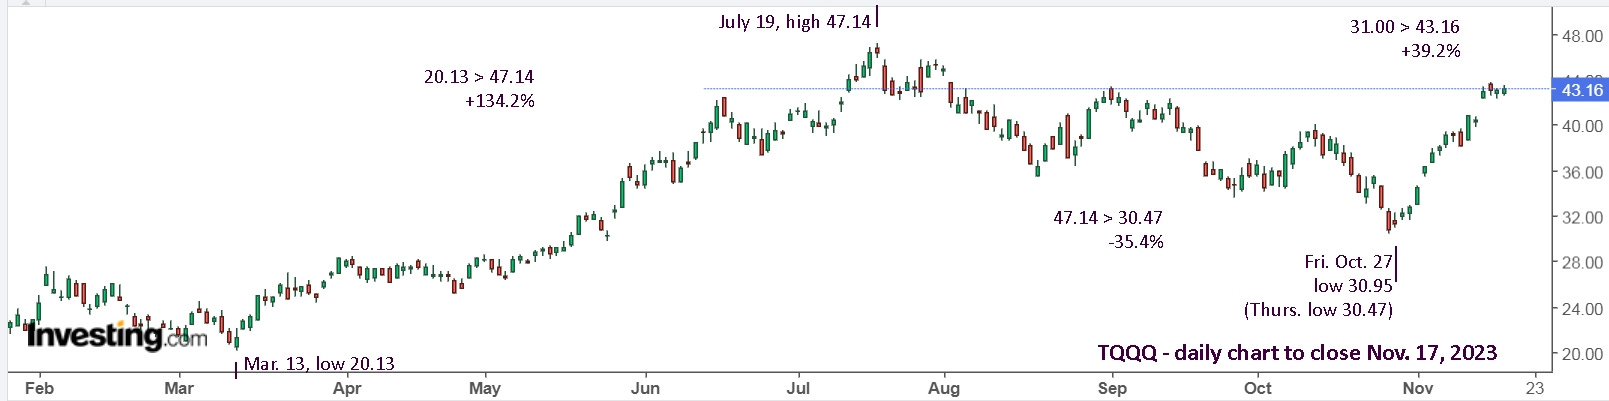
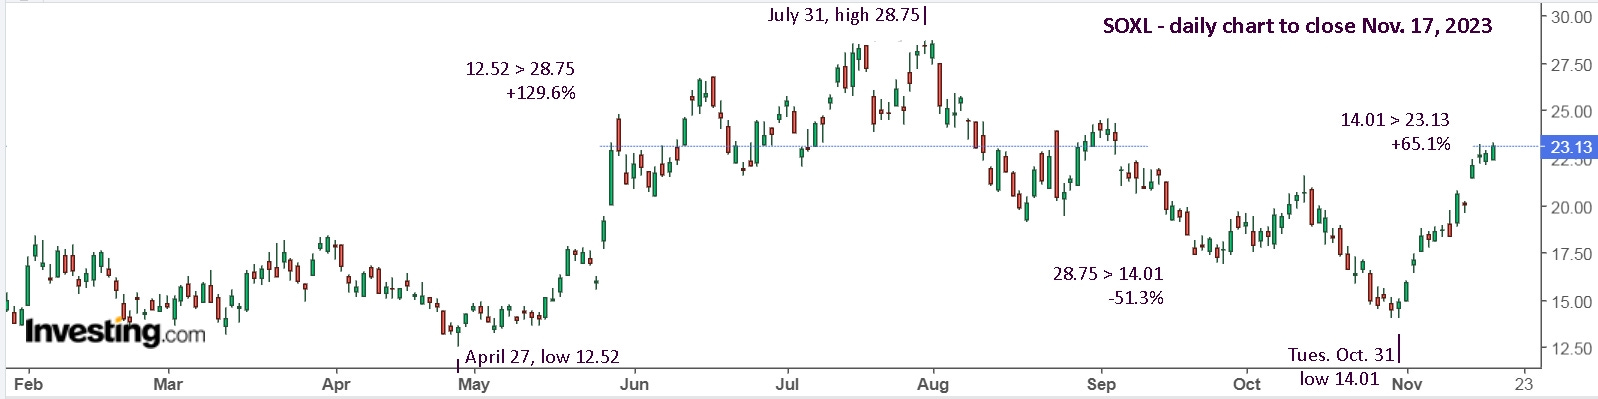
… another thought to pass on. The leveraged versions can also be successful with only 2 trades, but you need to be confident in your strategy and have the stomach for bigger swings.
Good luck!
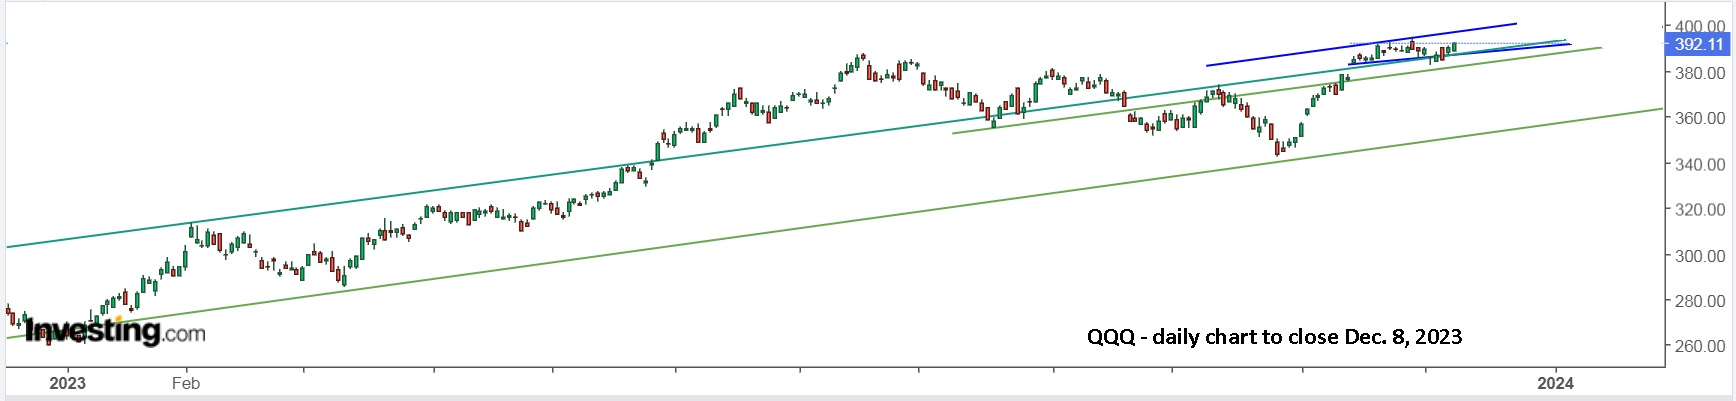
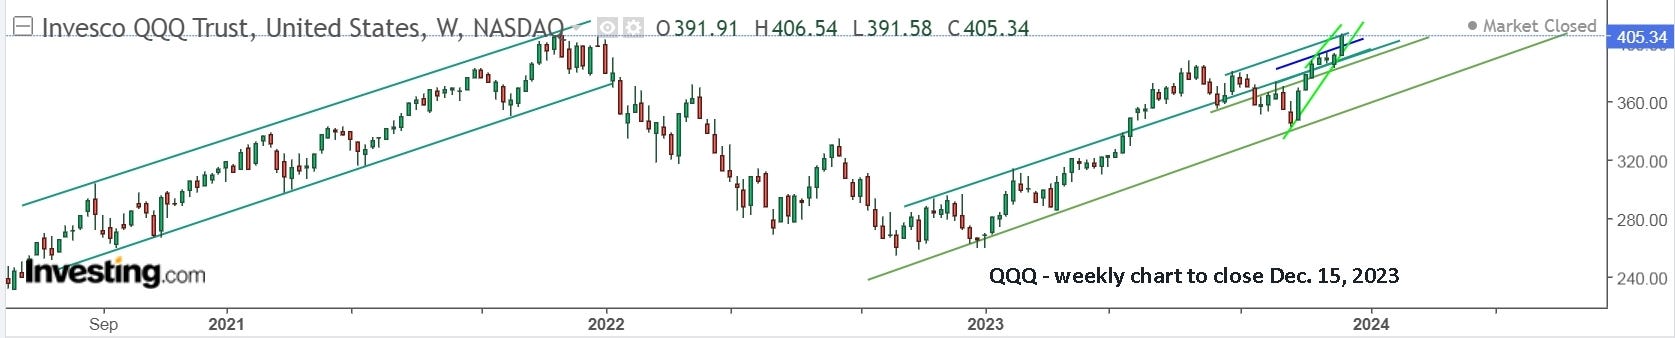
Update to Fri. Dec. 1: In my last update, I wrote, “Regardless what you think, trust the trendlines to be your guide.” Since then, I figured out how to draw trendlines on the Investing.com charts and to save them. They’re not 100%, sometimes lines move in different views or don’t appear, but they’re great for a free service if you don’t have them on your trading account. Here’s a look at the weekly chart for QQQ.
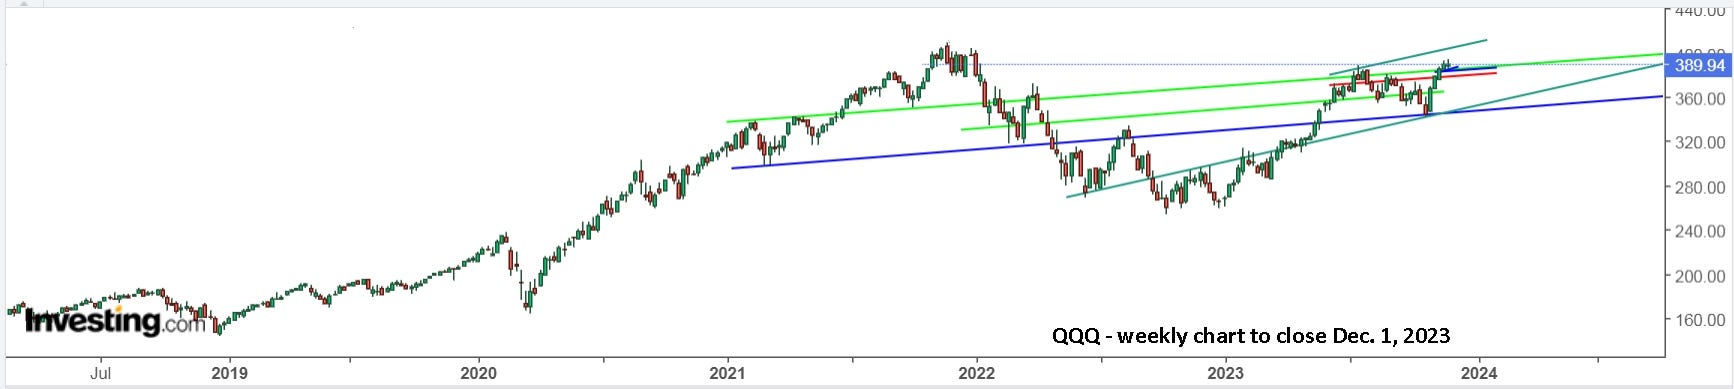
The lower blue line extending back to 2021 was the first one that I drew. I wanted a line that wasn’t as steep as the many alternatives. Drawing the upper light green line parallel gave me a good reference for that slope as I zoomed in. The darker green line through the October low gave a steeper support trendline along with a parallel resistance line. Zooming in to the daily view, the dark blue support line looks nearly flat, and even the steeper dark green lines look quite gentle, be we know they’re not.
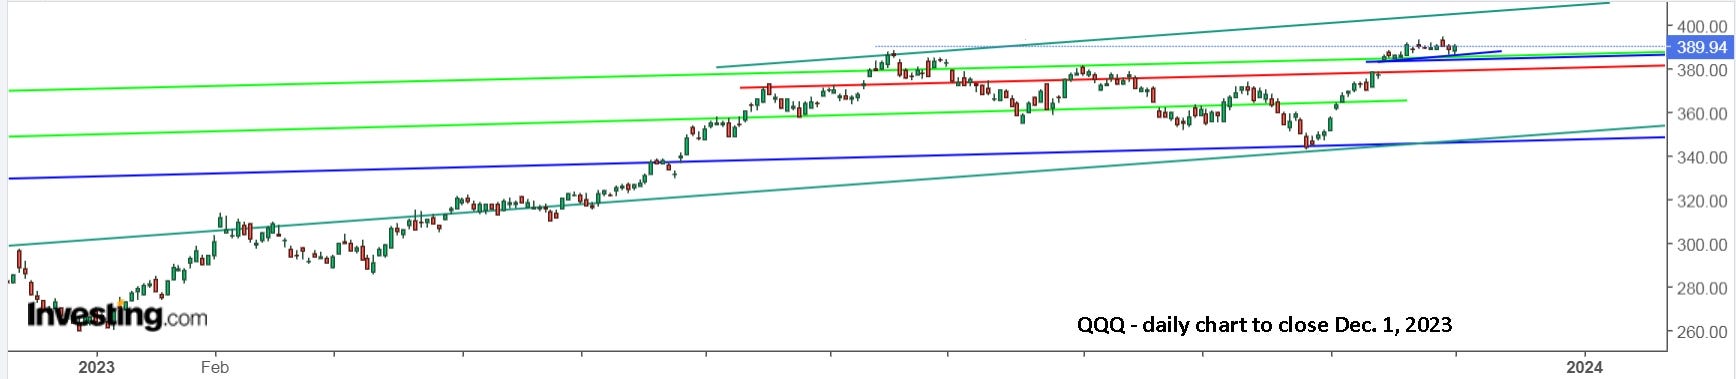
Keeping those same lines across varying time views really helps maintain perspective. I then drew the red line and a parallel blue line above it and then zoomed in.
Next, I drew the sloping blue line through the Nov. 14 and 16 lows and extended it into the future. It was drawn 2 weeks ago, and you can imagine my thoughts when it missed touching by 16 cents at 1:30 on Thursday, Nov. 30. The longer it held the more confidence it provided to buy. On Friday at 10:30, the line was now up 15 cents to a penny under Thursday’s low of 385.86. It hit 386.10 and reversed sharply. Time to buy, and you had a second chance on the dip after 11:00 to 386.60 and it then shot up to 388.84.
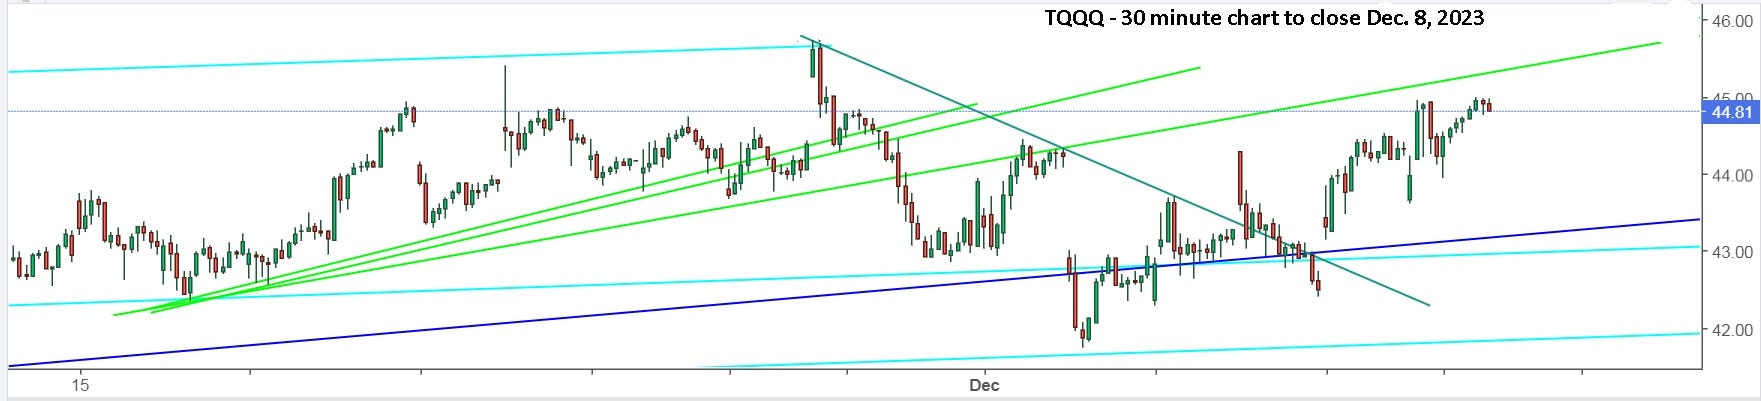
Of course, if you’re buying QQQ, then you’re not watching to time your buys and sells so closely. With TQQQ, you likely are. Here’s a daily view with the trendlines that I drew as a rough guide. When I drew them, there weren’t many clear reference points, especially for the upper light blue line, which I simply made parallel to the lower line and through the July 5 and Sept. 1 highs.
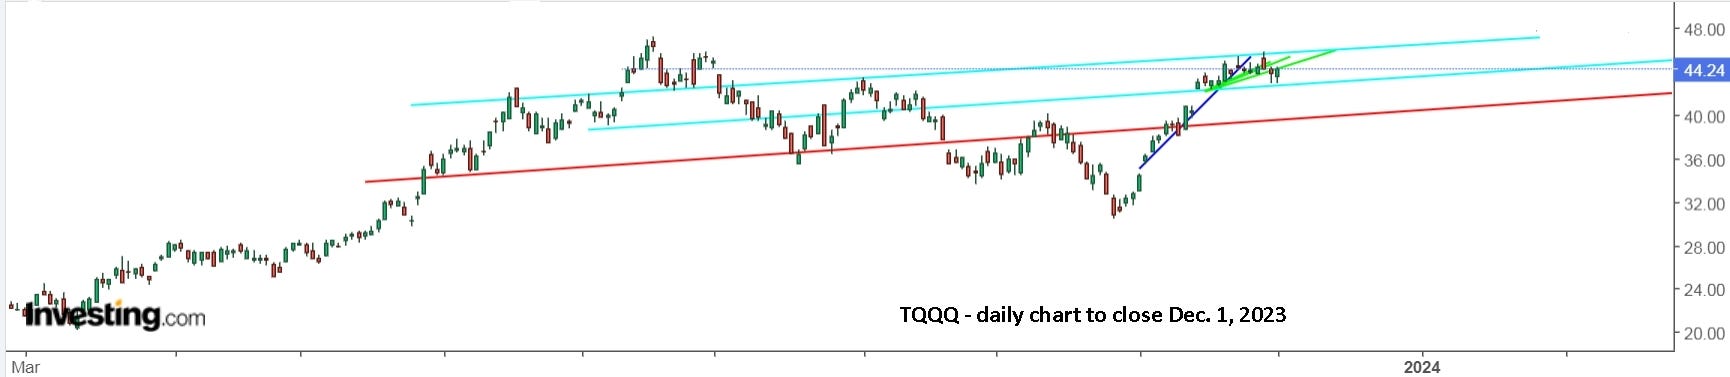
When the upper blue line was nearly touched on Nov. 22 and reversed sharply, that gave it extra credibility, so when it was touched on Nov. 29 after a big gap up and rally, it made complete sense to sell and put in a stop re-buy higher. Note also that the steep dark blue line was expected to be broken. I drew the lowest light green line as more likely support and later added the other two.
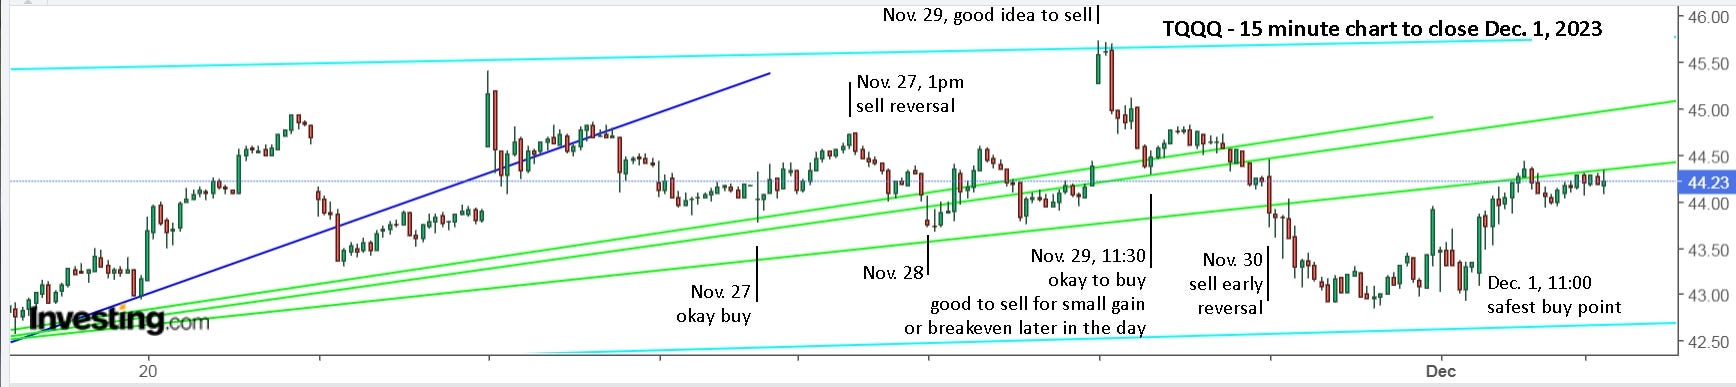
If one had sold on Nov. 22, then the upper light green line suggest you buy again on Nov. 27. It spiked higher at 1pm and reversed, falling the next 15 minutes and continued to slide, so best to sell and take the win, and certainly sell later when it dropped sharply at 2:30. My strategy is to buy early in the day at support with upward momentum. If that momentum is lost later in the day, head back to the sidelines.
On Nov. 28, it fell near my lowest green line and rallied, so buy, and again sell at noon when it turned red at 11:45 and continued red. When it reversed at 1:15 near the low support, it made sense to buy again. Basically, I want to buy and hold, but I’m remaining cautious and selling when upward momentum is lost. With extra upward momentum late, it made sense to hold overnight.
With the large gap up open on Nov. 29, I was ready for an immediate reversal. The rally up to my light blue resistance line, gave me a lot more confidence to sell and put in stop buys higher. Buying at 11:30 as it rallied from the middle light green line was a reasonable decision, then best to sell when momentum was lost. Buying late in the day is rarely a good idea and always risky. If you did buy then or early on Nov. 30, then you needed to be stopped out on the drop.
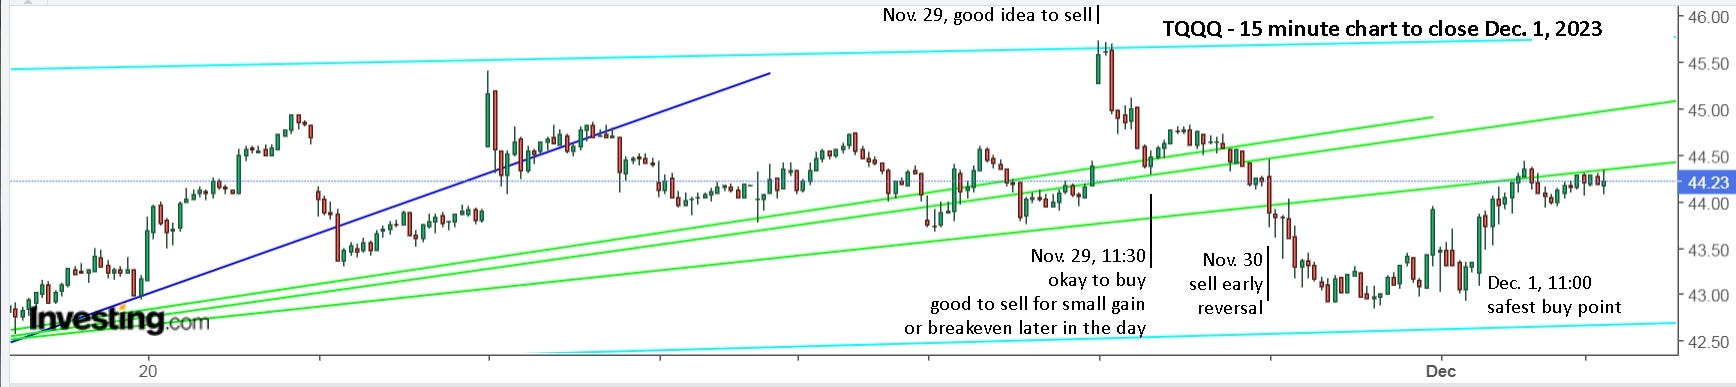
Buying as it held above support on Nov. 30 may seem reasonable, but it’s really better to remain cautious. Remember also that it has made a monster move up in November and a pullback would be healthy. These lines are all still very bullish references. Buying early on Friday when it reversed from support was a much safer bet, and holding over the weekend is also reasonable. Whether you’re currently holding or on the sidelines, these lines have proven useful and trustworthy.
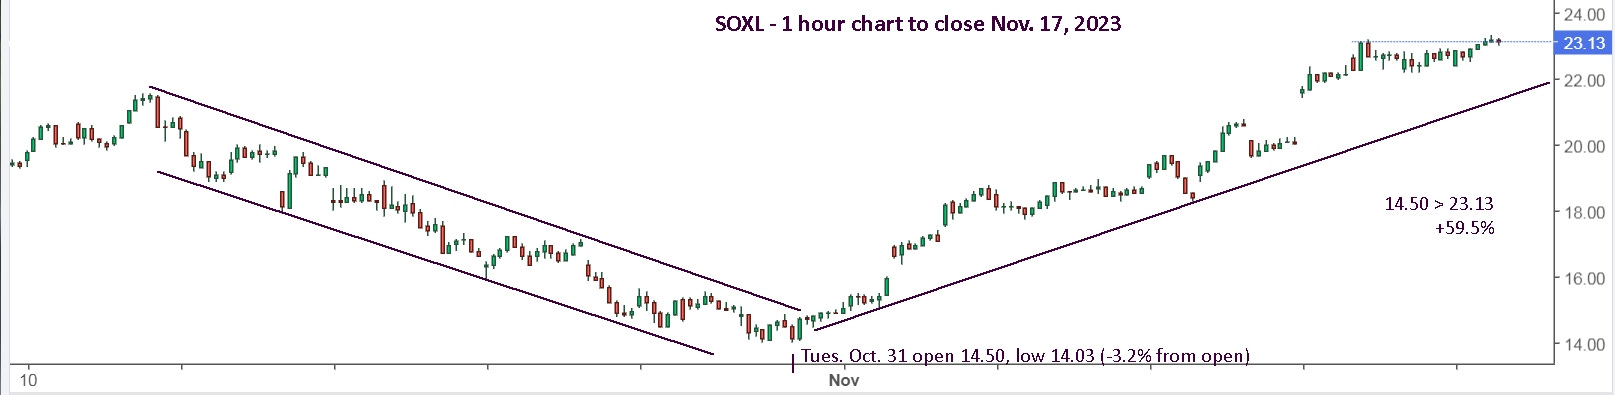
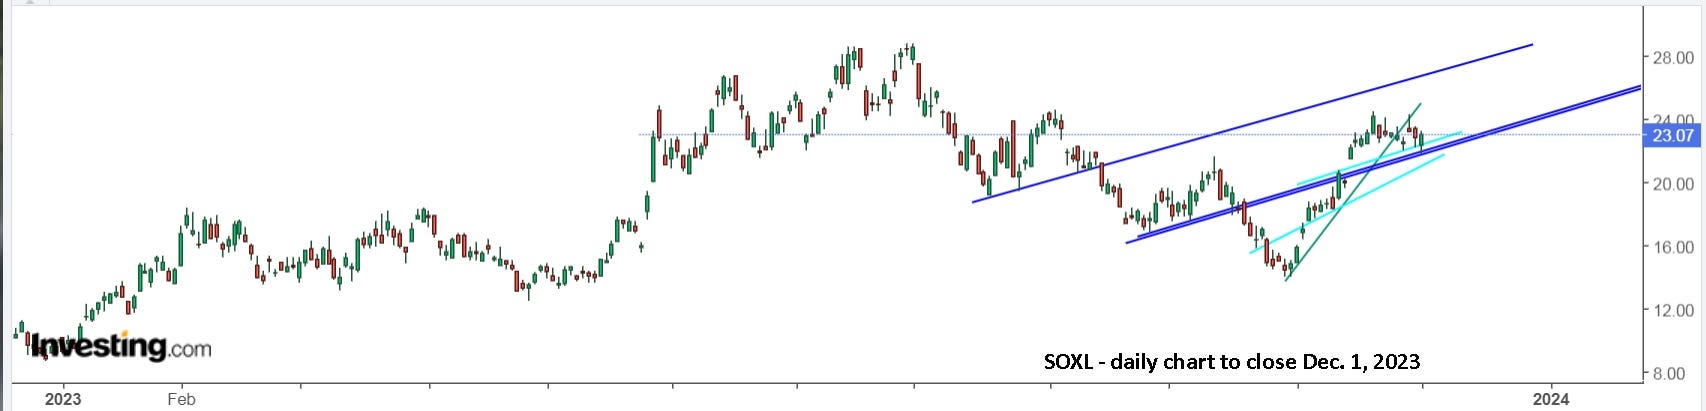
For reference, here’s a look at the daily chart for SOXL with my trendlines.
Update to Fri. Dec. 8: That was quite a week! The gap lower and drop needed to have you selling quickly. The light blue support line was broken on the gap and the dark blue support line was hit in 30 minutes, rallied and fell. Don’t be too quick to re-buy off the dark blue line, let it move back to the light blue line which will now be resistance. Once it reversed near the lower light blue line, you could buy, but it’s easier to continue waiting to see whether the bears or the bulls are going to win.
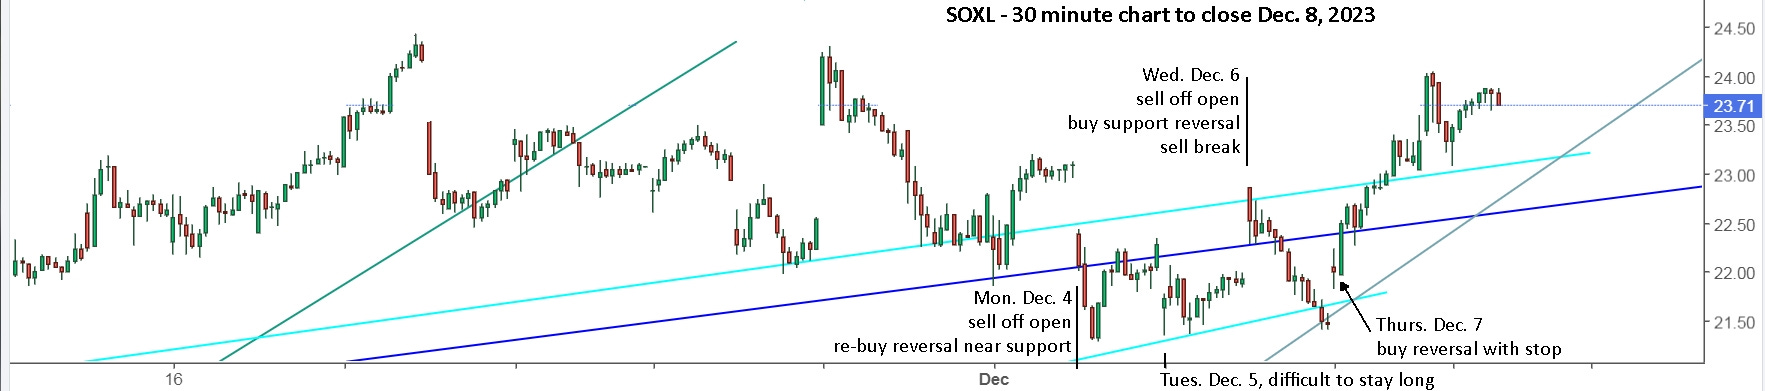
The big gap up on Wednesday had you ready to buy, and you could have also been ready to go short with UVXY or SOXS. SOXS turned out to be a great trade on the day. With it at your final support line late in the day, best to take the win and get back to the sidelines. The gap higher on Thursday had you ready and then buying SOXL. I chose to sell SOXL at the high on Friday, bought the pullback and sold again to be safe.
TQQQ also broke support and needed to be sold on Monday, re-bought, sold early Wednesday and bought early Thursday. Holding over the weekend would be a reasonable decision, but I decided to sell and start the week with a clean slate. I also wanted to get rid of the green lines which were no longer relevant and get a better perspective for going forward.
The new lines on the daily chart make a lot more sense than the old light blue lines that were attempting to pick points on the various time frame that were less steep.
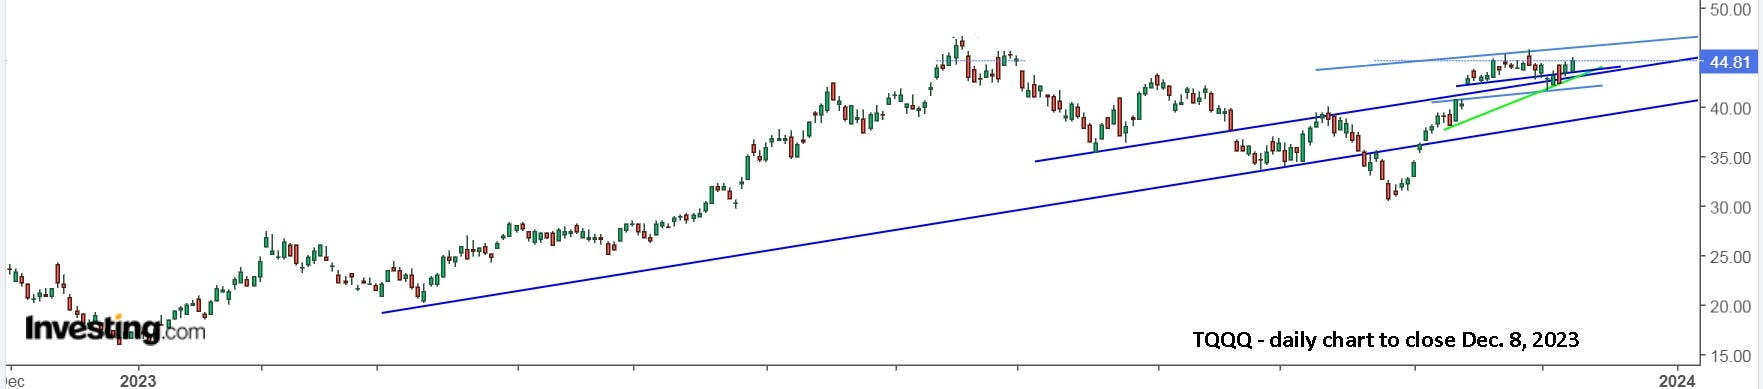
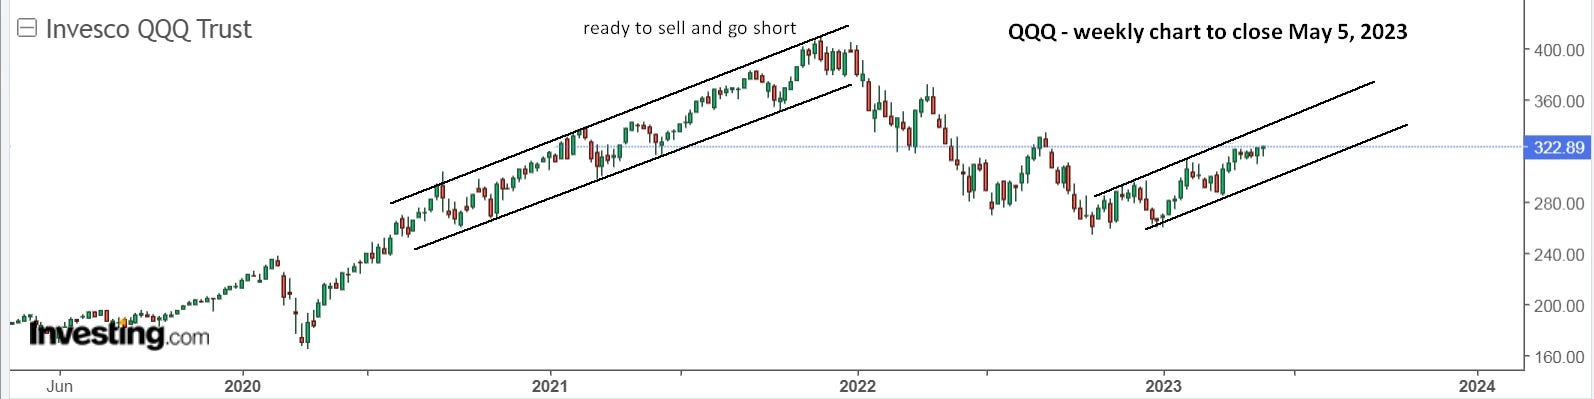
Now, it’s clear that these lines can go back for the entire year and make sense. That gives me a lot more confidence in their validity and using QQQ will provide a clearer view without any leverage decay. First, let’s look at an old QQQ chart from May. At that time, there was a lot of confidence in the rising channel that matched the one through 2020-2021. When it later moved above resistance, that’s when I started looking for a pullback.
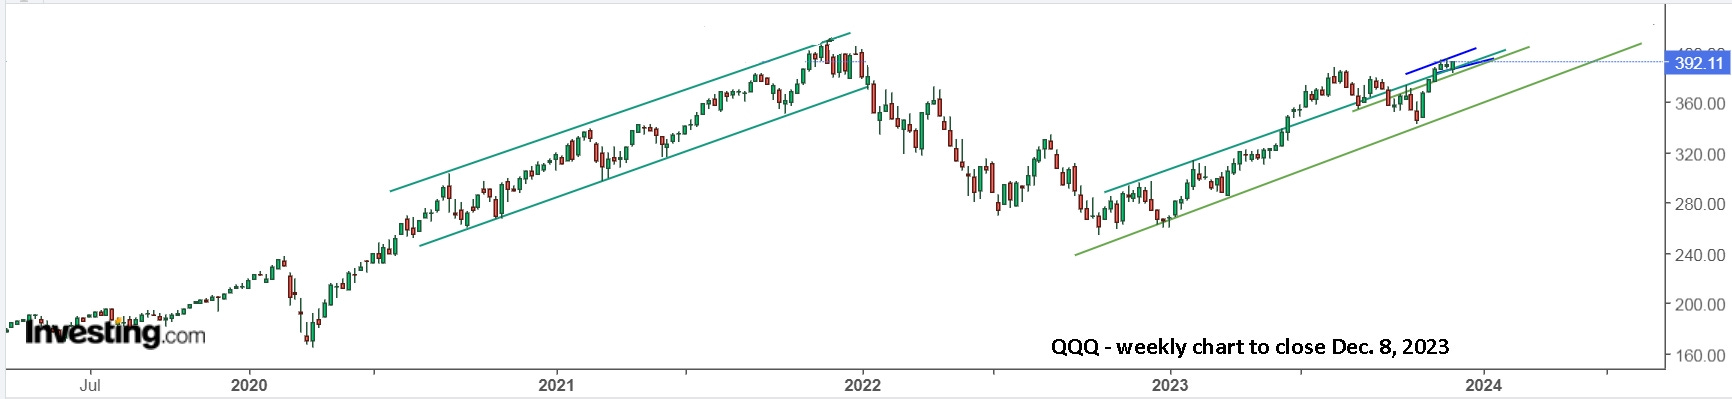
Those same weekly trendlines are still valid and seeing that support late October would have been really, really helpful. When doing other historical reviews, I have seen a stock stay in the left lane, like a passing lane, for an extended period and then move back to the right lane. More often, it’s like hitting the ditch and it quickly cuts back into the lane. Thinking the long drop this summer was the start of a new down trend, like in 2022, was perfectly reasonable, but the support line provided a clear view of the potential lane continuing up. The daily view shows that we’re close to the left ditch, or lane, and that’s why I decided to sell TQQQ on Friday.
Note, the ‘width’ of this channel is about a 9% drop and 12% rally. Following the main upper trendline gets to 400 the end of January, 2024, a tiny 2% gain from Friday’s close. The lower trendline then is about 365, -6.9%. If you’re a card counter at the Black Jack table in Vegas, the deck is ‘light’ and you’d be making minimum bets. Here’s an hourly view and you can decide when to take your money off the table.
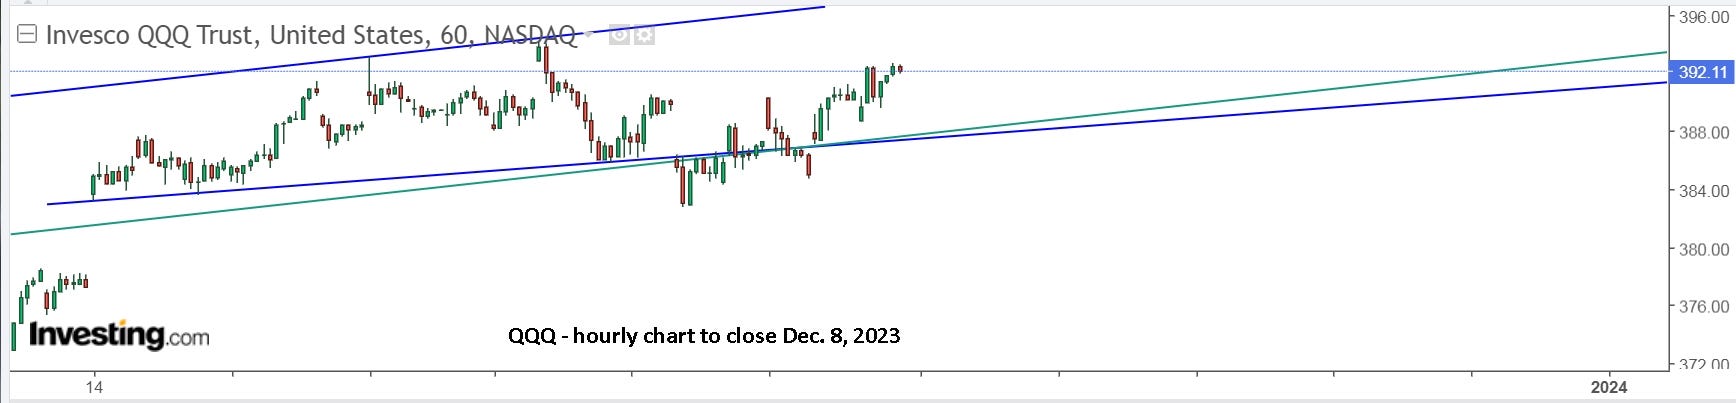
The blue support trendline is just on the hourly chart. The green line is the upper long term resistance line, that will now be support. The upper blue line should be firm resistance as it is parallel to the 2 main green trendlines and the share price was rejected twice already. I’ll be looking at a short trade with SQQQ if we hit that line.
Update to Fri. Dec. 15: In my last update I started with, “That was quite a week!”, and it was, especially with the gap higher and large drop on Wednesday to get you looking the wrong way. If you sold on Nov. 29, you may not have re-bought the following week as it was still choppy and below your sell price. After the Wednesday fake, Thursday and Friday were strong. When Monday, Dec. 11 also showed strength, then it was safe to get long again, with a stop sell as always. You might have sold on Thursday or Friday to play it safe, or you might still be holding. Both are reasonable decisions.
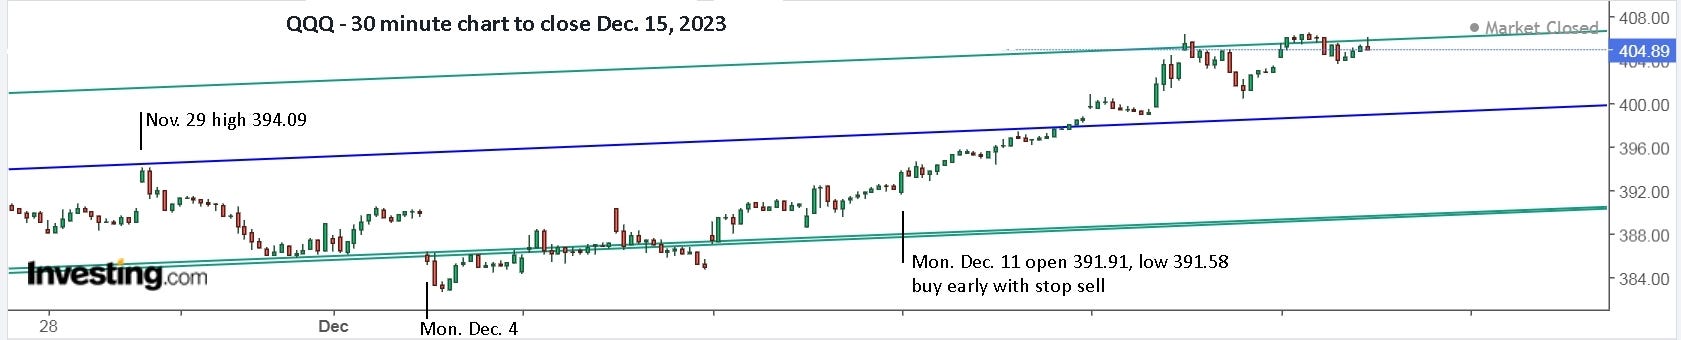
Obviously there is still plenty of upside potential and a steeper support trendline can now be drawn through the October and November lows. That would now be a key line for me. A parallel resistance line can be drawn through the Nov. 14, 15 and 20 highs, and if that line is hit and holds, then I would be ready to sell.
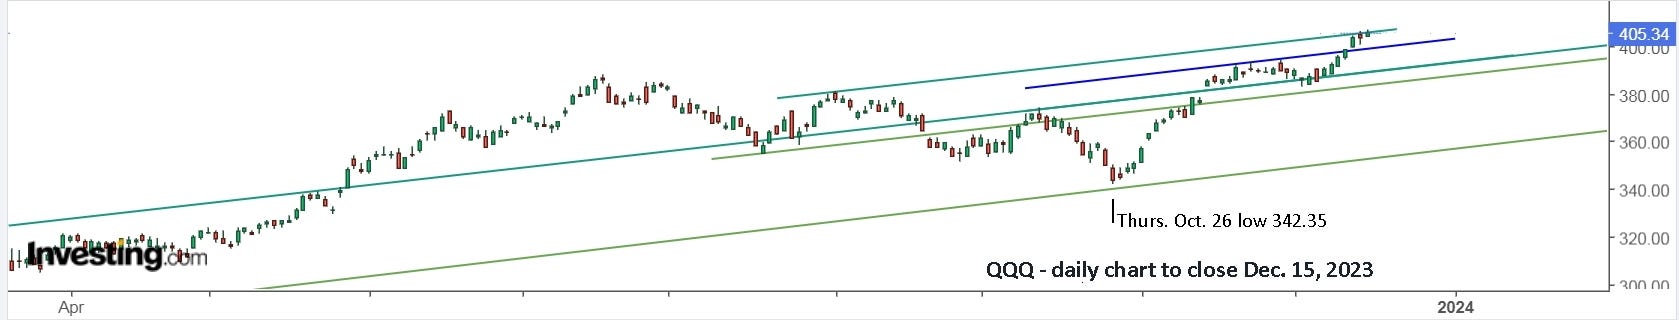
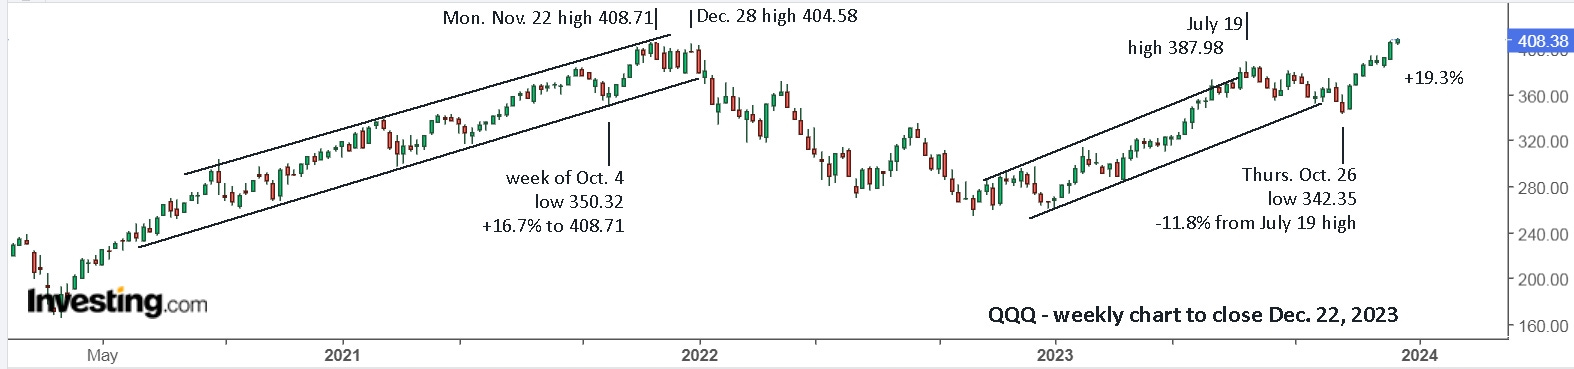
The weekly view shows that there is potentially a lot of upside left, and one could argue that there was no need to sell in July. Fair enough, the drop was ‘only’ 11.8%, but one has to apply the same argument to late 2021 when it also made sense to sell. The drop in 2022 was much more severe and the recent drop could have been equally severe, or even more severe. You simply can’t know in advance. It’s a bit like winter. You know it’s coming and it makes sense to be ready for it and have your winter tires on before the first snowfall hits. You can’t know in advance whether it will be a severe winter or not, but you know winter is coming and not being prepared is a bad idea. Happy holidays and I hope you’re now fully prepared for a profitable future with your investments.
Update to Fri. Dec. 22: I wasn’t planning to make another update, but last week had some interesting action that will be interesting to have saved. The hourly chart for QQQ/TQQQ shows how games get played that can knock you out of a trade. Wednesday, Dec. 6 was a sell early as it gapped higher and fell. The re-buy on Monday, Dec. 4 after the early reversal was made cautiously and the re-buy early Dec. 7 felt a little more promising. The open and noon lows on Fri. Dec. 8, along with the open on Monday, Dec. 11, provided the start of a clear uptrend. Waiting to buy Monday, Dec. 11 at open/low 44.61 or on a stop higher was completely reasonable.
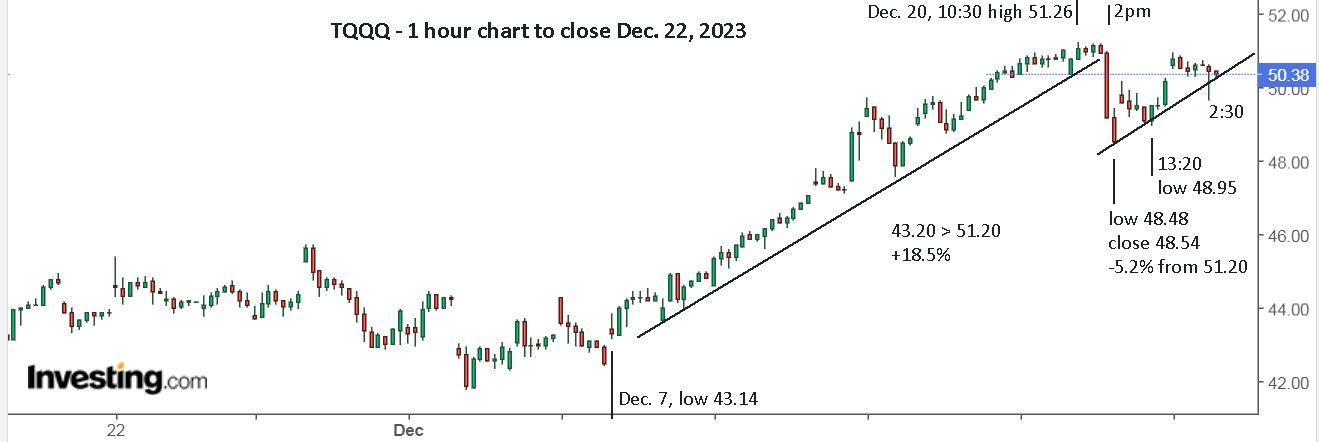
On Wed, Dec. 20, after hitting a high of 51.26 at 10:30 and holding flat for several hours, I decided to sell and put in a stop buy at 51.33. Apparently, the sudden move at 2pm was caused by a huge number of 0DTE (Zero Days To Expiration) options being traded. These are option contracts set to expire at the end of the current trading day, meaning the value of a 0DTE option is entirely determined by the underlying asset's price movements on that day. Buying back long at the end of the day was completely risky unless you knew what was going on, and even then it was still risky. Now there’s a new parallel uptrend line and you may or may not have already bought back your TQQQ position at a discount. A weekly view suggests continued caution, so enjoying your 19% return in QQQ or 62% with TQQQ and sitting safely on the sidelines is also a great place to be.
Update to Fri. Dec. 29: I might as well close out the year with a final update and you can start the year with "Make 2024 a year of change!" Before I show the QQQ chart to close out the year, I’d like to go back to show how incredibly useful and supportive these trendlines can be.
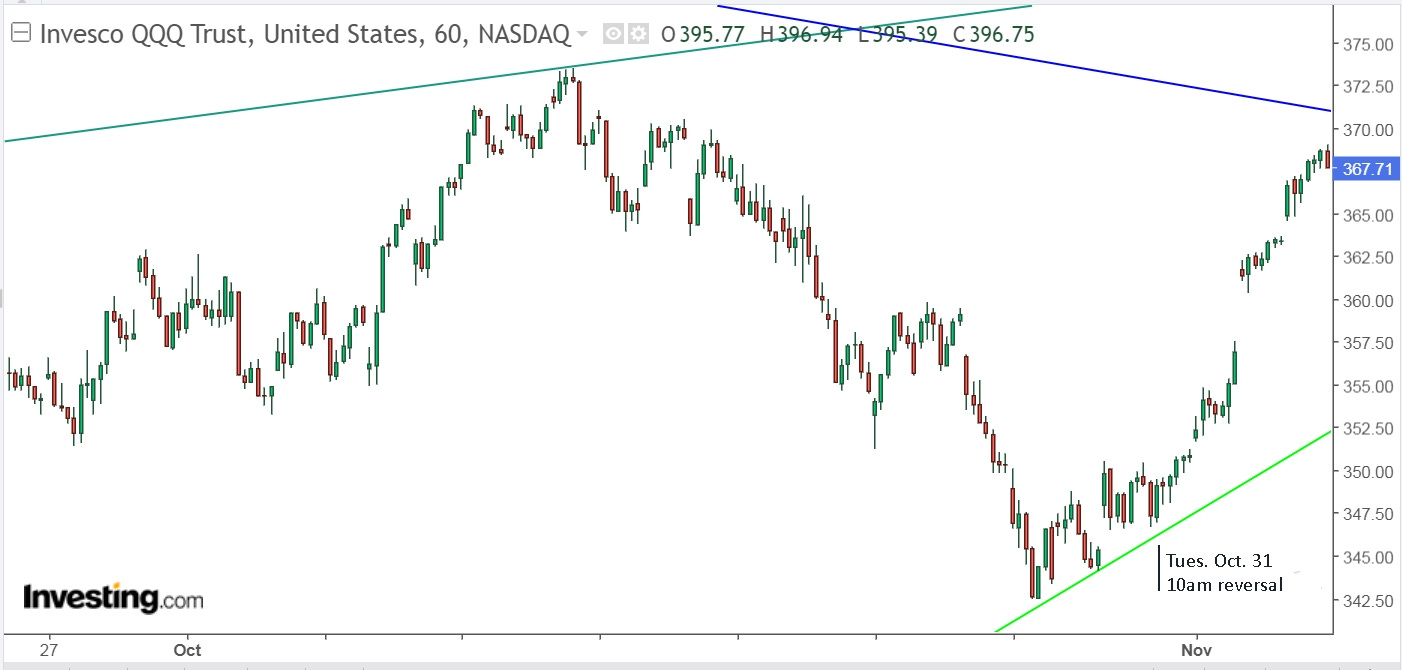
Remember that I noted the higher low and higher high on Friday, Oct. 27. Without seeing that light green line, I was still worried about a drop. Seeing that line, and trusting it, has me buying the 10 am reversal on Tues. Oct. 31, and confidently holding it Wednesday. With the line, I can ignore fears about the FOMC meeting or anything else.
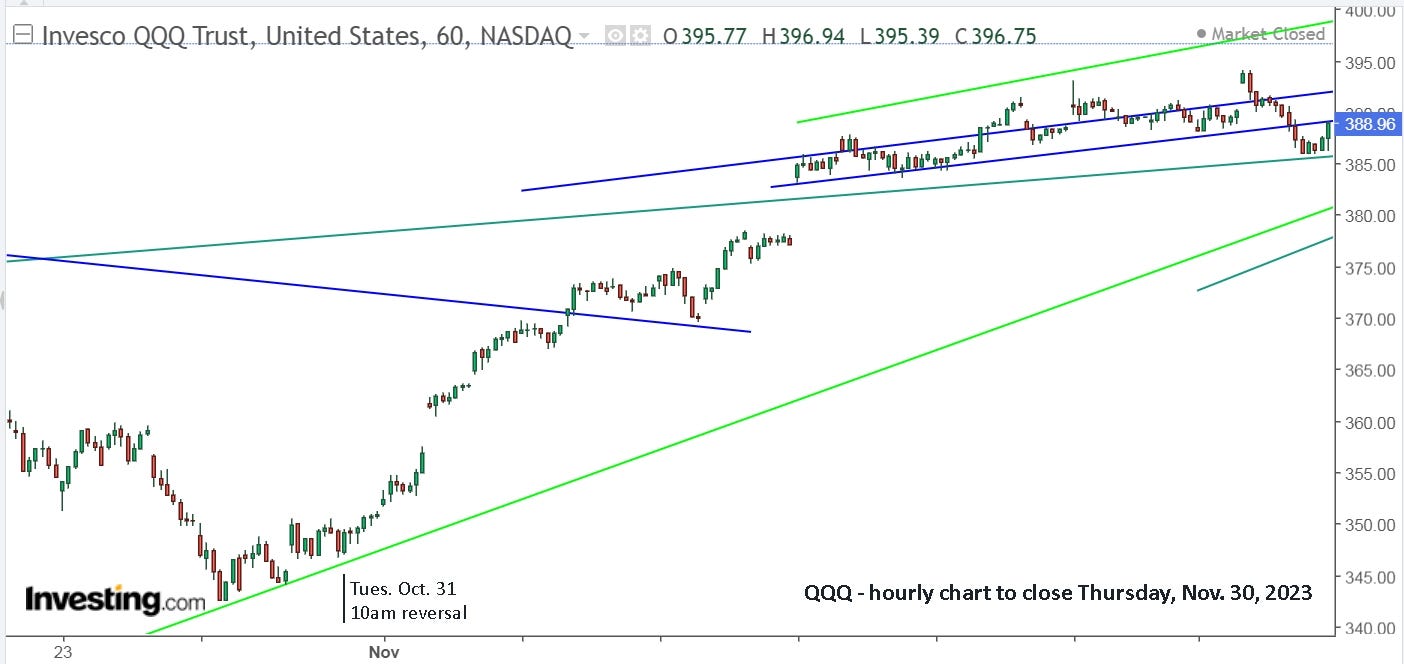
You didn’t need any lines to tell you it had gone “too far, too fast”, but without any lines, it’s like an aerial view of footprints in a field of snow. The lines act like a fence to keep the lost footprinter heading in the desired direction. They also allow you to comfortably let your position ride and slowly get back to support without a drop.
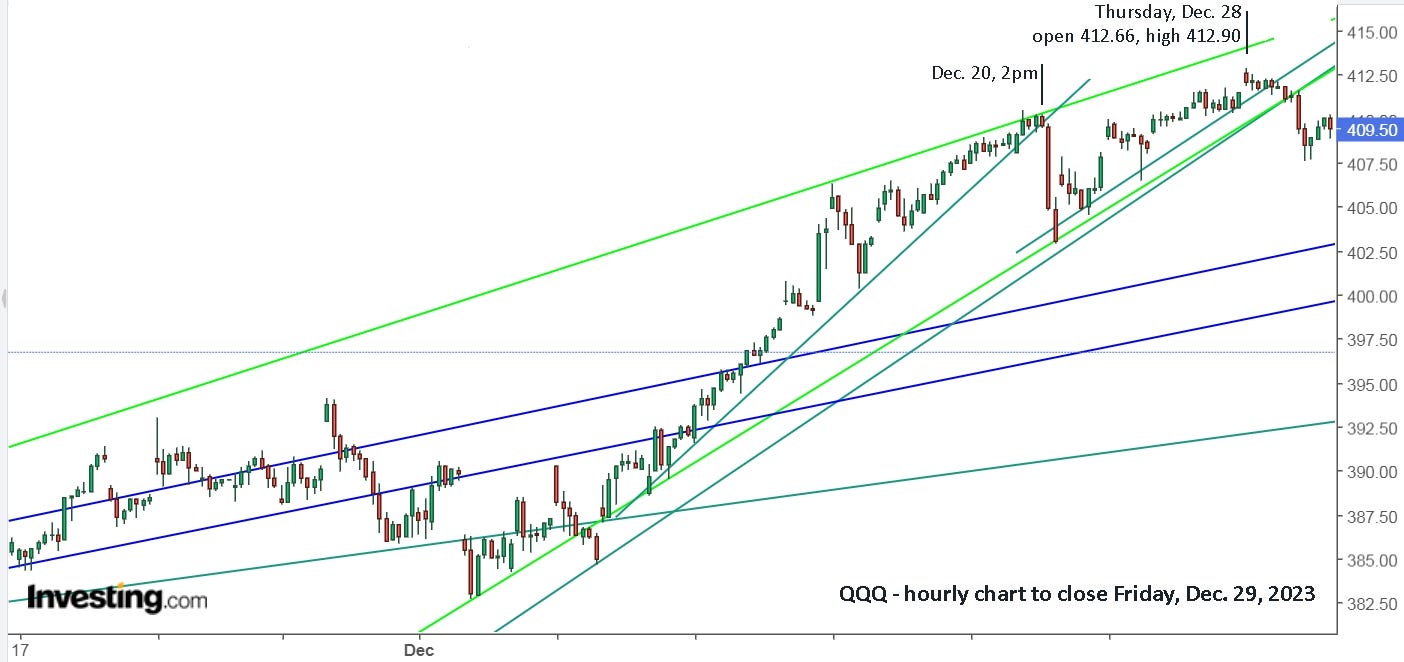
A steeper line had me selling after 1pm on Dec. 20. I mean, why not? Take the win! Sure, it might blast higher, and you can set a stop buy higher, but with lighter volume over the holidays, it’s much more likely to take a trip down. At the end of the day, I called “BS” and bought back SOXL which made the same drop. Then sell early the next day as it fell, and wait to see what’s really going on. Once it hits the green line and pushes back up, might as well get back on the bus. When it gapped higher on Dec. 28 and started falling, I headed for the exit at 412. Again, why not? Take the win! For sure you needed to sell on Friday, Dec. 29 and then stay out. Now, a sneak peek at 2024.
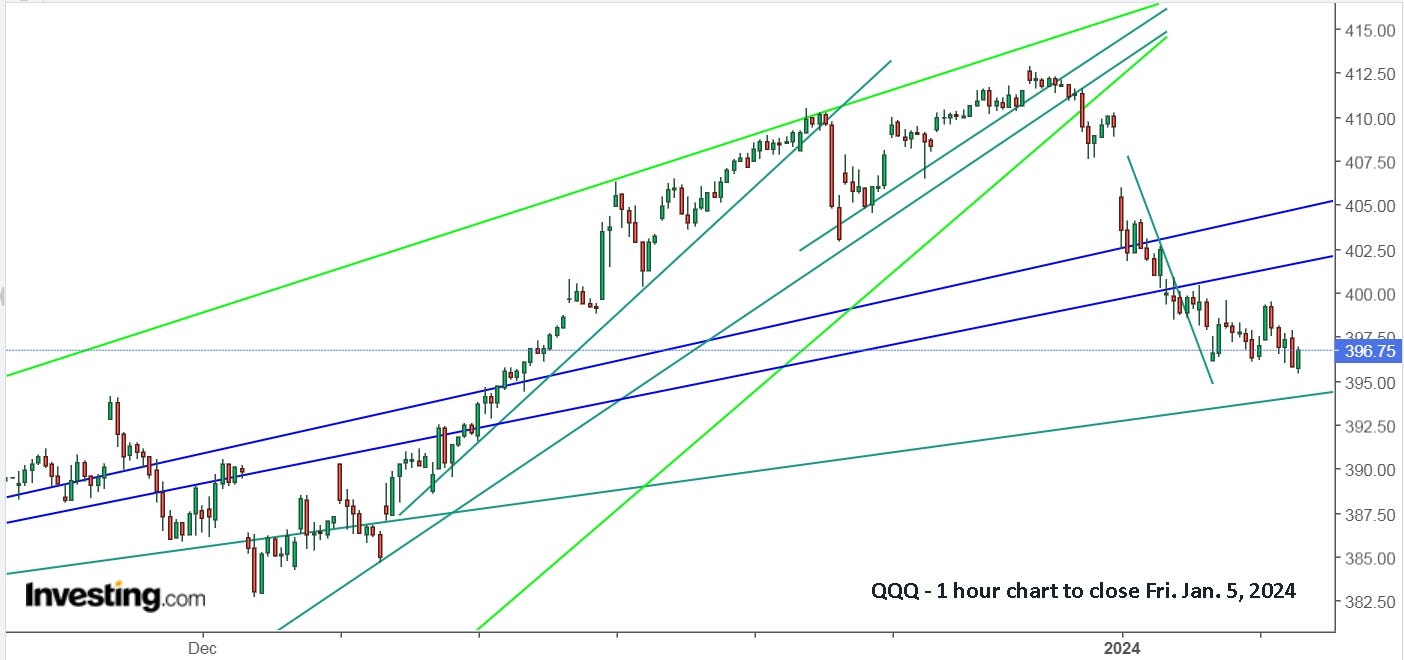
Now, get drawing your own lines and make 2024 a great year!
I appreciate the various long-term and short-term charts, but I have found focusing on a daily chart for trends of the past 3-10 days is the most productive. You can catch many swings while waiting for long trends to confirm. For instance my IWM trendline was broken with a bullish move up on Wed and confirmed at open Thurs.
In addition, the "too far, too fast" is more of a cautionary guideline, not a reason to sell or short and not a reason to enter UVXY. Simply wait for a pull back and look for the uptrend to break. It could be like 2021 and go on for a year. Don't guess or predict. React to trendlines.
I have backtested years of IWM and QQQ to prove simple trendlines can have CAGR of 70-110%. It simply means buying a break of a downtrend then selling a break of an uptrend. In addition, always sell for a loss of maximum 1% if it moves against you. The key is being out for 80% of the drops, and being 3X leveraged for 60% of the gains.
SPX broke down to 4103 last week, so maybe a little lower. There "should" be a bounce for a week or two, but why guess? Wait and see if the downtrend gets broken and jump on for a ride. Then stay on until the trend support breaks. Avi may be wrong about 2022 lows.