

DJIA - 100 years in 10 minutes
Remarkable lessons to be learned for planning your investment future.

“Time is money.” It’s a common expression, but actually time is much, much more valuable. Spring has arrived and if you have faltered on your New Year resolutions, then now is the time to turn over a new leaf.
In December, 2023. I went on a bit of a writing binge. “Unraveling the mystery of investing.”, “Make 2024 a year of change!”, “$10k + 10min/wk +10yr = $1M”, and finally “TQQQ/HQU - Leverage can be a useful tool.” on Jan. 15. Since buying TQQQ at the open on Monday, Jan. 8 and following the strategy, you’ve made a return of 84.3% with 6 trades. Yeah, I know, it sounds impossible, but I’ve been saying it’s possible since December, 2021, when I wrote, “Are You Ready For The Next Market Crash?”, before Christmas, and on Boxing Day, “Give The Gift Of Financial Security Next Year.”.
Another common expression is “Better late than never.” and clearly, that applies to investing. I graduated university in 1986, quit my engineering job in 1990 and went to Australia to windsurf the waves. In 2009, I opened a Questrade account, ‘learned’ from ‘experts’ and lost nearly all my money over 10 years. In September, 2019, I opened a Wealthsimple account and stumbled along till I finally managed to rip the blinders off and see things for what they are.
This is a chance to rip your own ‘blinders’ off, let go of what you believe and start on a new path. After reading this article, you can decide for yourself what the next 5 and 50 years can be like for you and your family.
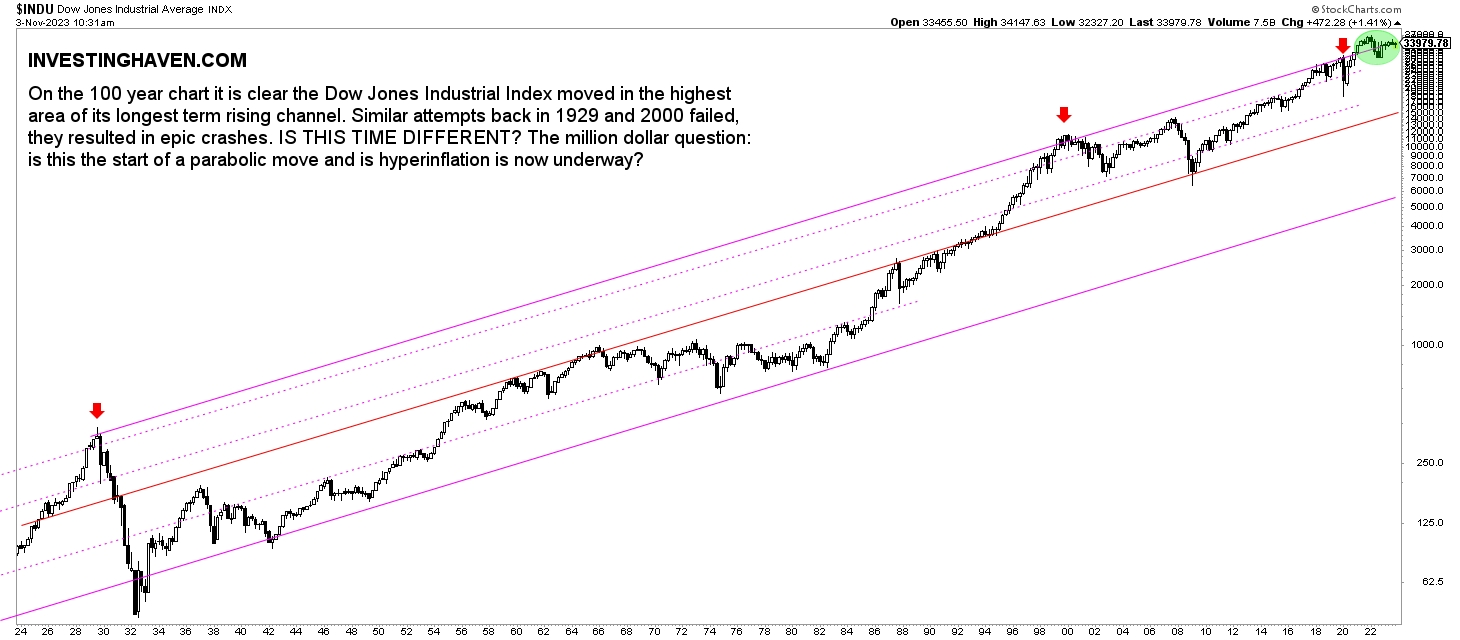
“Dow Jones Industrial Average (DJIA), the first stock market index, created by Charles Dow in 1896, is the oldest stock market index, covering 30 price-weighted Blue Chip Stocks across major industries. It’s a popular indicator of global market trends, and investors use DJIA indices to predict market trends based on the Dow Theory. Charles Dow first published the Dow Jones Industrial Average on May 26, 1896 and it consisted of only 12 companies.”
Here’s a look at 127 years of its history.
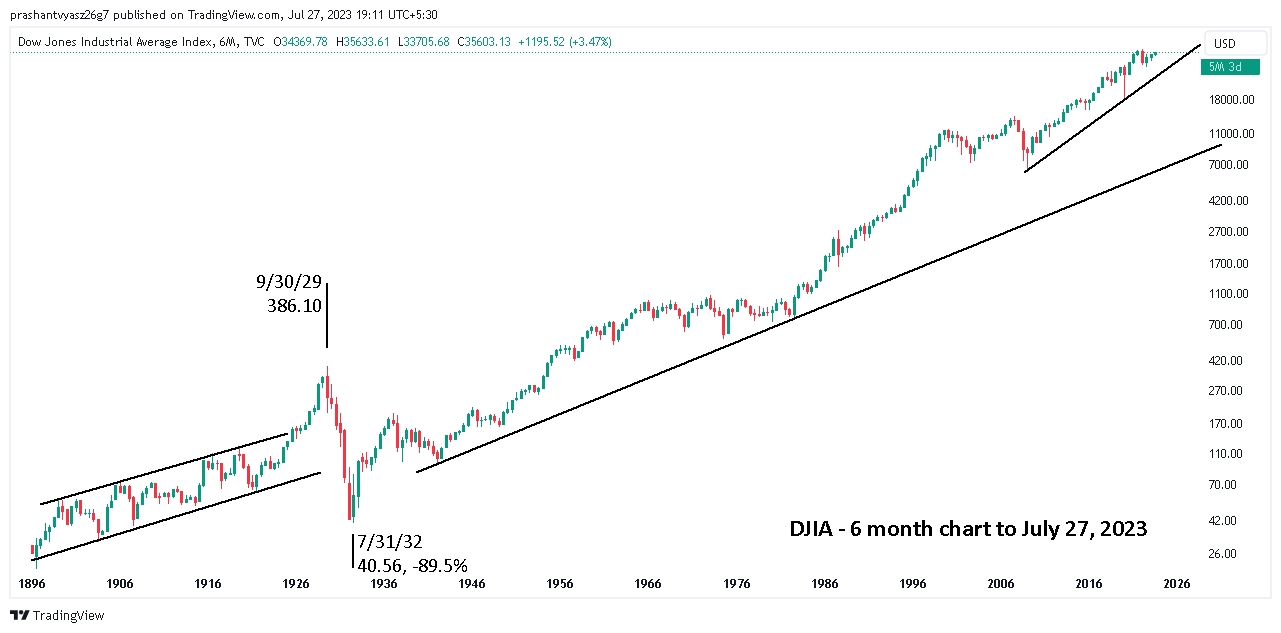
Note the trendlines. They’re the key to safe and profitable investing. Clearly, the markets were way, way over bought in 1929. In late 1999, it was similarly way over bought, and the tech sector drop was a lot more severe than the stodgy old Dow. By October, 2007, it was again reasonable to be concerned and ready for another major drop.
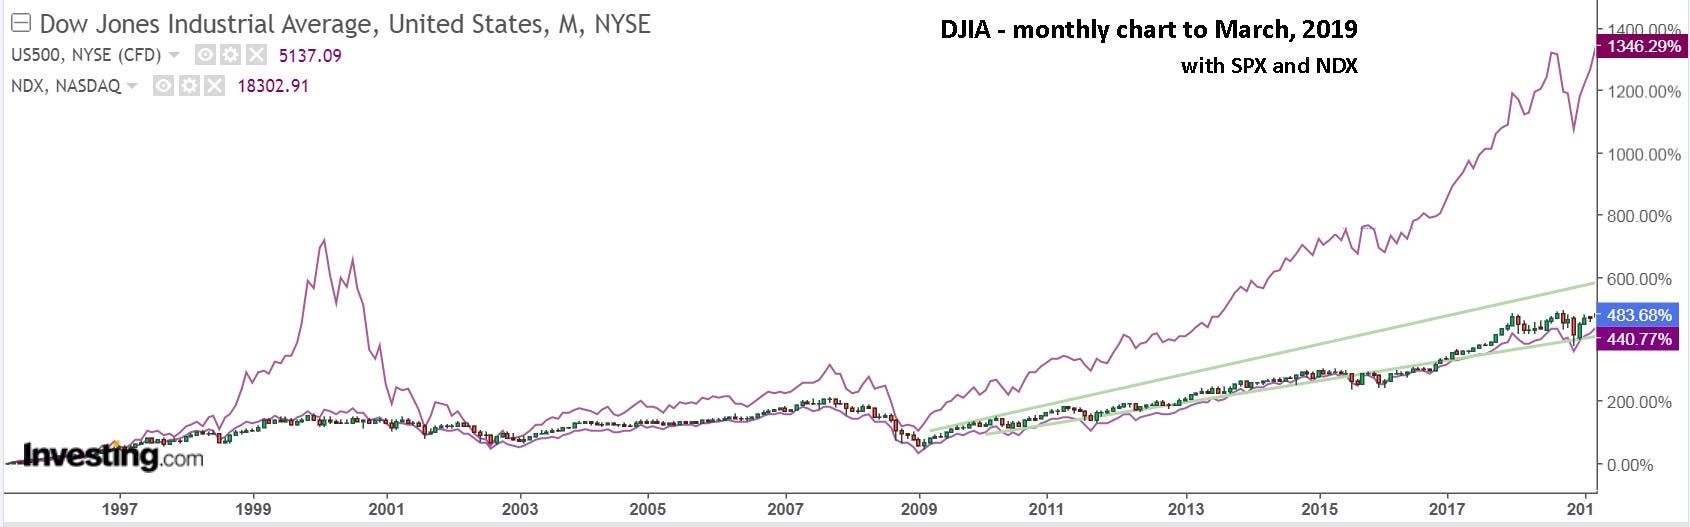
From the market lows in 2009, tech again massively outperformed the Dow and the S&P 500, and by January, 2018, it was wise to be ‘on alert’ and ready to sell. If you’re holding just one market ETF, it’s easy to sell with the press of a button on your phone. If you have a diversified portfolio, it’s practically impossible to sell everything quickly. Holding one market ETF gives you all the diversification you need, along with the ease of avoiding a crash with the push of a button.
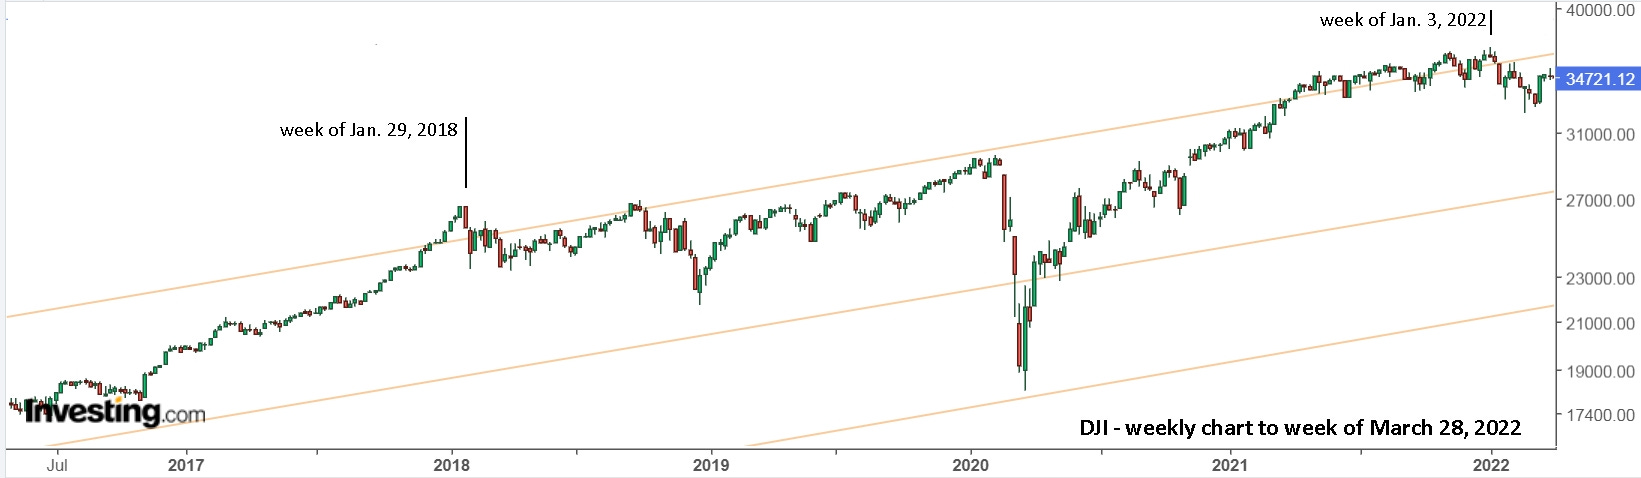
A weekly view shows the huge run up in late 2017 and burst higher to start 2018. Having the monthly resistance line on a log scale chart provides a crystal clear signal to be ready to exit before it possibly crashes.
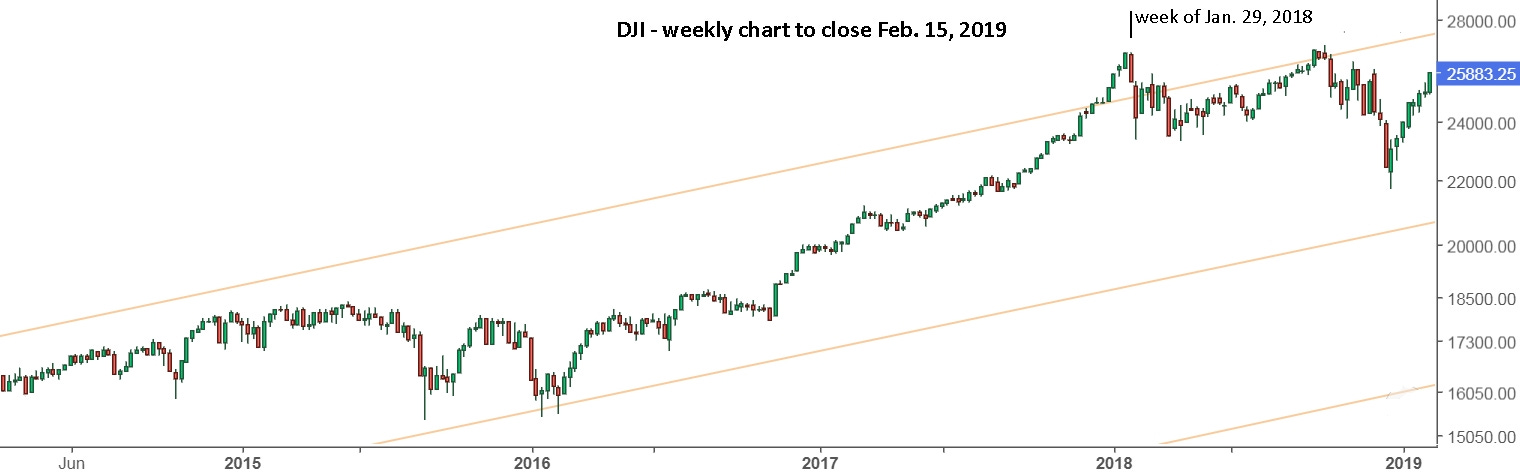
By September, 2018, it again broke resistance and had you ready to sell. Without the trendline showing on your chart, in advance, there was no reason to consider selling. With the trendline showing on your chart, you were watching and ready to sell, in advance. It’s really as simple as that. The key is to get safely on the sidelines before a major drop, then patiently wait for a bottom. If it had fallen to support, like it did in early 2016, it would have been an excellent signal to be ready to buy.
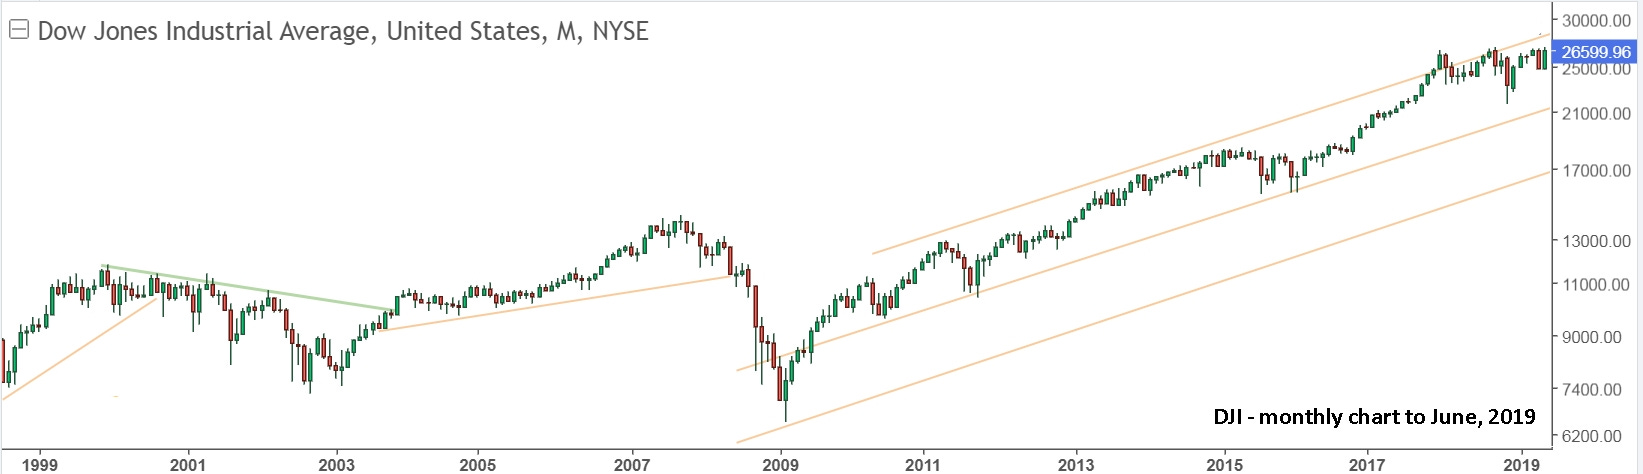
A quick look back to 2001 provides a perfect historical reference.
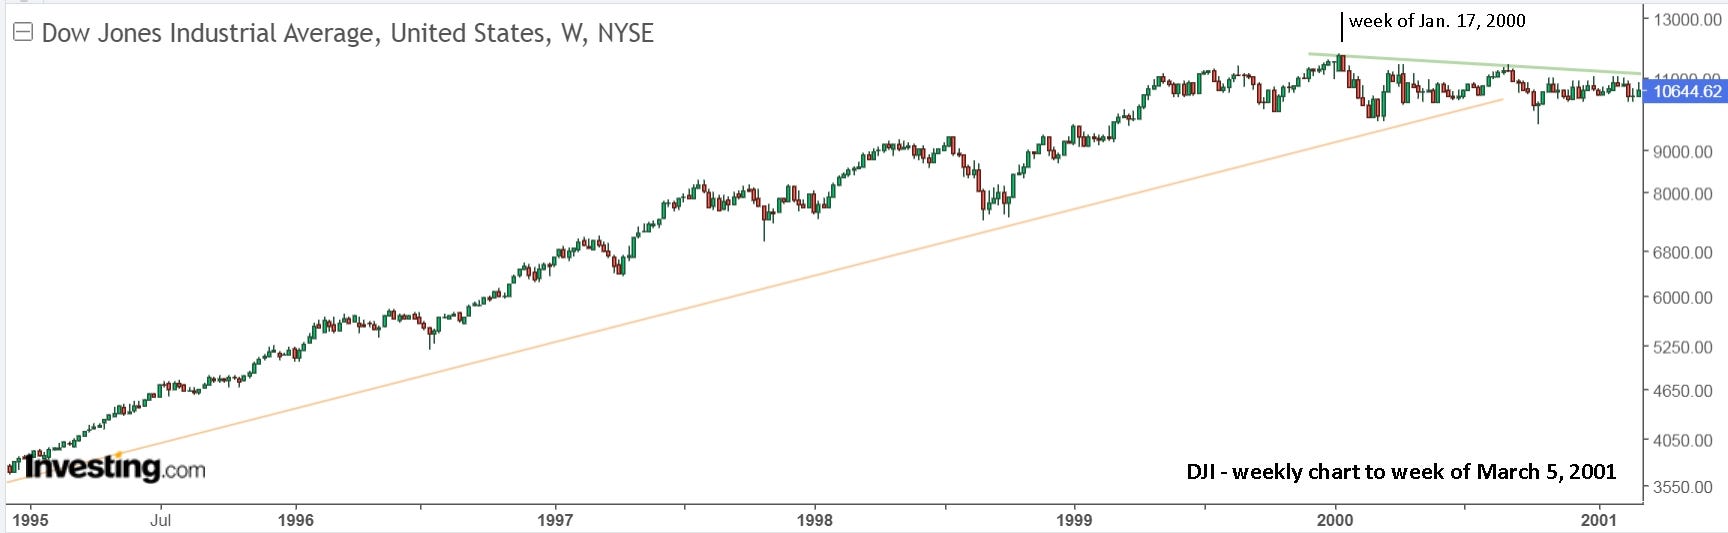
Everyone had a full year to take action and protect their investments, even their tech investments.
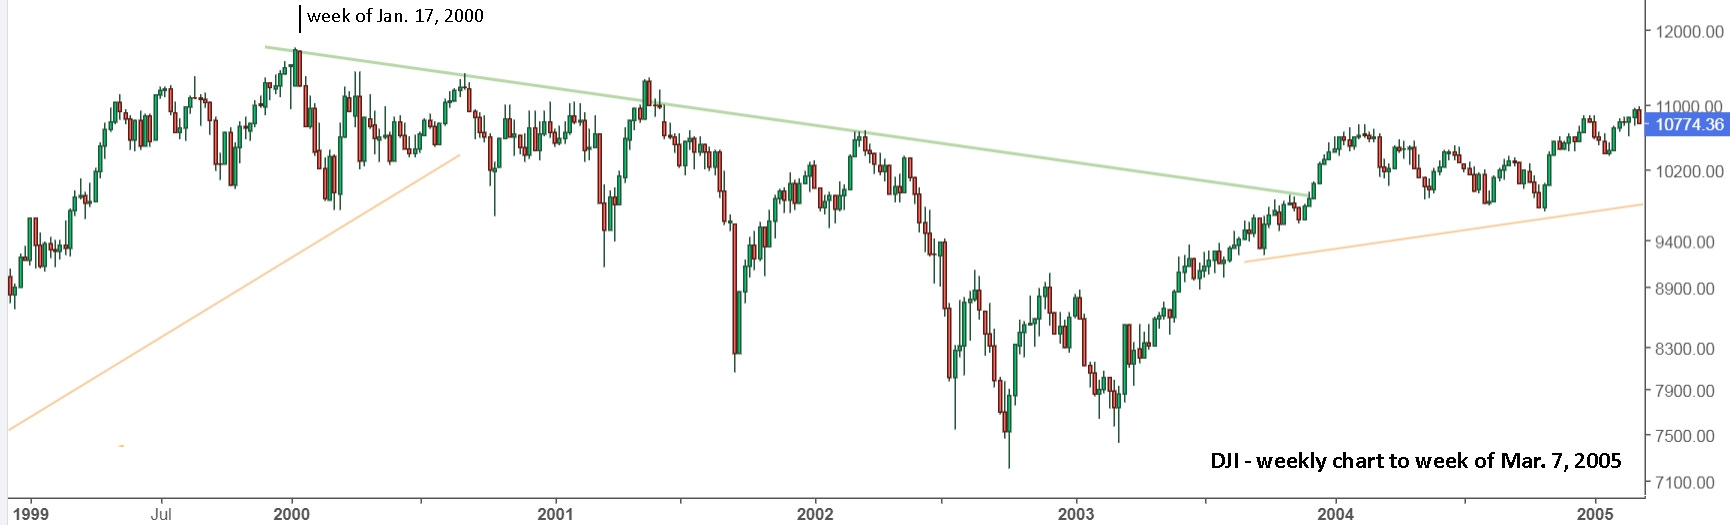
One would have hoped that in Aug. - Oct., 2007, people still remembered what happened in 2000 and were prepared. Or at least one would have hoped that your financial advisor would have called you and suggested taking action to be safe.
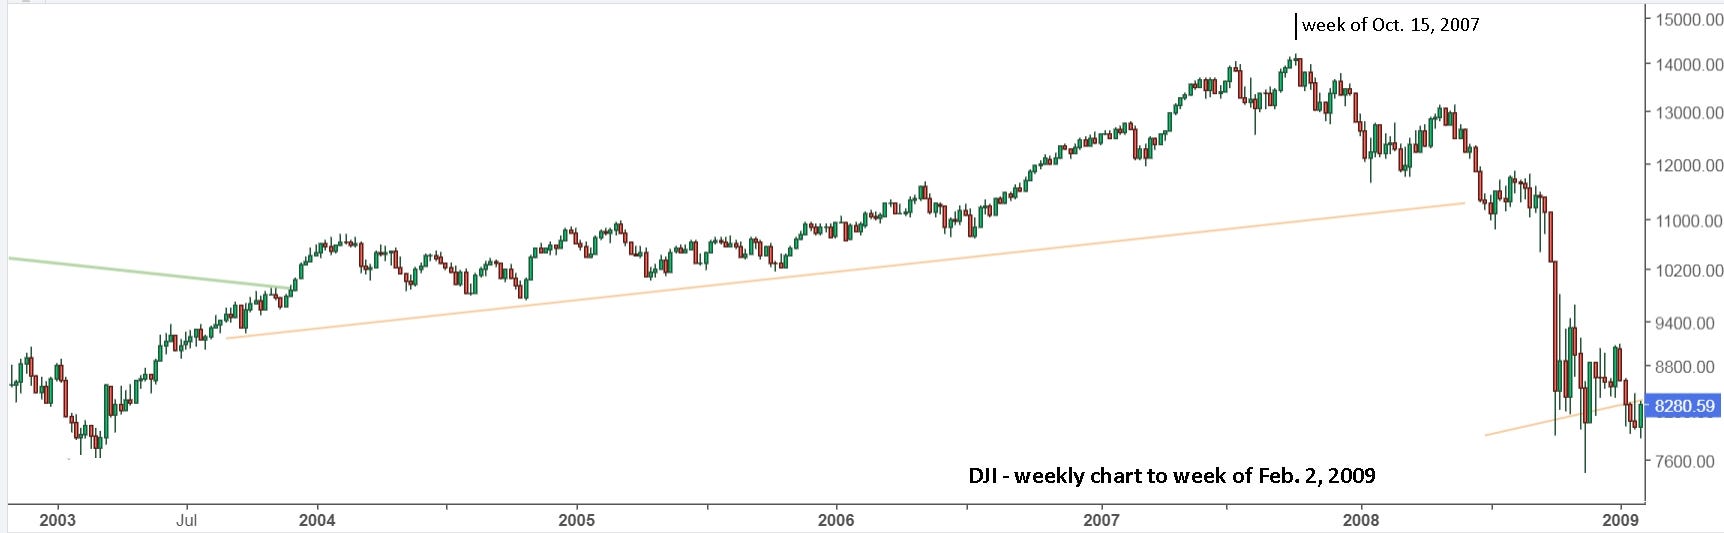
At the low in 2009, there was no trendline support suggesting you should be ready to buy, but it was back to the 2003 low. Horizontal support is always a potential bottom in a falling market, so it made complete sense to be ready to buy in 2009.
On the 6 month view back to 1896, it was still a long way above support and it could have continued falling like in 1929. Here’s an interesting inflation adjusted Dow chart from 1900 to 2023. This provides a valuable comparison to the other chart.
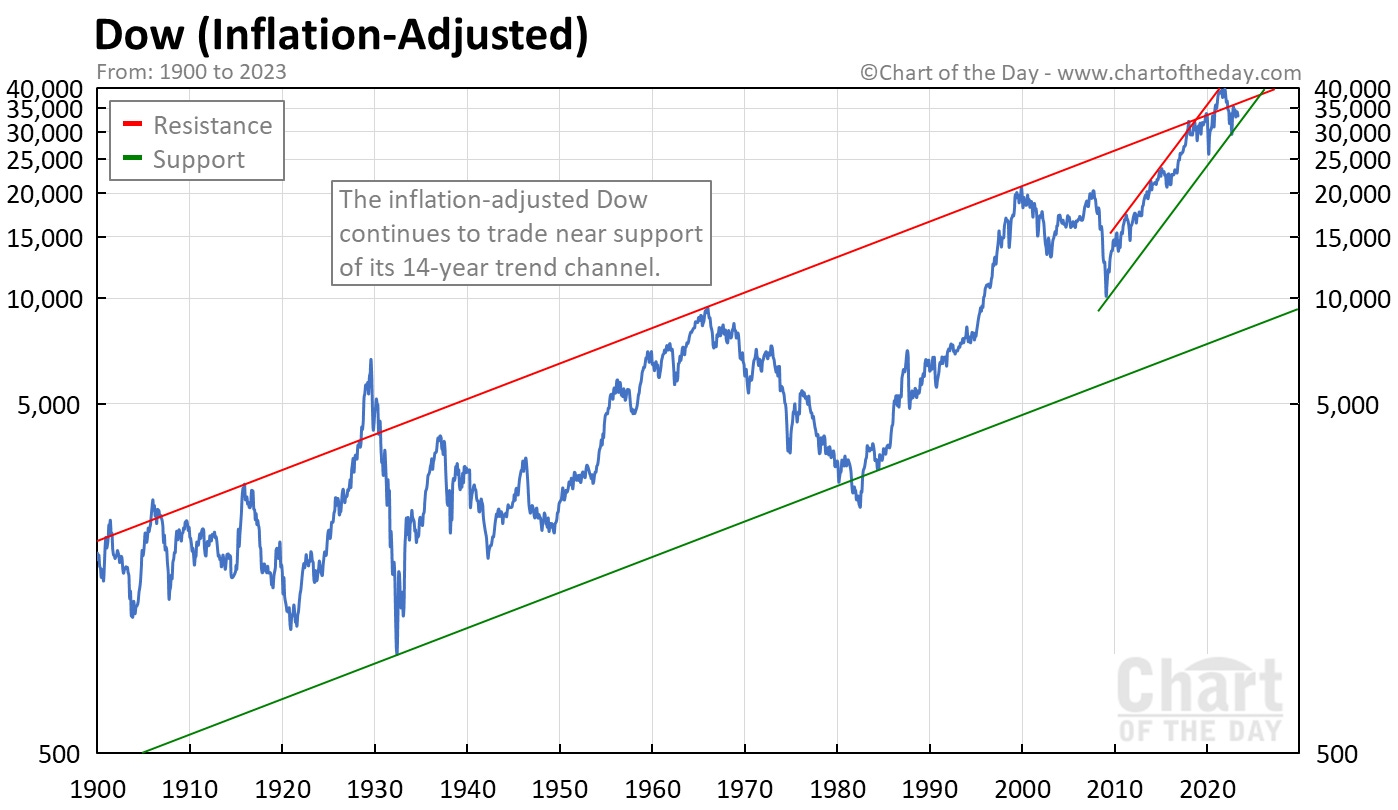

Notice that with the inflation adjustment, while the Dow held flat from mid sixties to early eighties, it fell back to support on an inflation adjusted basis. Both charts, and your own chart, had you ready for a drop in 2018, 2020 and 2022. Imagine, having that on your chart, in advance!
And look at the covid drop! It went almost exactly from resistance to support lines that have been on the chart for 10 years! With these and other trendlines, you were ready and looking for a drop in early 2020, ahead of covid. Covid was simply the trigger for a drop that was waiting to happen.
If your financial advisor didn’t contact you late 2021 and recommend caution with your investments, then it’s time for a new advisor, and hopefully you’re now realizing that you can manage your money best on your own.
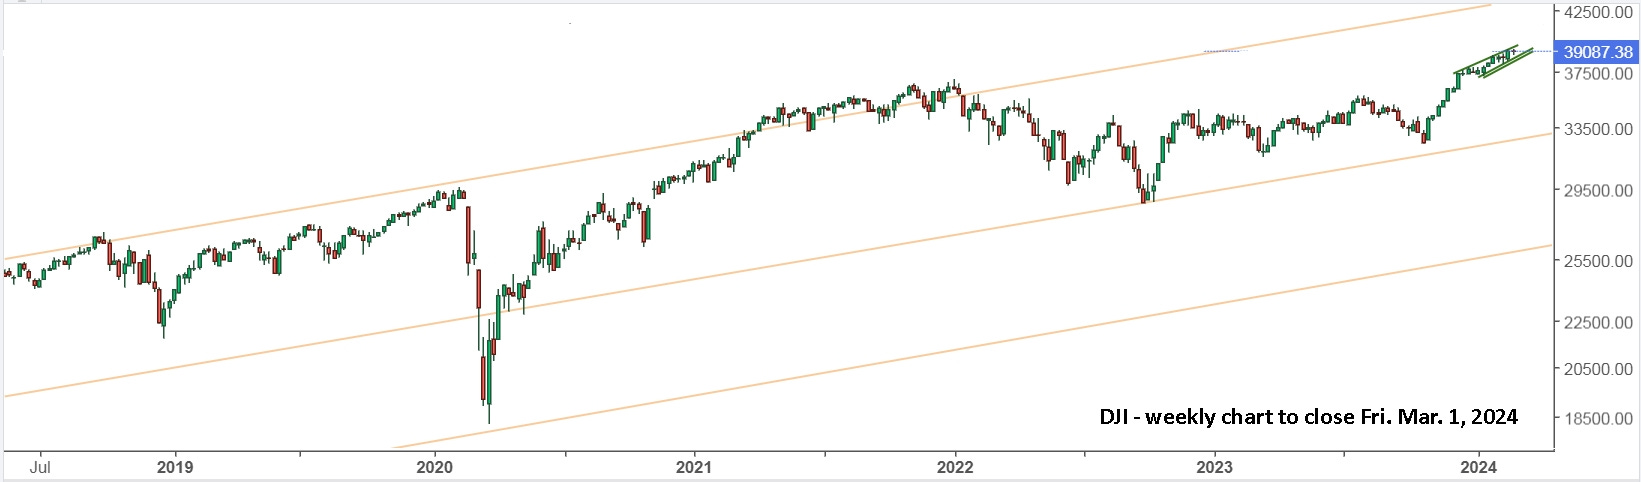
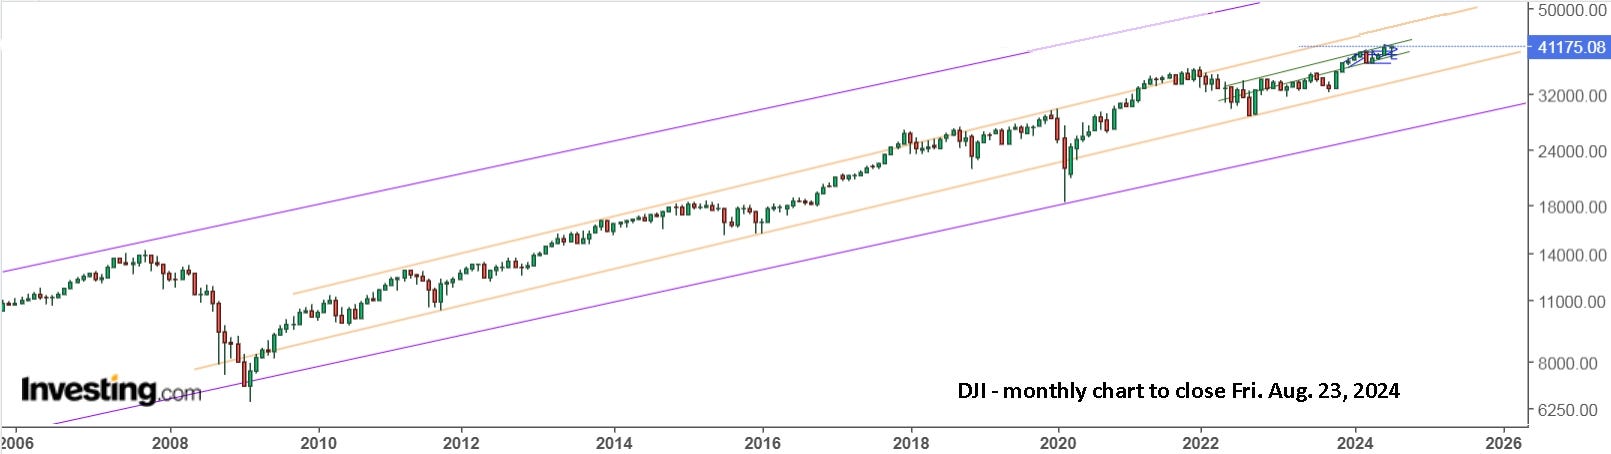
So, where are we now? The trendlines paint a pretty clear picture. Despite the massive move up since the start of November, 2023, there’s no urgent alarm signal for the Dow, since it’s only back to the mid-range of the channel. And notice how the middle support line was exactly hit in October, 2022. A line that could have been on your chart for nearly 13 years provided yet another buy signal.
Some are suggesting to “Get ready for a new Roaring Twenties”. “Are we about to experience another Roaring Twenties?” “The potential parallels are obvious. The Roaring ‘20s was driven by technological progress, occurring after a pandemic (the 1918 Great Influenza) and economic contraction. The New Roaring ‘20s would also be driven by tech progress, coming after a pandemic (COVID-19) and economic contraction (the Great Lockdown).” (James Pethokoukis, November 10, 2023)
Naturally, many others are predicting a 1929 style crash at any moment. I’m doubtful that will ever happen again, since “investors can't buy stocks on 90% margin as they could during the 1920s”.
Being afraid of a market crash in 1924 would have been a costly mistake for investors, just as fear in the 1990s had some people missing a major market boom. The best approach is to be cautious and ready to hit the exit when the time comes. Until then, enjoy the party!
Here’s a look what you missed if you had exited the market in 2018 or 2020 and stayed out. This is also no reason to stay invested all the time. Avoiding the drop in 2018, 2020 and 2022 was relatively easy, and it makes a huge difference in your investment account. I am certain the next crash will be just as obvious in advance, so you really need to be ready in advance.
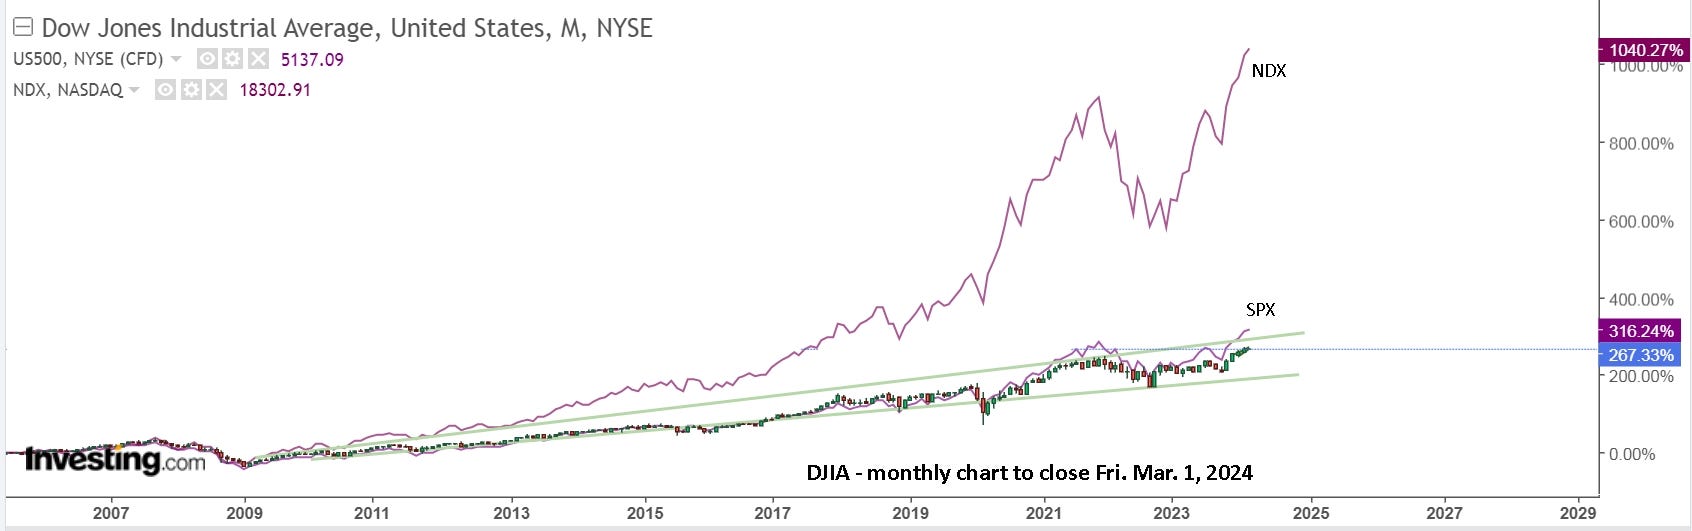
Hopefully you’ve decided you want to join the NDX party and not the SPX or DJI putt-putt party. And if you’re up for that, then read “TQQQ/HQU - Leverage can be a useful tool.” and see how buying TQQQ at the open on Monday, Jan. 8 and following the strategy, you could’ve made a return of 84.3% with 6 trades. Buying the reversal in late October and doing nothing has you up 107.2%.
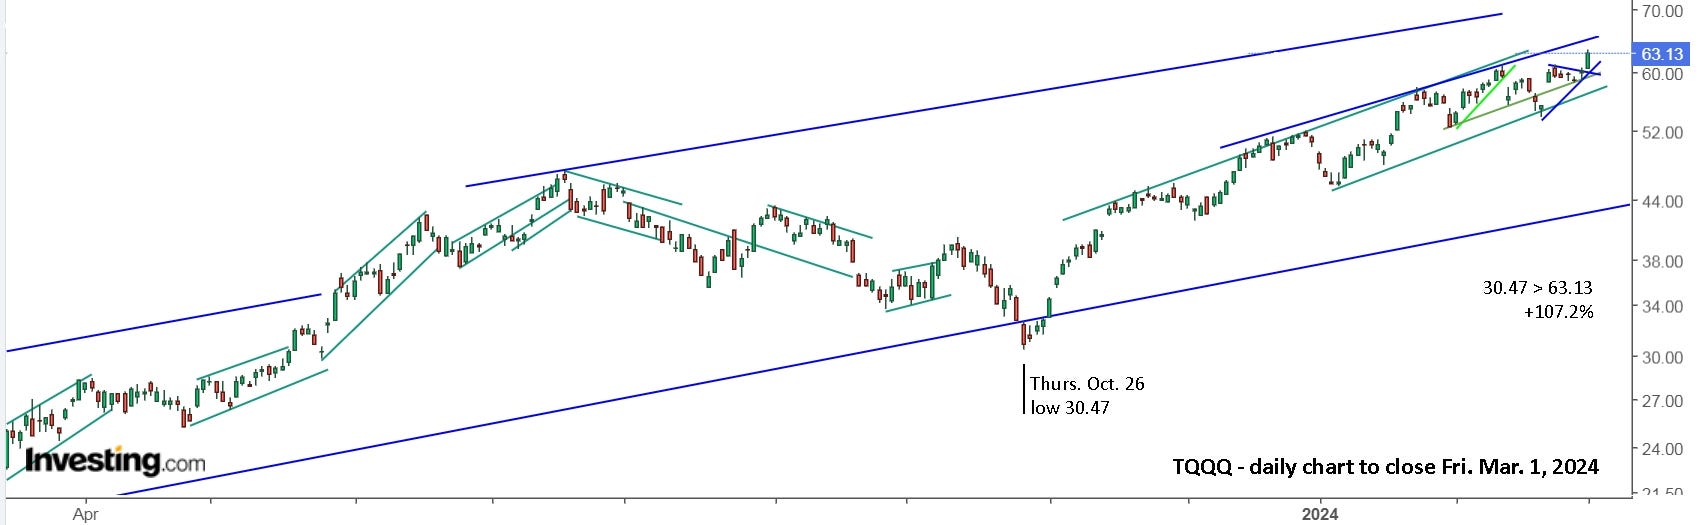
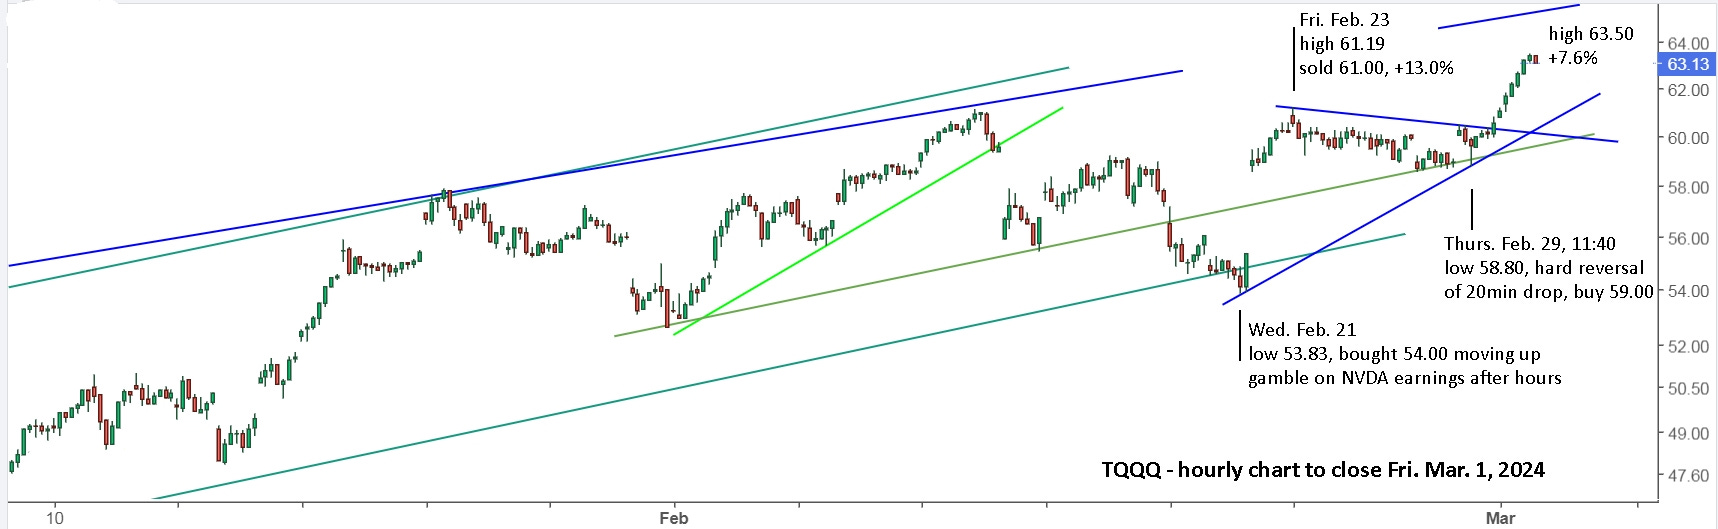
Obviously, you might be hesitant to buy now. I am! But I also understand the potential and realize that it’s completely safe. Thursday last week was another chance to safely buy. Now, you simply wait for the next safe opportunity.
A monthly view of QQQ shows that 2024 may resemble 2021. Buckle up and be ready!

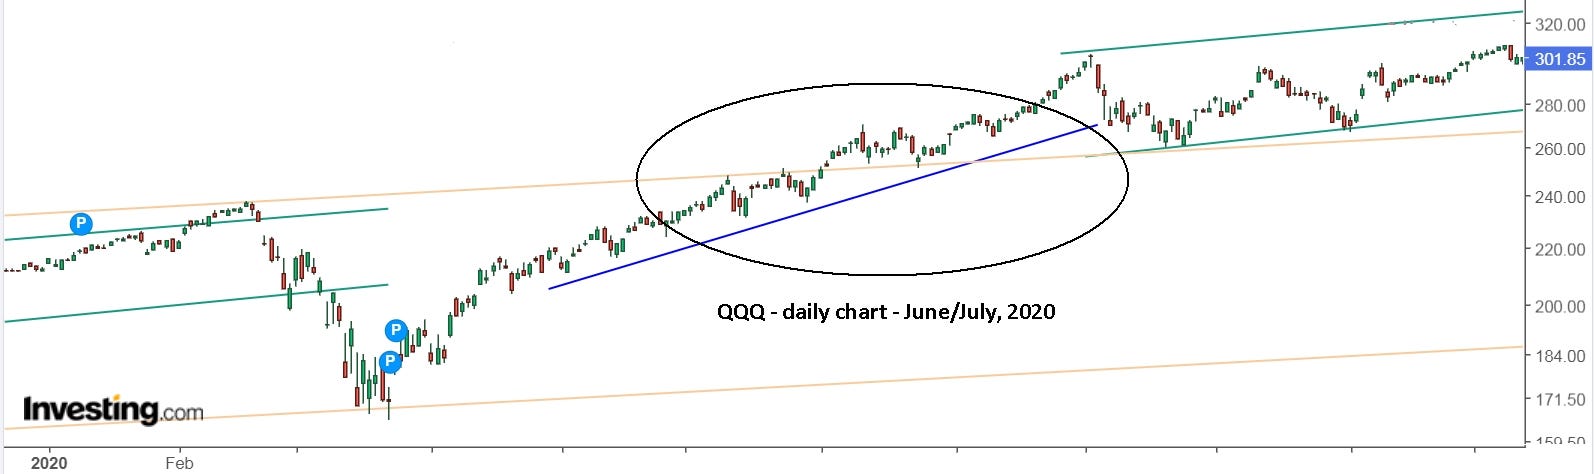
Here’s the current daily chart, roughly lined up to 2020 for comparison.
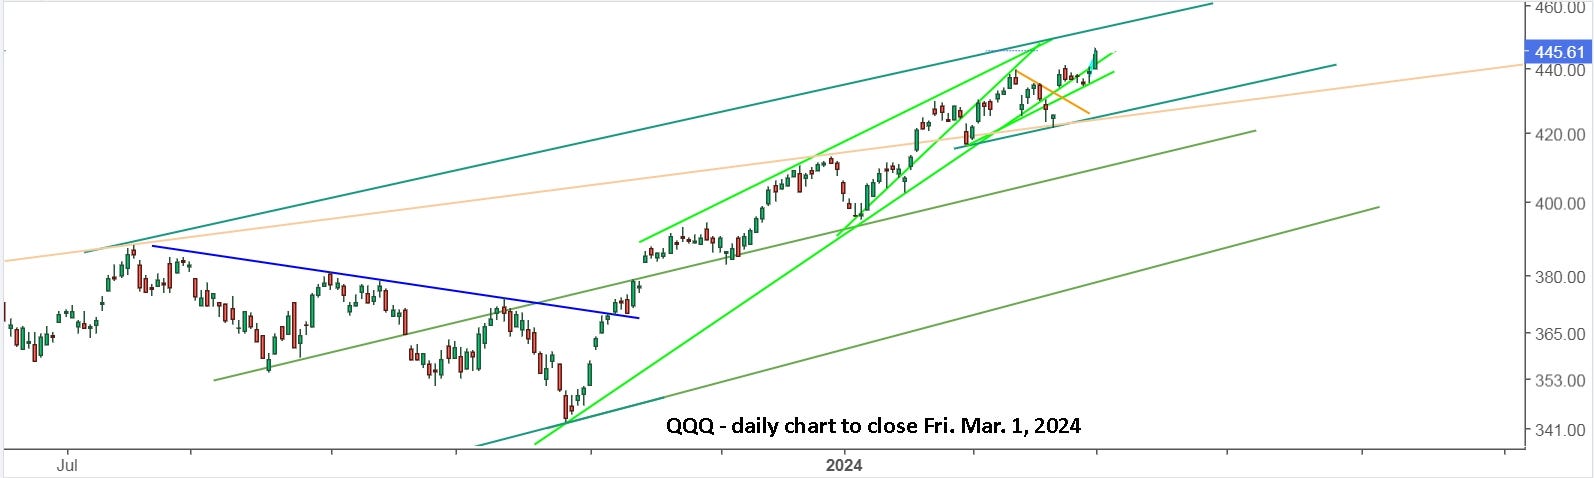
This is a great example of a picture being worth a thousand words.
Update: I just came across what looks like an interesting article, “Dow Jones Historical Chart On 100 Years *Must See Charts*”. Having an ‘expert’ support my own independent conclusion is nice to see. I’m going to email him and ask about an inflation adjusted chart.
“From a timeline perspective, we believe the big secular turning point is due late this decade, somewhere between 2027 and 2028. Between now and then, there will be pullbacks and rallies, but no secular bearish turning point, according to our cycle analysis.”
I’ll let you form your own conclusions from reading the article.
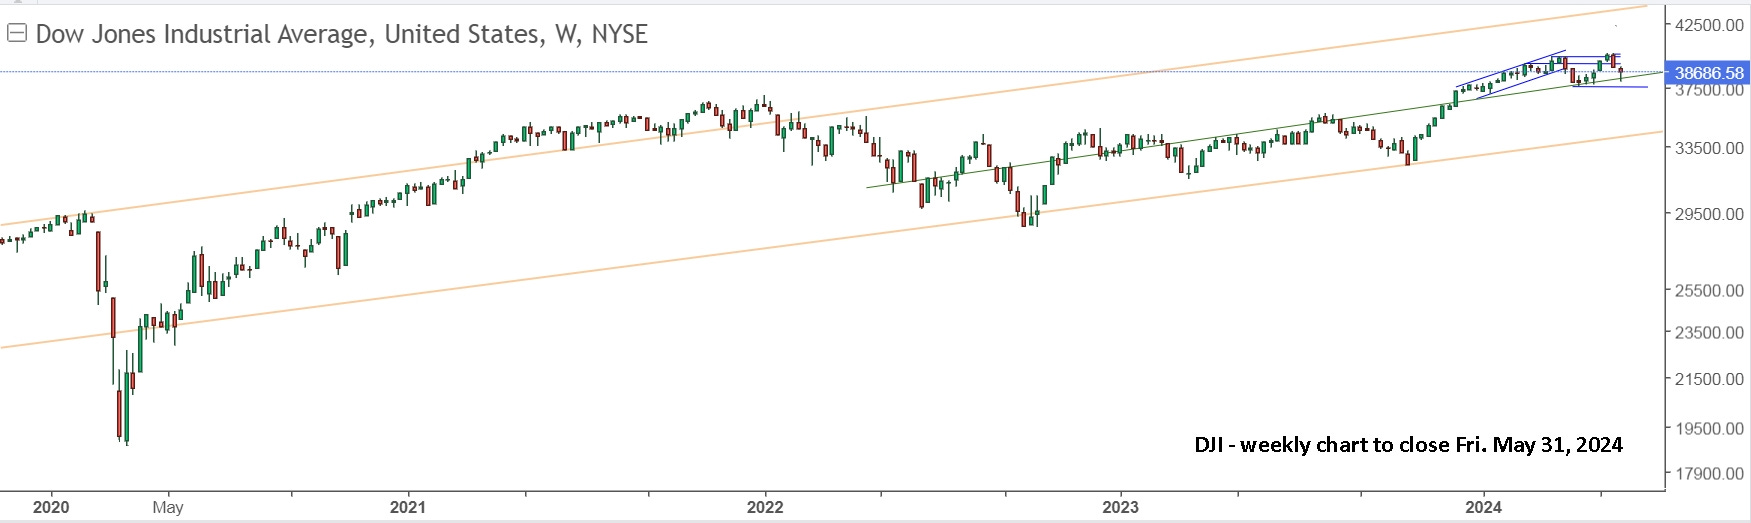
Update to Fri. May 31 : Here’s an updated view of the Dow. The weekly view suggests that it’s best to already be on the sidelines. Most likely it will continue roughly flat, but there’s certainly no more upward momentum and the risk of a quick drop is always there, so best to play it safe and take your cash off the table.
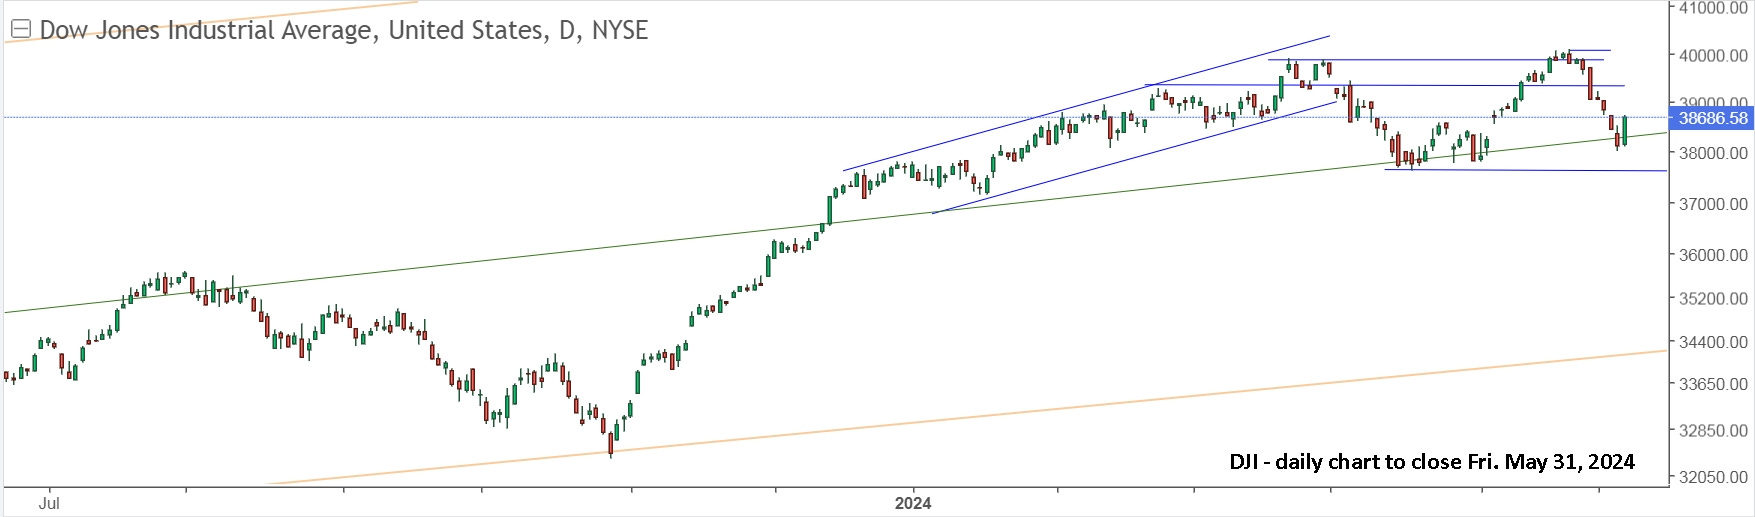
A daily view shows that the recent tops were pretty obvious. Friday’s sharp reversal was a surprise, as the other indexes dropped hard till 12:30, then rallied hard. If you’re still long, make sure you have a clear exit plan, then make sure you execute it when the time comes.
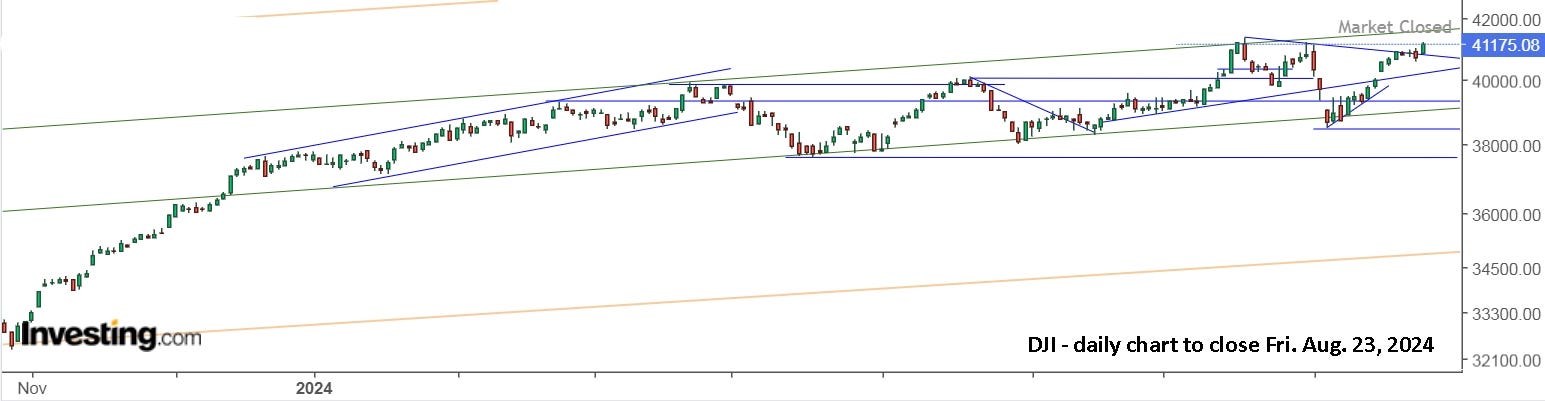
Update to Fri. Aug. 23: As you can see in the chart below, not a lot has happened with DJI since the last update. It held mostly flat, up a bit, until July 10 when it shot up for 6 days, then topped out and fell on July 18, right at upper resistance, so you would have been ready and watching to sell. You likely also sold last week, before the push lower on Thursday, and didn’t bother buying back in on Friday.
A weekly view also suggests that there’s limited reward and substantial risk.
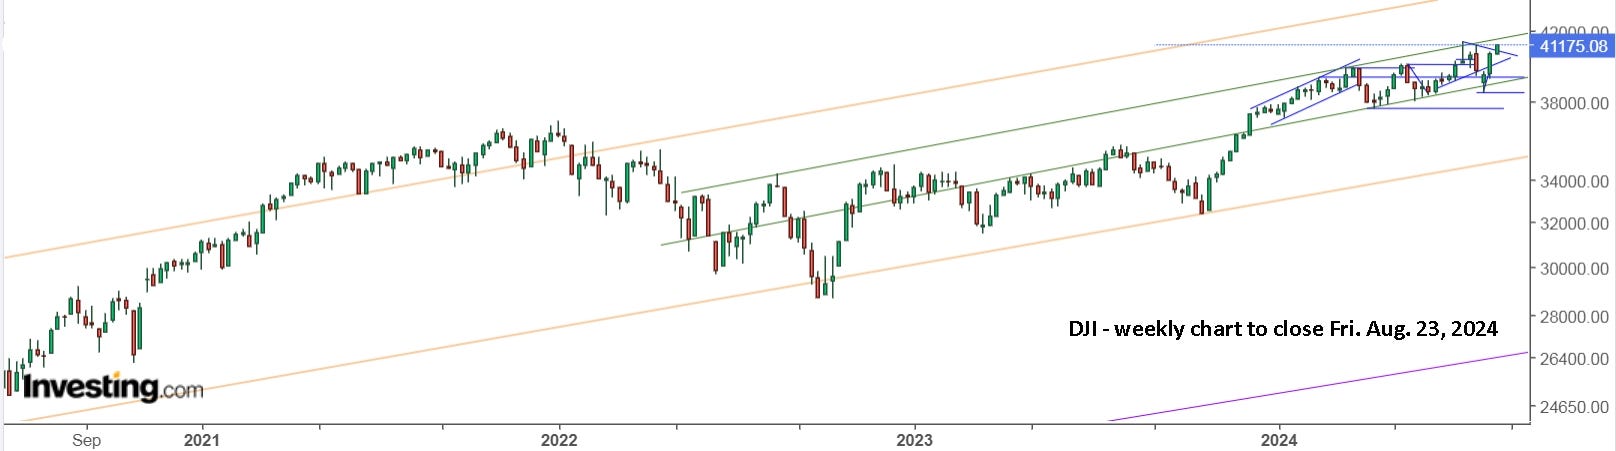
It may continue a slow climb and top 42k this year or next, but it could just as easily drop to 38k or all the way back to the lower support line around 36k at the end of 2024. I don’t expect that to happen, but it could, just as it could also rally hard up to 45k and higher. There’s no way of knowing for sure. The only certainty is that it will eventually drop, and you’ll need to sell quickly.
For my most recent and ongoing market updates, check the article, “First, you have to believe it's possible.”
Update to Fri. Jan. 31, 2025: Since the last update, the Dow has managed to grind higher from the Monday, August 5 low on the Japan carry trade news.
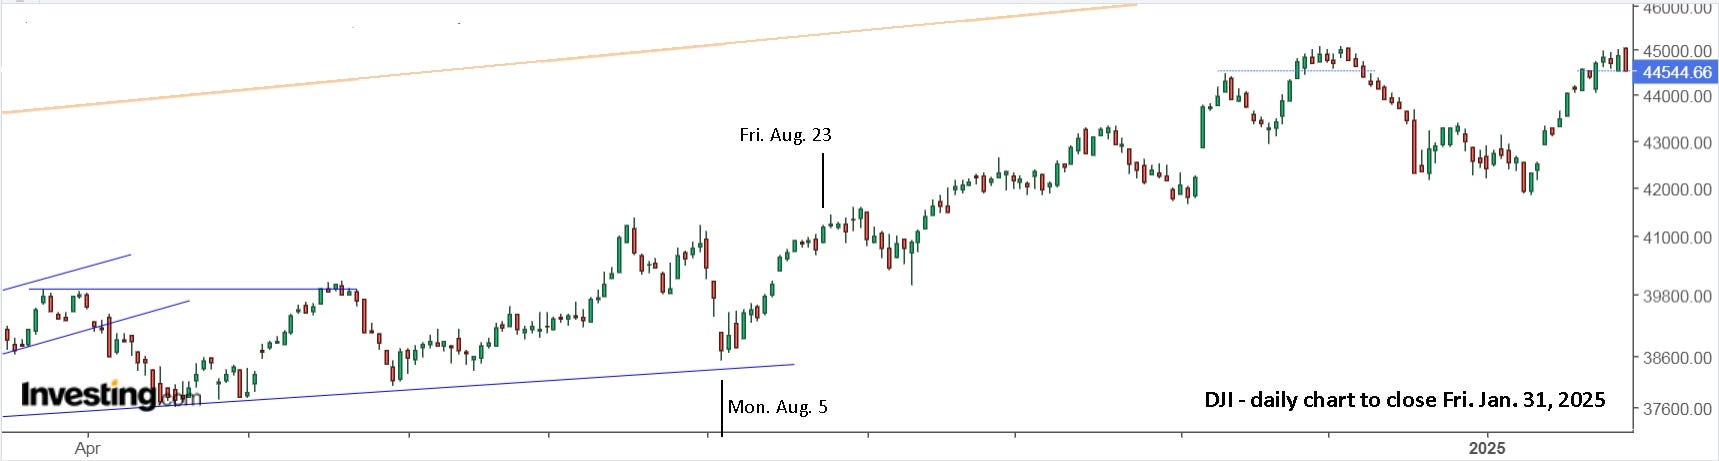
It did indeed manage to get to 45k in early December, pulled back to horizontal support near 42k and is now back to 45k and holding flat. As before, there’s no way to know which way it will go for the rest of the year, but with tariff threats looming, I prefer to err on the side of caution.
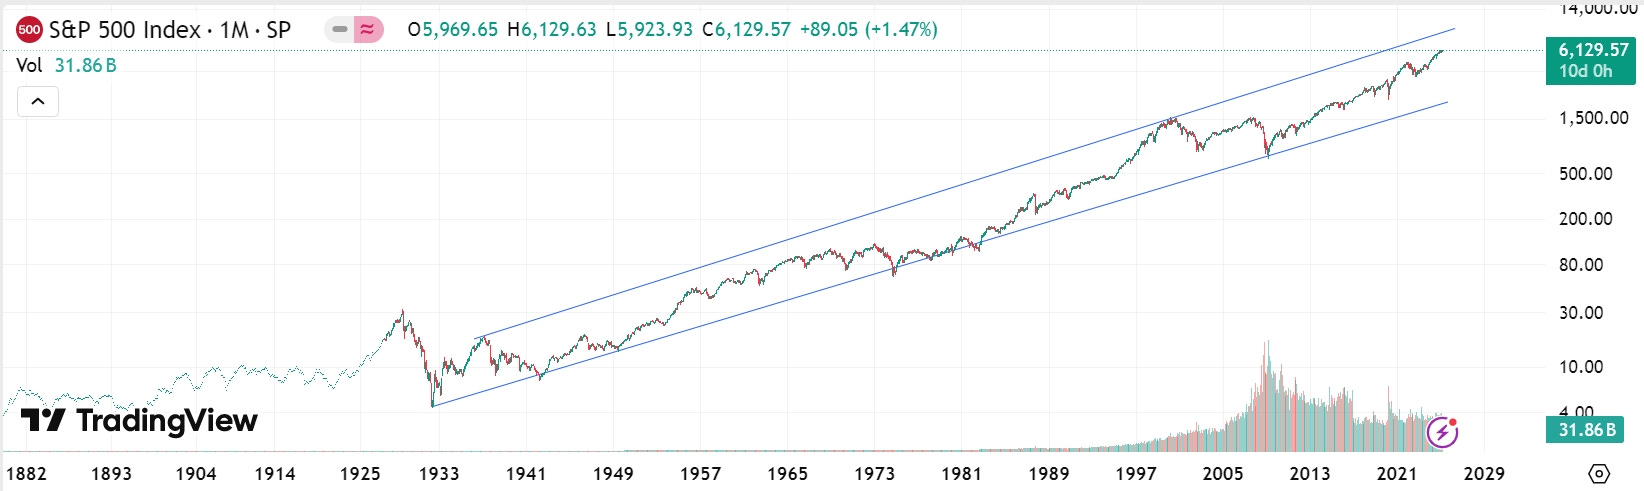
Here’s a look at 90 years for the S&P 500. It’s clearly time to have an exit strategy.
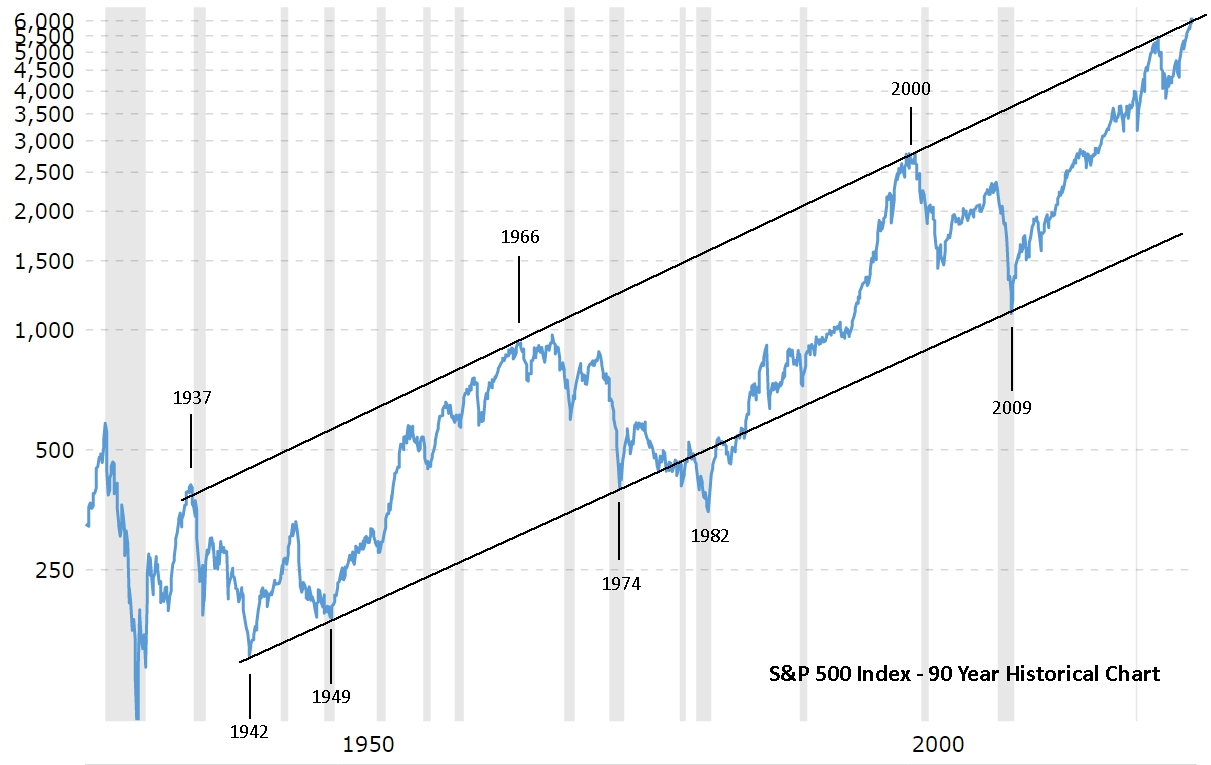
The potential drop looks ominous and certain. The same chart on TradingView doesn’t look nearly as bad.
Regardless of your view, including those with rose coloured glasses, it’s best to have an exit strategy. Here’s a look at the ETF you might be holding, or trading.
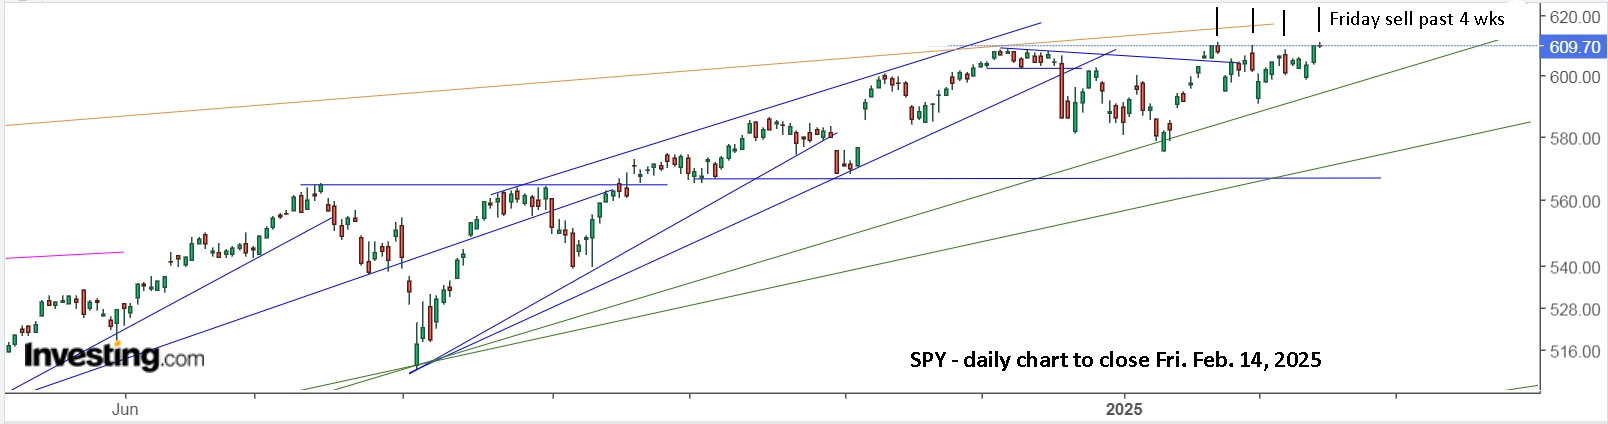
It could easily go to 620 and higher, but I would be more comfortable on the sidelines and looking for some other opportunities.
The first chart DJIA 6 month should have a resistance trendline. I have drawn it connecting 1916 highs and 2000 highs. This allows the 1929 bubble to poke above the resistance but that is understandable. This line also connects with highs in May - Aug 2021. Then it slightly rises above the line in NOV2021 and JAN2022. Now the resistance is around 40,000 give or take.
This is on long scale, remember. Then I have the support drawn from 1942 lows connecting 1974 lows and 1980 lows. The lows in 1932-33 slightly break below but that is understandable considering the panic. Again in 1982 DJIA cuts below my support line a bit. Following the support line to 2024, support is at 9,000. Interesting to think how far down that is, and how close we are to resistance.
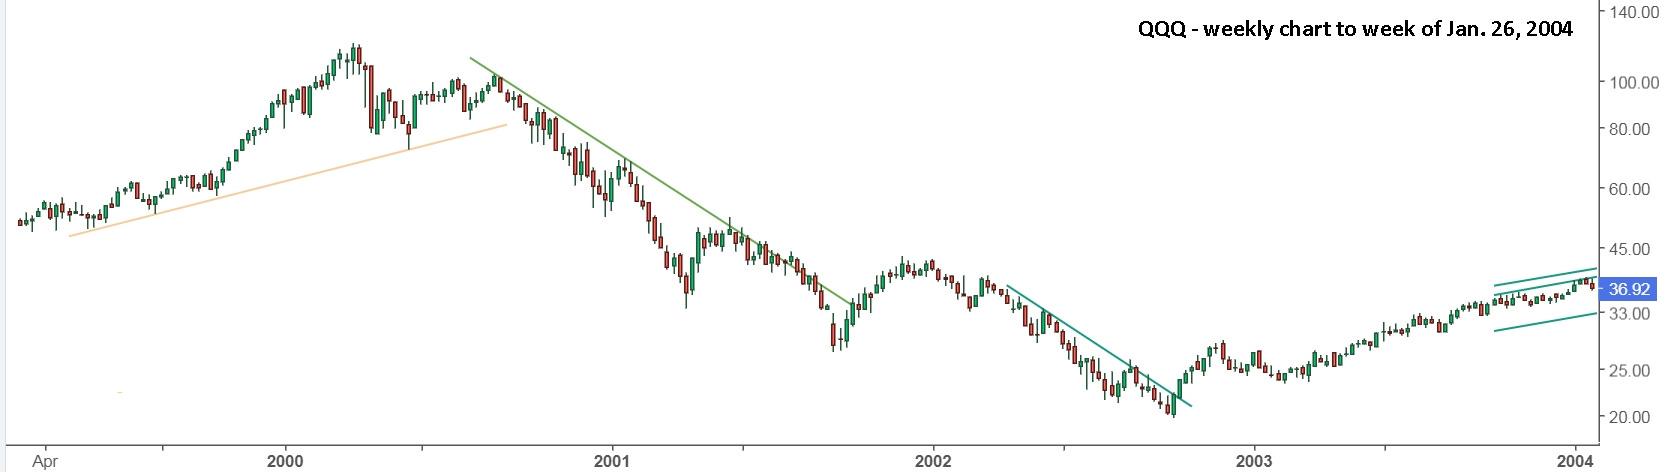
QQQ on a log scale going back to 2009 is interesting. The support trendline connects the lows from 2010, 2011, 2016, 2018, 2020, and 2022. A parallel resistance line can be drawn in 2 places. The first one goes thru the peaks in 2011, 2014, several peaks in 2018, and 2020. All of 2021 is above this line. The bear rally in 2022 was stopped by this line and so was the JUL2023 rally. Currently we are above like in 2021. A second trendline could be added that contains all the 2021 prices. In that case QQQ would reach over 500 before getting to resistance.
Personally, I would not trade using the long-term lines but they could be used that way. 2021 was the problem and shows why you need to be flexible and if you sold 11JUN2020 when it fell back below the resistance, you were not biased enough to short. 4 days later it broke above resistance again and went on an 18 month rally above a 12 year trendline.
You could buy at support, but there is no guarantee it holds, so you need a stop loss in case it drops like 1929.