Make 2024 a year of change!
Change requires action. Action requires motivation and certainty as to what action to take.

Like in the movie Lion King, when the old baboon smacks Simba on the head and he says, “What was that for?!” And the wise old baboon replies, “It doesn’t matter! It’s in the past!” Let this be your wake up call for whatever changes are ready for action. For your investments, everything is in the past, and it doesn’t matter. For me, the final pieces to my investment puzzle finally fell into place last month. The motivation to act has been there for years. The certainty of what action to take moved from 90% to 99% over the past 2 years. Over the past month, it’s now 100%.
Motivation can be a tricky thing. We’re all motivated to make changes for the better, but often there’s not enough motivation to overcome the inertia of doing nothing. My grandpa and grandma on my dad’s side were alcoholics. They were drinkers for as long as Dad can remember and it slowly got worse. His sister, Katie, is 12 years younger. Grandpa, Grandma and the doctor were all drunk when she was born! Dad tried various things to get them to quit, but nothing worked. Finally, when he was about 20, he asked a social worker if they could take a child away from parents who were alcoholics. He replied that they couldn’t, so long as the child was being taken care of. Dad asked him if he would tell them they would, if they didn’t stop drinking. Not surprisingly, the social worker didn’t agree to the scheme. Dad went ahead with the idea on his own and told Grandpa and Grandma that social services would take Katie away if they didn’t stop drinking. Grandpa quit on the spot, on his own, with Grandma still drinking. You can just imagine the willpower required to do that! He was an amazing man. Years later, another event gave him the motivation to quit smoking. He said that was even harder since the craving never goes away.
Fortunately, we’re all motivated to improve our financial situation. Unfortunately, there’s usually a LOT of inertia to overcome. There’s also a LOT of misinformation everywhere and a lot of uncertainty as to what to do. As a result, most people do nothing or only make small changes, like switching to a new financial advisor. I’m going to give you all the information you need to be certain of the specific action needed to make the change. Whether you take action or not, is entirely up to you.
Here’s a look at some returns since 2009. You can look at your own records and compare your results. QQQ is an ETF that holds a basket of tech companies and essentially matches the performance of the Nasdaq. It was a great pick and I suspect there aren’t many who did better than 20% annual returns.
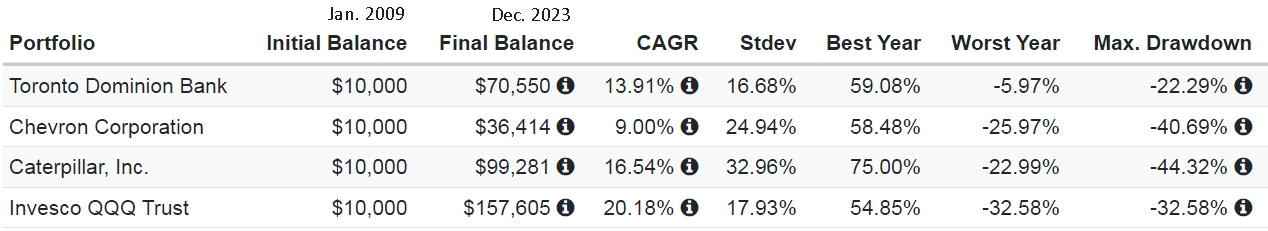
Note, the best year was more than 50% for each of them, and the worst year was over -20%, except for TD, but its maximum drawdown was -22%. CAT’s was -44%. And remember that a drop of 50% requires a 100% gain to get back to even. How can anyone still believe that it’s best to buy and hold? I had a discussion with a guy online who has held shares in CAT for over 30 years and still believes it’s a great investment. There is simply no logic or math to support that conclusion.
Note also, the big difference in your final balance with a 9% versus 20% annual return. In 14 years you have nearly 5x more with the 20% return. Note also that the best year for each was over 50%. All that information should initiate a fairly obvious question, that everyone should be asking. Is it possible to avoid the large drawdowns and catch the best years? The answer: Avoiding the drawdowns is fairly easy. Picking the best years isn’t easy, but there’s a great alternative that is easy.
Before moving on with the answer to your question, I want to emphasize the potential that awaits if you decide to take action. Here’s a look at some other returns since 2009.
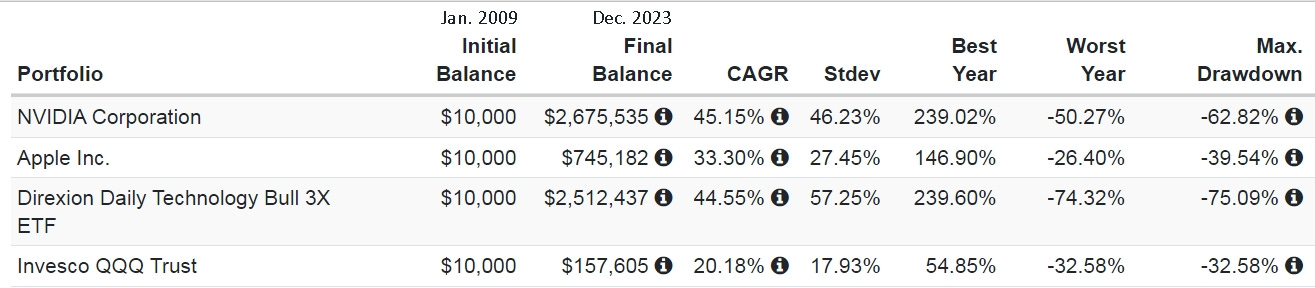
Feel free to play around with the years and stock picks using portfoliovisualizer.com. It’s a great website and includes reinvesting dividends and other features. My target is now 45% annual returns or better, and I know it’s completely possible. Yeah, I know everyone says it’s not possible, but hundreds of years ago everyone also believed the earth was flat. Why not just keep an open mind to the possibility, and the potential.
The first and most critical issue is to avoid large drawdowns. People say and believe you can’t time the markets, and I sort of agree. Timing and predicting market moves can be difficult. So is predicting the weather, but I can see storm clouds on the horizon, moving my way, and I can take action then, and especially when I get a hail storm alert for my immediate area. It’s entirely my choice to hurry outside and put my car in the garage or cover it up with a quilt and tarp, if I don’t have a garage. Hours later you’ll know if the ‘prediction’ was accurate or not. Taking action was simple and wise, regardless of whether the hail storm hit you or not.
I can also drive my car down the highway, and most highways now have ‘rumble strips’ to warn you when you’ve drifted too far to the right or left. Have you noticed that the sound is different for each? It’s a great safety feature, and most new vehicles now have driver assist for additional safety. Trading apps can provide similar safety alerts and actions, but you first need to know how to ‘drive’. You don’t need to learn anything about trading or investing, you simply need to learn to draw some straight lines and stay between them. Here’s an example. This is a weekly view, so each ‘candlestick’ represents one week. Could you draw the lines shown through the lows and highs? Obviously, everyone could draw the lines. If it gets too far to the ‘left’, then you might want to sell. If it drops suddenly through the bottom line, you’ve hit the ditch!
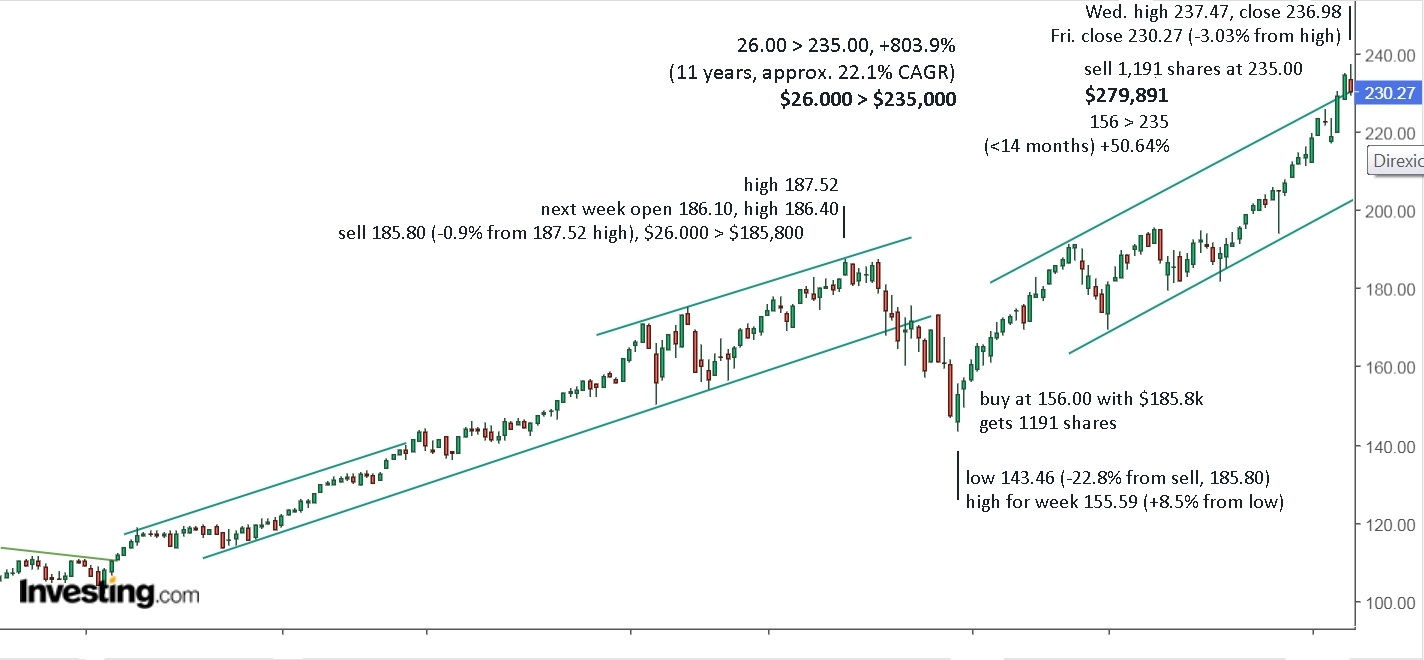
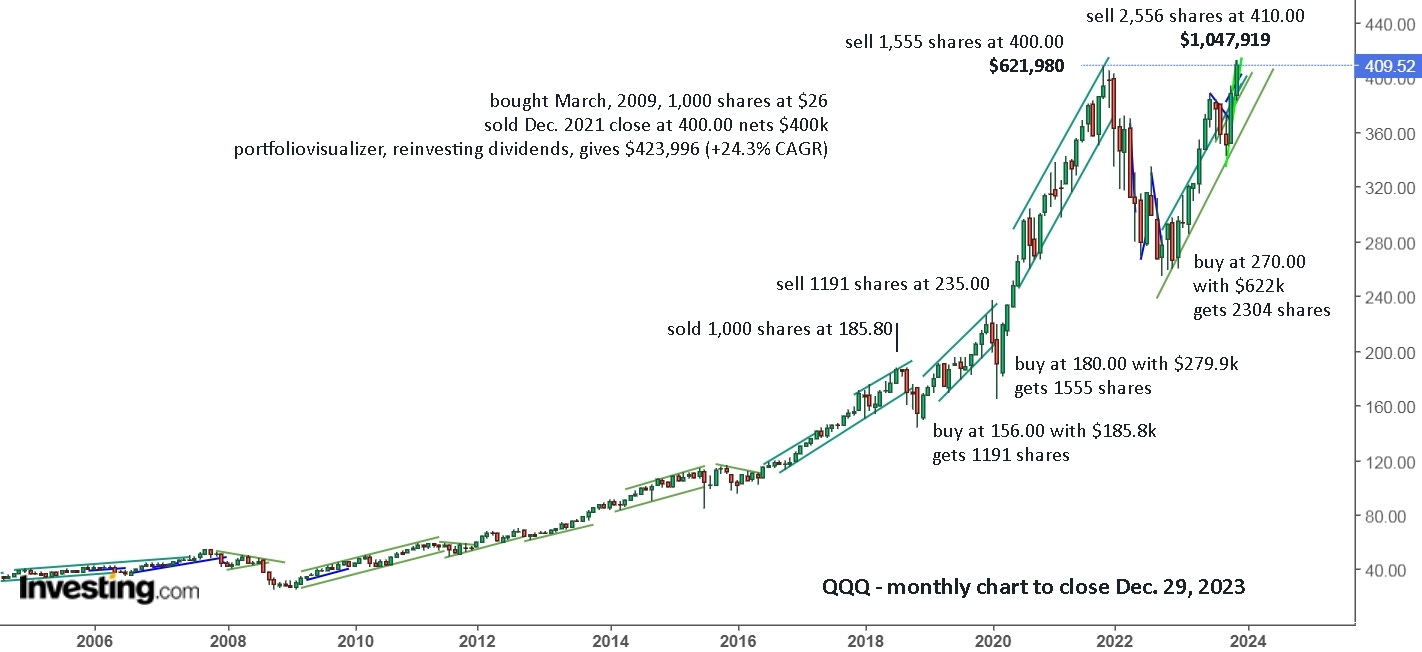
The left side of the chart shows about 2 years. The ‘single lane road’ turned into a ‘two lane highway’ and the ‘driver’ swung hard back and forth for the first while. You can decide for yourself whether you decided to sell the next time you heard the ‘left side rumble strips’. Selling at 185.80 the following week was a mere 0.9% drop from the high of 187.52, and you can always buy back at 188 if it turns into a 3 lane expressway. A few weeks later, as the other drivers swing hard right/down, you’re happily having a bite to eat at the local rest stop. Nearly 4 months later, you look out the window of your motel and see the ‘traffic’ speeding past. The highway must be clear. You take your time, load up the car and a week after getting your ‘signal’, you’re back on the ‘road’ with 1191 shares instead of your original 1000. A quick 14 months later, you’re up over 50% and traffic has been crowding the left/upper line for a few weeks. You make your own decision, but I’m selling and enjoying another break at the local rest stop. I mean, come on, +50% in a year is excellent, and you know it rarely averages that. You’re crowding the left line, crossed it sharply and have started down. Just sell, be safe, and wait to see what happens next week.
Wow!! And you didn’t even have the radio on, telling you all about covid and the chaos it might cause. You were blissfully unaware of anything except the lane in front of you, enjoying your favourite music and you decided it was time to take a rest and let the engine cool off since the temperature gauge was in the ‘danger’ area. You’d already learned your lesson to take a break and let things cool off when it gets overheated.
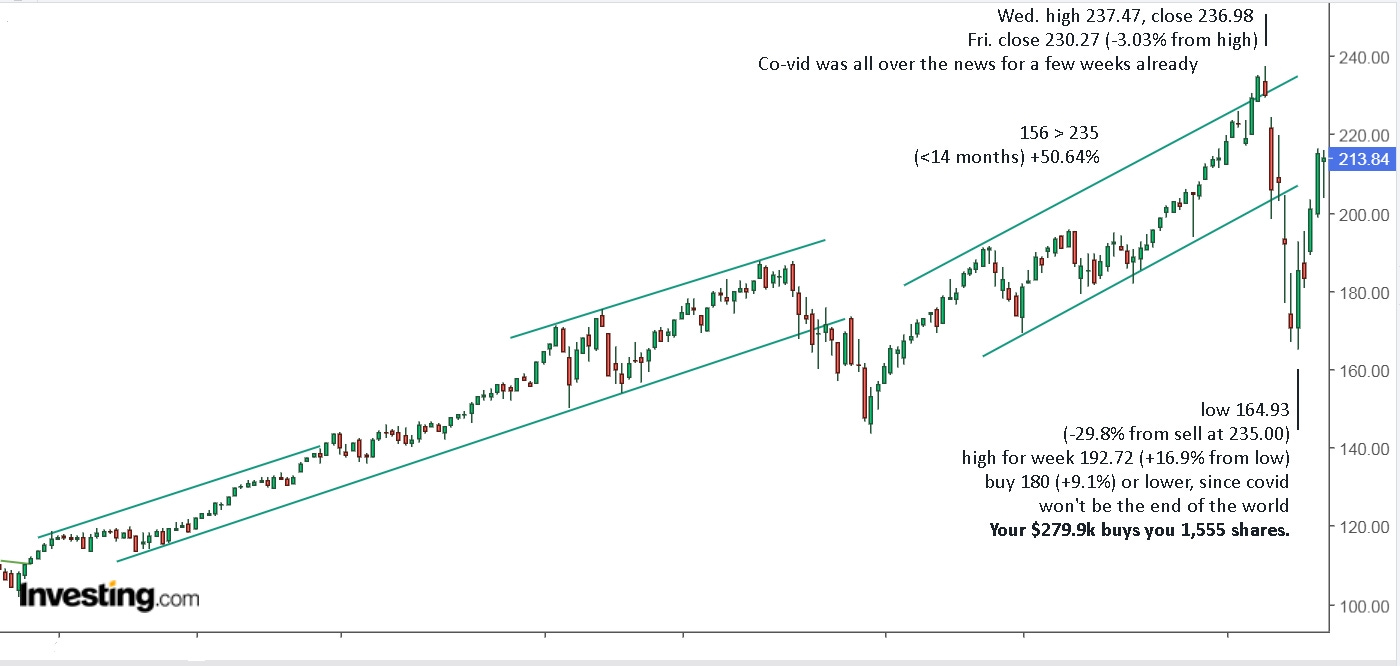
That’s it. That’s how incredibly simple it is to avoid the drawdowns. You can take any ETF or stock that you want, go back in time, draw lines and see if they help you avoid the drawdowns or not. The chart I used is QQQ, which follows the Nasdaq, which was one of the best performers from 2009 till now (excluding the superstars), with an average annual return of 20%. Fast forward to May, 2021 and you’re up 88.9% in 14 months.
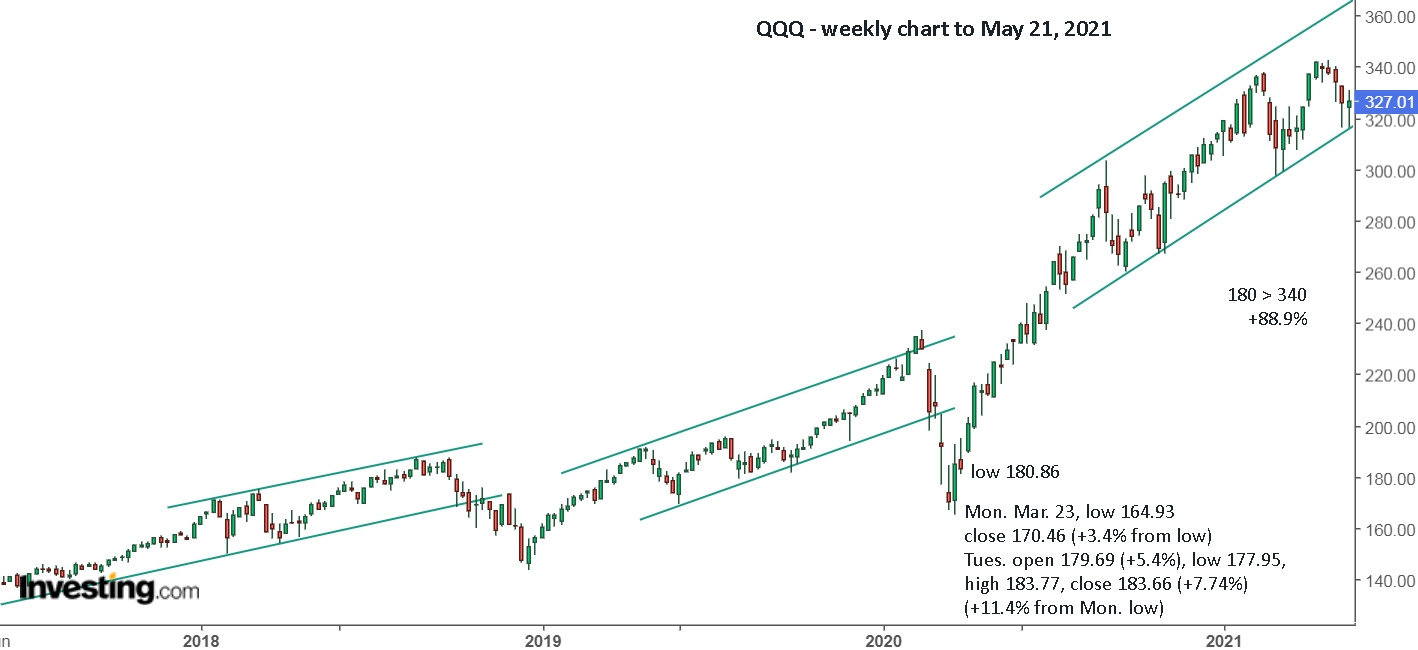
In early 2020, you were up 50.6% in less than 14 months and you were ‘overheating’ at the upper line. Now, you’re up an incredible 88.9%, but crowding the right line. That’s an amazing return and you might want to sell and take a break, but there’s really no reason to sell. The ‘car’ is running great, cooling off regularly, staying in the lane and you’ve got a ‘rabbit’ tearing up the road in front of you, so you’re safe from getting a speeding ticket. Turn up the music and enjoy the ride!
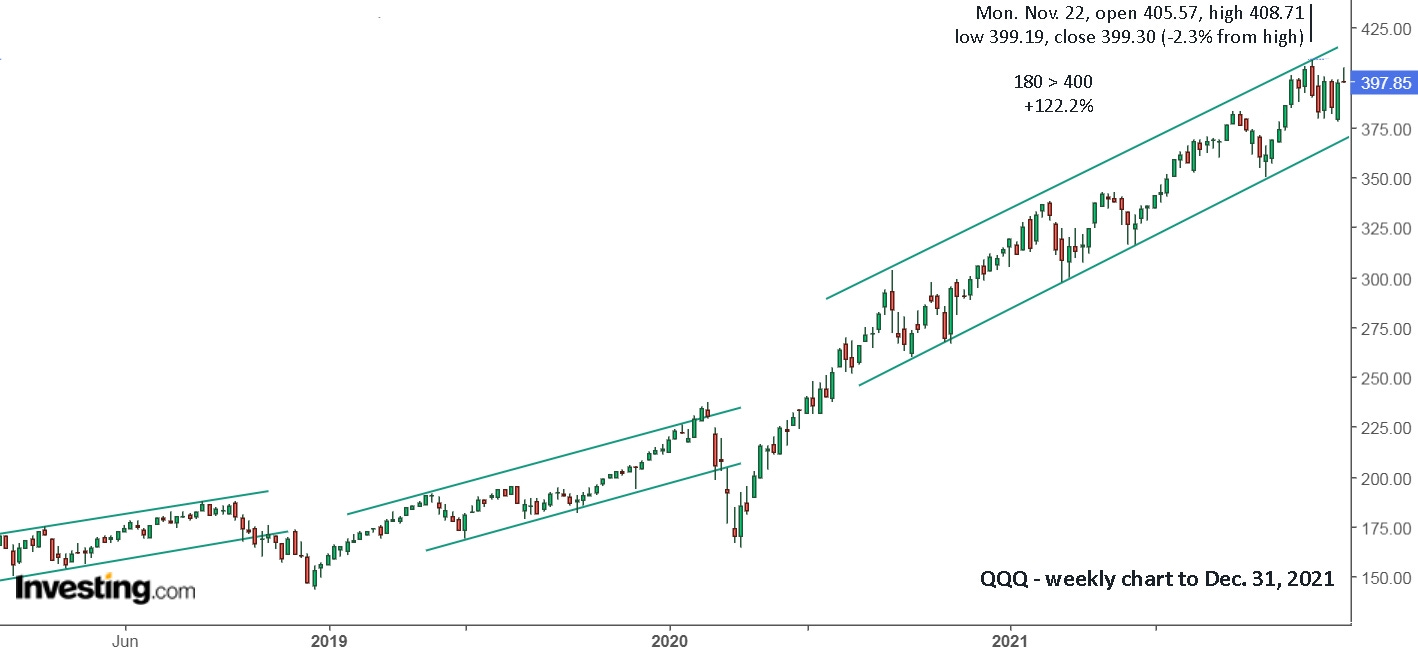
Six months later, in November, things are heating up. Things start swerving all over the place. You’re now up 122% since covid, and, just like covid wasn’t going to be the end of the world, less covid isn’t a reason for the markets to be at these dizzying heights. Perhaps we should pull over and enjoy the view. Perhaps this is the Roger’s Pass and it’s mostly downhill from here to Vancouver.
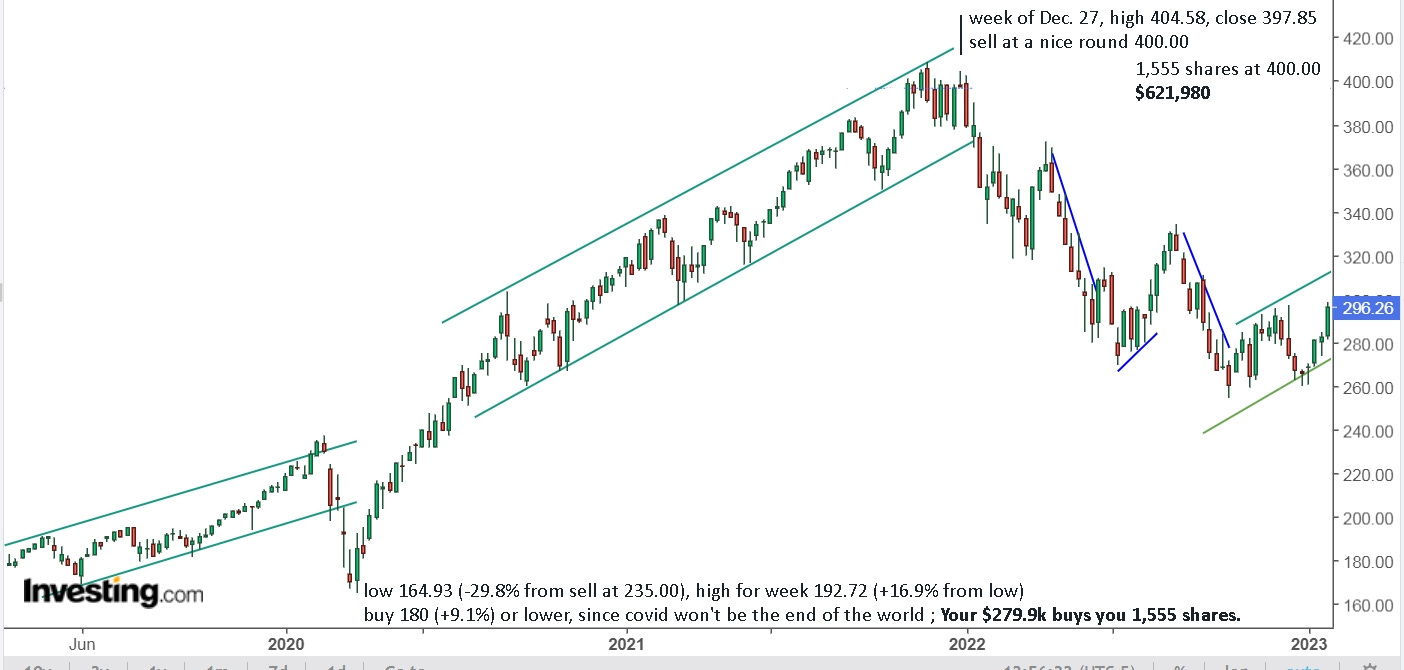
Some might say selling at 400 was lucky. Paying attention to the ‘road’ and your vehicle isn’t luck. It’s a conscious decision. Before Christmas, 2021, I finally felt confident enough to write an article, “Are You Ready For The Next Market Crash?”. On Boxing Day I posted, “Give The Gift Of Financial Security Next Year.” I didn’t have all the answers, but I felt obligated to give a ‘heads up’ to friends and family, so I posted the article to Facebook.
Clearly, selling was a great idea and your original $26k was now $622k. Market drops are actually a great opportunity to make money, but you can also just enjoy the ‘time off’. Checking the chart every week or two is still a good idea, since it wasn’t the end of the world again, and you’ll want to buy shares back with the money that’s sitting in the bank or under your mattress. The Christmas - New Year low, a year after selling at 400, was 259.73 (-35.1%). The first week of 2023 ranged from 260.34 to 270.15 and you could draw parallel lines moving up at roughly the same slope as the 2020-2021 'road'. The next week it hit a low of 268.97 and buying at 270.00 made a lot of sense as it closed the week at 280.97.
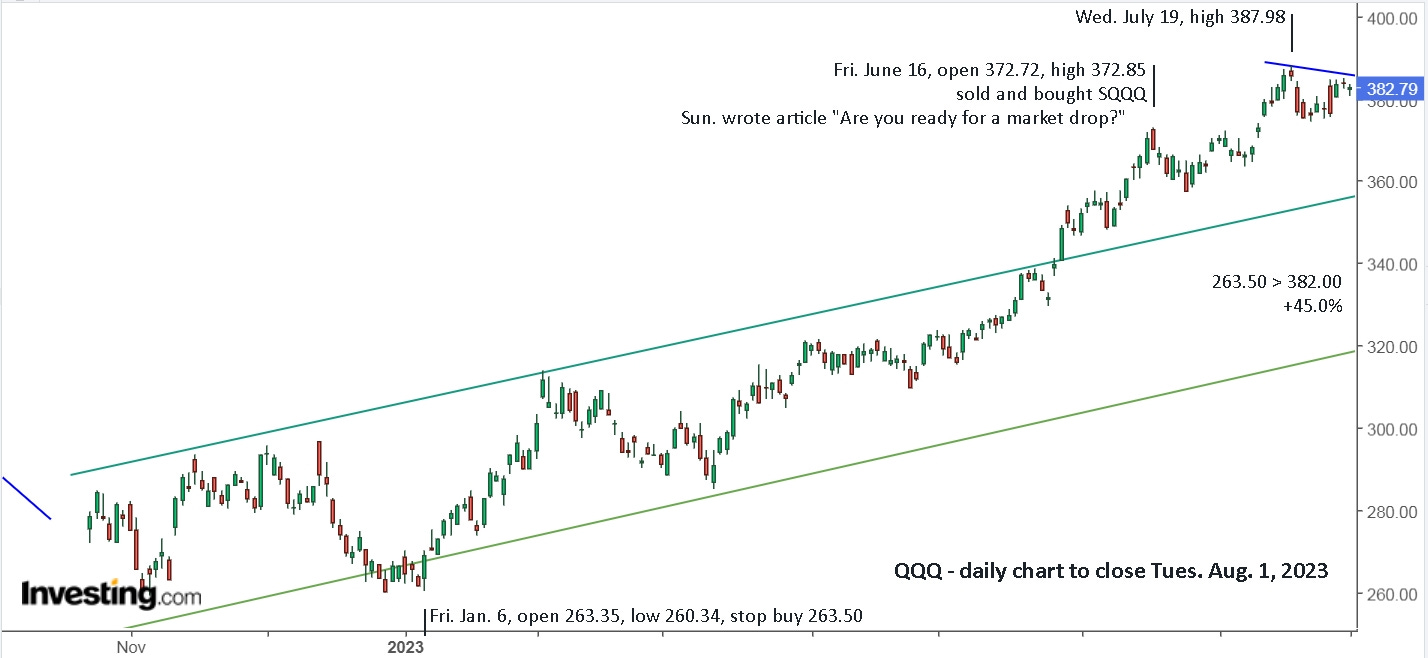
You decide for yourself when you would have bought. By mid June, I was pretty certain we were way over in the ‘passing lane’ and ready for a pullback. I sold at the open on Fri. June 16 and went short. That weekend I wrote, “Are you ready for a market drop?” Note that I wasn’t expecting a crash, just a drop. I wrote updates in that article as time passed, so you can follow along if you like. You can again decide for yourself if you bought back in around 360 and decide if you sold around 380 in July. For me, it was a clear sell on Thursday, July 20, and cautious drivers already pulled off the ‘road’ on Wednesday.
If you bought at 270 with your $622k, you got 2,304 shares. Selling at 385 nets you $887,898, just shy of a million dollars! And, you get to enjoy the summer away from the markets. That’s arguably more satisfying and certainly more enjoyable.
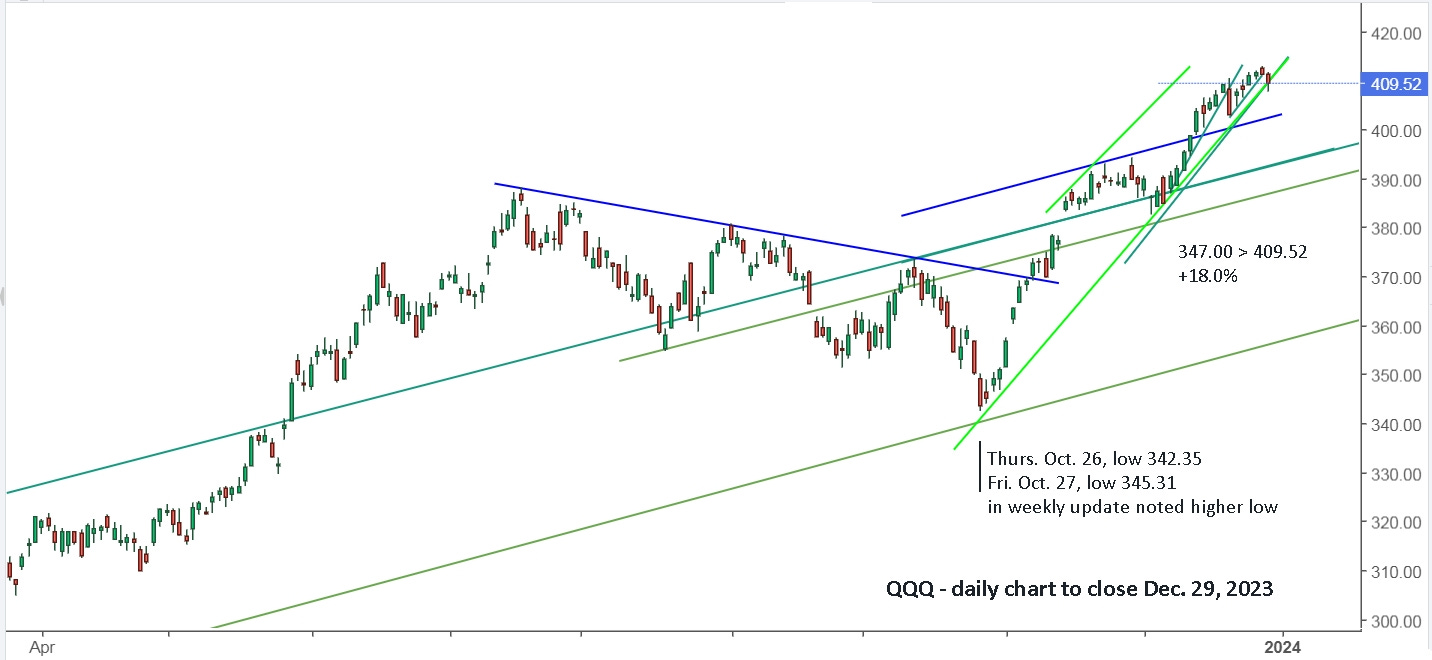
Hopefully you’re now getting the hang of drawing lines. If you were checking on a weekly basis over the summer, you may have bought in August and sold in September for a small gain or breakeven. The late September drop likely had you thinking the ‘road’ would continue ‘south’ like it did in 2022. As it held and rallied in early October, you may have bought back in. When it stalled exactly at your blue downtrend line, you had to sell and wait for another possible drop. Later in October, you’re really expecting a continued drop and are happy to be on the sidelines. In my weekly update on Sunday, Oct. 29, I noted the higher low and higher high on Thursday - Friday, and suggested the markets may be ready for a move up.
Before you start thinking I’m a savant or something, I must confess to not yet having the final piece to my ‘puzzle’. I didn’t have the light green line drawn on my active chart. I was also worried about the FOMC meeting that week. So, instead of simply keeping my eyes on the ‘road’, I was ‘listening to the radio’ and ‘driving’ in the middle of an open field with no lines. If you had your line drawn and acted on it, you bought around 347 and hung on till after Christmas, then sold on Dec. 28 at 410 or better. Now you’ve got over a million dollars under your mattress, versus the ‘excellent’ return of $157,605 (20.18% CAGR) by doing nothing since March, 2009. Simply drawing some lines and paying attention to them made a HUGE difference in your return.
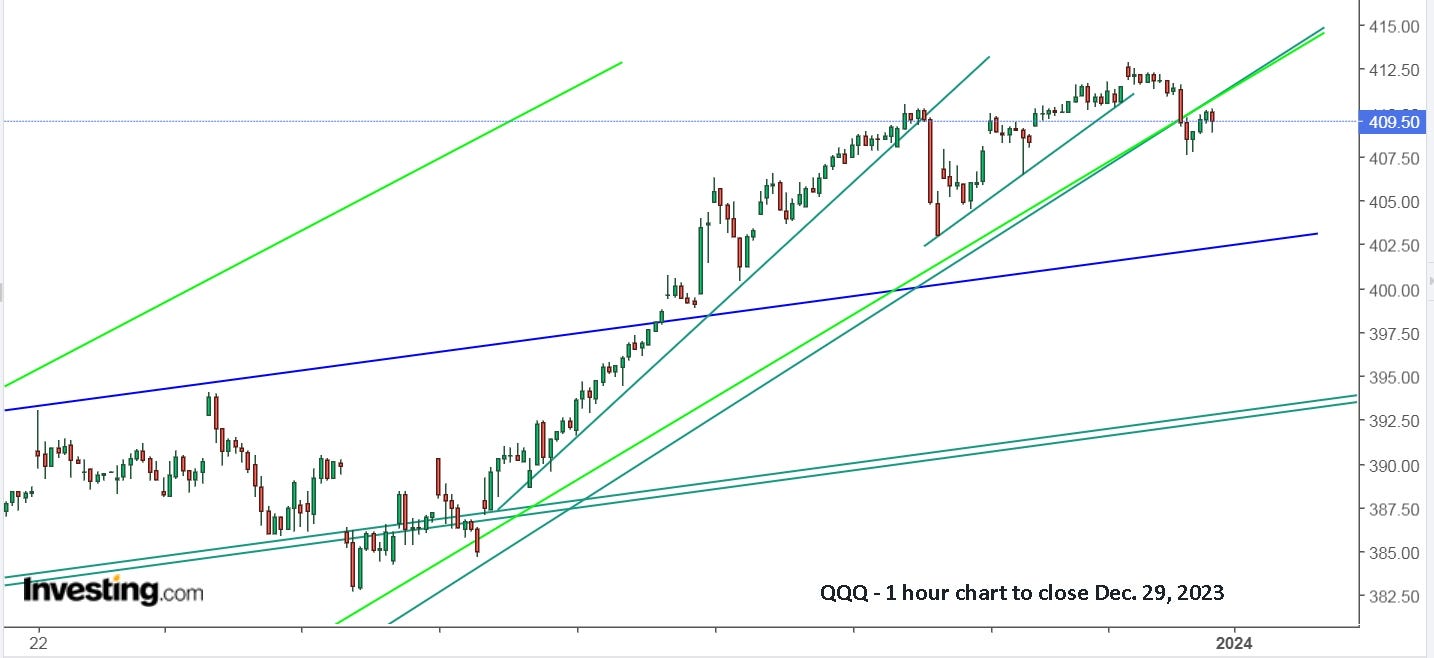
If you still believe it’s impossible to ‘time the markets’, now known as drawing some lines and staying between them, thanks for reading and please pass on this article to someone who might believe the world isn’t flat. If you think this is amazing, then come back for weekly updates to see how things progress in 2022. The hourly chart shows that it was a good idea to sell and be safe to close out the year.
Update to Fri. Feb. 2, 2024: I’ve actually been updating another article, “TQQQ/HQU - Leverage can be a useful tool.” I wanted to emphasize the benefit of buying a leveraged ETF. Basically, if you’re a good, safe driver, you might as well have a fast car to enjoy the wide open highway. You would have bought TQQQ at the open on Monday, Jan. 8, and, with no trades, you’re now up 23.4% in 4 weeks and 78.9% in 3 months.
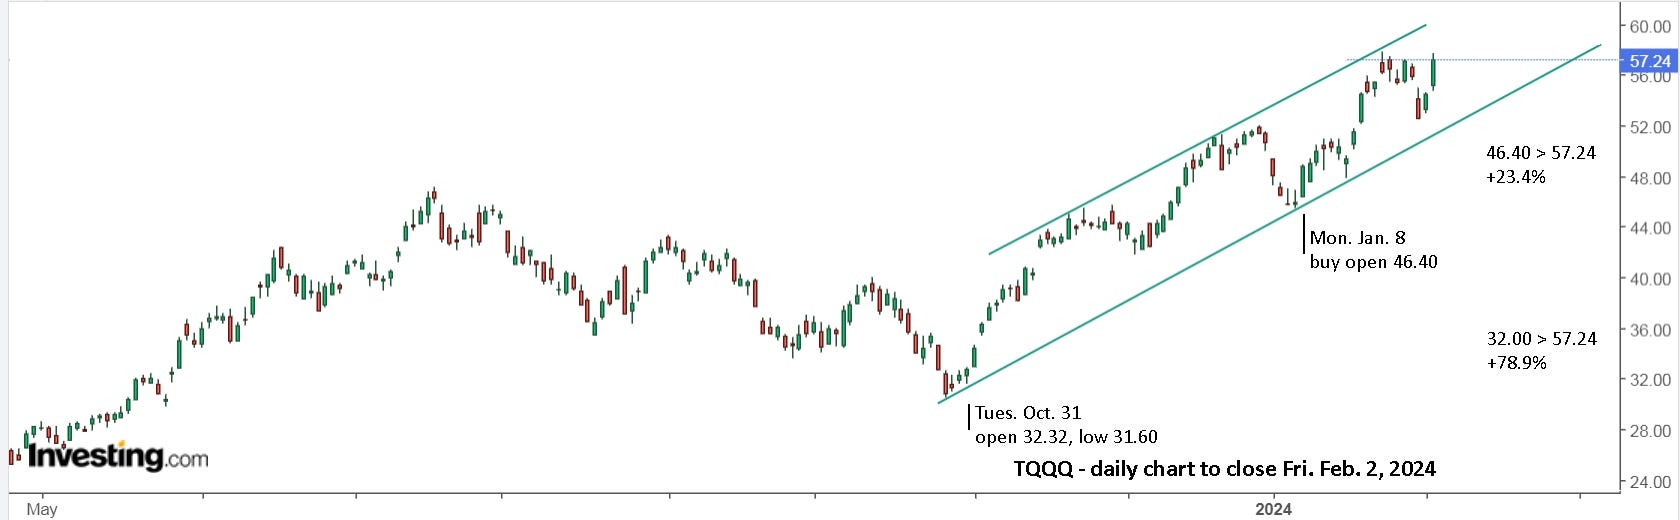
No worries if you missed this recent opportunity. There will be many, many more in the future. Just make sure you’re ready to open the door the next time opportunity knocks.
Sometimes it can be difficult to continue to hold on and not sell. However, there's always your support trendline as a last resort. If you don't get to sell on the high side, you can still avoid the drawdown by selling a break of support.
In addition, these principles can be used on daily or hourly charts depending how active you want to be. The weekly is a great way to get started.
Nice work. It's reassuring to see your charts have some of the same trendlines as mine. Typo "2022" at the end of the article.