
Missing the Market’s Best Days is a Straw Man Argument.
Missing the Market’s Best Days is a Straw Man Argument.
Proof that time in the market doesn't beat timing the market.

Have you ever seen or heard something, and your immediate reaction is, “That doesn’t make sense.” How about the TV commercial that claims you use 60 liters of water to wash dishes in the sink and only 15 liters in the dishwasher. Basically, they’re encouraging you to use the dishwasher more often. Think about it. 60 liters!?! That’s a lot of water. Even 15 liters is quite a lot and since you’re paying to have all that water treated and drinkable from your tap, maybe we shouldn’t waste it. The commercial is encouraging you not to waste water and is playing on your concerned consumer emotions.
Some myths are easy to disprove. This one is particularly easy. I used about 8 liters, which was more than I expected but I wasn’t being stingy at all. We’re using well water, so it’s coming out of the ground and going back into the ground.
Have you heard the expression “Time in the markets beats timing the markets.” Or “It’s impossible to time the markets.” How about “Buy and hold is the best investment strategy.” If you have no investing experience and hear this from a financial ‘expert’, then you’re naturally inclined to believe them. But does it really make sense? If you have some investment experience, and particularly if you have a financial advisor that you like and trust, have they said things that made you wonder? Did they get you out of the markets in 2008, or 2020 before the covid crash, or in December, 2021 or early 2022? Or did they simply reassure you that the markets always come back up and advise you not to panic?
I recently came across a Seeking Alpha article, "Proof That Time In The Market Beats Timing The Market", Aug. 17, 2022. The author stated "a recent study concludes that missing just a handful of the best days in the market can drastically reduce an investor's average returns over time." Upon searching for the source of the study, I was amazed at the number of articles quoting similar results.
Here's a chart from FMP showing the effects of missing the best 10, 20, etc days.

At first glance, it seems obvious that one needs to stay invested and not miss even the best 10 days, but does it really make sense that missing 10 days over 20 years would cause such an extreme difference in performance? I searched to find the original source of the study but came up empty. I did find dozens and dozens of similar charts and graphs over a range of years, including this from Fidelity for 1980-2022.

Again, the chart makes it 'obvious' that one needs to stay invested and not miss even 5 of the best days. But that's 5 days over 43 years! I looked to see if it perhaps meant the best 5 days per year, but no. Under "Moving out and missing out" it says, "As you can see, if an investor were out of the market for just the best five return-days over the lifetime of their investments, it could have a meaningful impact to their returns."
I don't know how they do the math, but there is an excellent site, portfoliovisualizer.com, that calculates investment returns over a chosen period. Here are the results for January 1, 2002 to December 31, 2021.

The result for SPY is close to the S&P 500 return from the chart of $61,685 (9.52%). Readers should also note the significant difference in the final balance with a CAGR of 13% versus 9.5%. I'll discuss that in a future article.
Now, there isn't an investor on the planet that would have held either SPY or QQQ for 20 years and been out for exactly the best 10 days. If one is trying to time the market, then they are out for many days, both good and bad, and perhaps best and worst. Amazingly, I only found one article disputing this crazy idea. “Exposing Myths of Investing: The Shocking Truth About Missing The Market’s Best Days!” It pointed out some of the fallacies in the concept, but didn’t take it nearly far enough.
“While I generally align with the notion that “time in the market beats timing the market,” I find that this specific data point, often accompanied by the idea of missing the 10, 15 or 25 strongest market days, may not be the most convincing illustration to support this argument.” He also noted, as I also discovered, that a Google “search uncovered VERY FEW articles specifically addressing the concept of missing the worst days in the market.” I only found his.
There’s also deception in the terms ‘timing the market’, ‘time in the market’ and ‘buy and hold’. Timing the market, suggests acting in advance or at the same moment. How about simply taking action to protect your investments?
To start, this often quoted study and results are completely ridiculous and irrelevant to actual investing. First, it makes no sense to miss the best 10 days but not the worst 10 days. For simplicity, let's use portfoliovisualizer.com, to calculate the performance missing the best year, 2013 (+29.6%), and the worst year, 2008 (-38.5%). To make it simpler, let's miss 2009 (+23.5%). Here's 2002 to 2007.

Staying in cash for two whole years, then investing the $14,206 final balance from December, 2007 in January, 2010 gives the following:
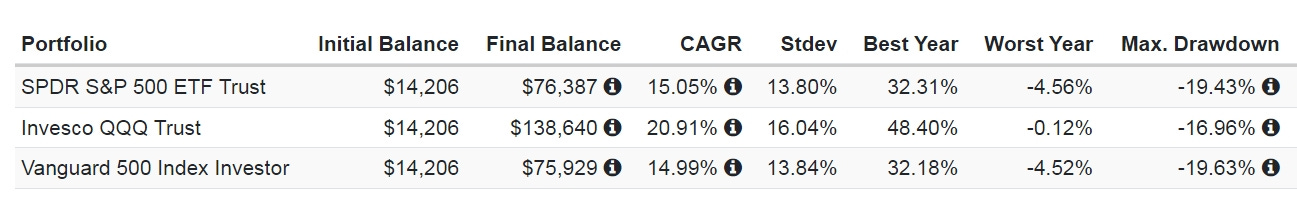
The final balance from being out of the market and holding cash for 2 years is $76,387 versus $60,996 if held the entire 20 years. That's a significant improvement and some 'best days' were surely missed. It also didn’t require ‘timing the market’.
Looking at the historical returns of the S&P 500, we see that 2002 and 2003 are -23.4% and +26.4%. Now let's put a little more common sense into the discussion. After a drop of 10.14% in 2000 and 13.04% in 2001, it would make absolutely no sense to buy at the beginning of 2002 and sit through a drop of 23.4%. Let's look at a chart to see when it was reasonable to buy and sell.

Surprisingly, it was perfectly reasonable to buy SPY in January, 2002. It was then reasonable and necessary to sell when it reversed for breakeven or a small loss. It then made sense to buy in April, 2003. By October, 2007, I'd be getting nervous with it up hard after a hard drop to the support trendline. With it falling in November, I'd take the exit. For sure, it made complete sense to sell in January, 2008. Selling then is not ‘timing the market’. You’re over 2 months late from the best time to sell.
If you ask anyone with absolutely no investment experience, if they would sell in January, 2008 or earlier, upon seeing this chart, it would be unanimous, they would sell. And 5 months later, in June, 2008, anybody who didn't sell had best take advantage of the opportunity. Without knowing anything about what was happening in the markets and the economy, simply trusting the trendlines, investors with no experience were out of the market in late 2007 or early 2008. How many financial advisors were providing such advice?

Again, anyone with absolutely no investment experience would consider buying in April, 2009. After that, simply hang on for the ride.
Notice how incredibly helpful these simple trendlines are, and that there's naturally a parallel upper and lower line, and even the slope is similar. For anyone who bought SPY in 1999, that money is only back to breakeven 14 years later! And let's not talk about inflation over those years. So much for time in the markets beats timing the market.
After seeing this simple chart, everyone should realize that buy and hold is a ridiculous strategy. They can also see that 'timing' the market isn't really that difficult. It's simply a matter of stepping aside and protecting your money when you have a lot of profit on the table and the markets are headed lower or have broken your monthly trendline.
This chart from TD shows how ridiculous the idea of missing the best days is.

I honestly don't know how they make the calculation, but common sense says it's complete nonsense.
Twenty years ago, it was reasonable to check your investments once a month or every 6 months. After sitting through the drops in 2000 and 2008, you hopefully decided to take a more active role in your investments. Perhaps you simply held and you would have still done reasonably well, but you know there were some large drops that you likely could have avoided.

Here are the returns from buying April, 2009 and holding to the end of 2023.

Buying and holding from April, 2009 to December 31, 2023 was 15.05% CAGR and turned $10k into $79k. You may recall from the first chart that the S&P 500 return gave a final balance of $61,685 (9.52%) from a $10k investment in 2002. The return from April, 2009 to December 31, 2021 was 17.31% CAGR and turned $10k into $76.5k. The great return in 2023 (24.23%) simply got you back to even from holding through the drop in 2022 (-19.44%).
Clearly, it doesn't matter if you miss the best 10 days or best 50 days. If you simply get the best 12 years out of 22 you did significantly better. Now let's look at trendlines on a weekly basis and see if it was reasonably possible to miss the worst months since 2009. I'll start at 2016 and you can go further back on your own.

Perhaps you remember the markets blasting higher in January, 2018. I remember it clearly, waiting breathlessly for the sudden drop that 'had to be coming'. Not selling at 280 or better was simply reckless.

The drop in February, 2018 was over in less than 2 weeks, plunging 11.7%, rallied and came back down providing an opportunity to re-buy months later once the uptrend was re-established.
Simply checking once a week and watching the support line has you avoiding drops of 10-20%. Being a week or 2 late re-buying also isn't a big deal. Certainly you missed a few best days during those reversals.
From the Dec. 2018 low to Feb. 2020, SPY soared 45%, and if you remember the drop in Feb. 2018, you should be ready for a drop in Feb. 2020.

The above chart shows that the market is clearly ready for a pullback. It may continue higher, but it makes a LOT of sense to be ready for a drop. With covid in the news, that should be the extra nudge you need to play it safe and sell. This time, simply following the trendlines and taking large profits off the table, you avoided a 35% drop in 4 weeks. Even if you waited till the following week, not selling after the large gap lower is again reckless. Buying a few weeks later at a 30% discount makes complete sense. The world wasn't going to end because of covid. Everything was now on sale, so buy back SPY and be ready to sell if it drops.

Note that it takes a gain of 55% and 8 months to get back to where you were at pre-covid. I'm sure many were surprised by the power move up in 2021, but the weekly trendline had you holding on. When it hit a ceiling the first week of November and you're up 116% in less than 2 years, it sure made a LOT of sense to take your gains off the table. Before Christmas, 2021, I finally felt confident enough to write an article, “Are You Ready For The Next Market Crash?”. On Boxing Day, I posted “Give The Gift Of Financial Security Next Year.” I didn’t have all the answers, but I felt obligated to give a ‘heads up’ to friends and family, so I posted the article to Facebook.
Heeding my advice or the trendlines allowed you to avoid the 27% drop, which then allowed you to buy back at a discount and hold for a gain of 37%. If simply held, you have the same value as you had 2 years ago. Watching trendlines, taking profits off the table, avoiding a major drop and missing a bunch of 'best days', gave a 37% return in 2 years, versus 0%.

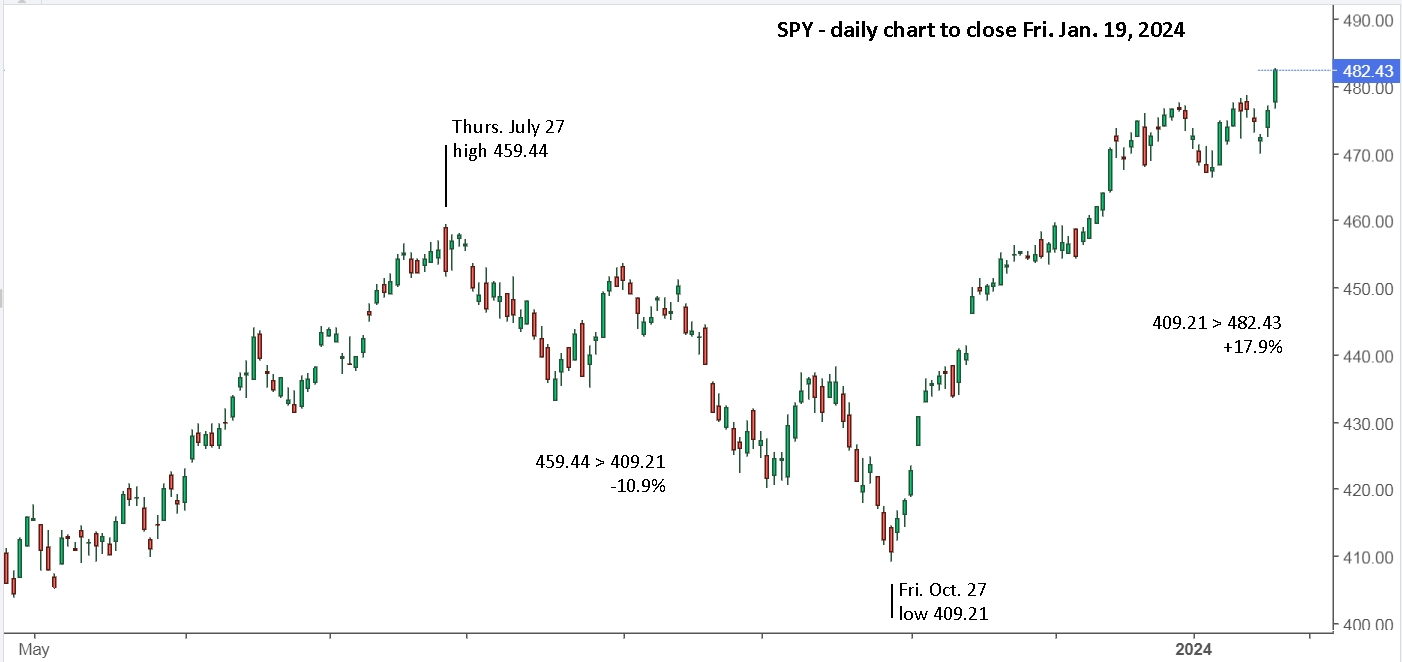
Moving forward in time, it's now up to each individual to decide if they want to stay in the market for the 10 best days, or get out of the market when the time comes and miss the worst months. A daily view will hopefully help you decide.

Remember, heeding the trendlines at the end of 2021 allowed you to avoid the 27% drop in 2022, which then allowed you to buy back at a discount and hold for a gain of 37%. If simply held, you have the same value as you had 2 years ago. Paying attention to trendlines on a daily chart, again checking just once a week, helped you avoid a 10% drop in 2023. Avoiding that drop, now has you up over 50% compounding versus 0%.
Of course, one doesn't have to do nothing while the market is dropping, so the potential gains are even greater than what I have presented. Telling people to stay invested and ride the roller-coaster is just plain wrong! Telling them that missing the best 10 days in 20 years will cut your return in half, well that's simply deception of the worst kind. I would add that your time is also valuable, so a system that only requires 10 minutes a week to monitor maximizes your financial returns and time invested.
If you’re new to my blogs, you might want to read some recent posts: “$10k + 10min/wk +10yr = $1M” was an idea that come to mind and then I went back in time to see what it would have been. The 10 year return for QQQ, from 2014-2023, with just 7 trades turned $10k into $153k versus holding for those 10 years which yielded $50,785 (17.65% CAGR). Holding the leveraged version, TQQQ, gave $201,143 (35.01% CAGR), and that’s with no trades. With 16 trades to November, 2021, just under 8 years, $10k + 10min/wk + 8yr = $44.3M. I definitely wasn’t expecting that, but I was expecting more that $1M.
The power of leverage and compounding returns is undeniable. It’s simple math. That led me to write “TQQQ/HQU - Leverage can be a useful tool.” where I looked at daily charts for QQQ but with the same philosophy of checking once a week and making as few trades as possible. Once again, avoiding drops and ‘timing’ re-buys was pretty obvious. A conservative scenario was 5 trades from April, 2020 to November, 2021 and turned $10k into $140k. Certainly worth the time and effort of 10 minutes a week. You then avoided the drop in 2022 and made a 50% compounded return in 2023 with a single trade, versus just getting back to even with no trades.
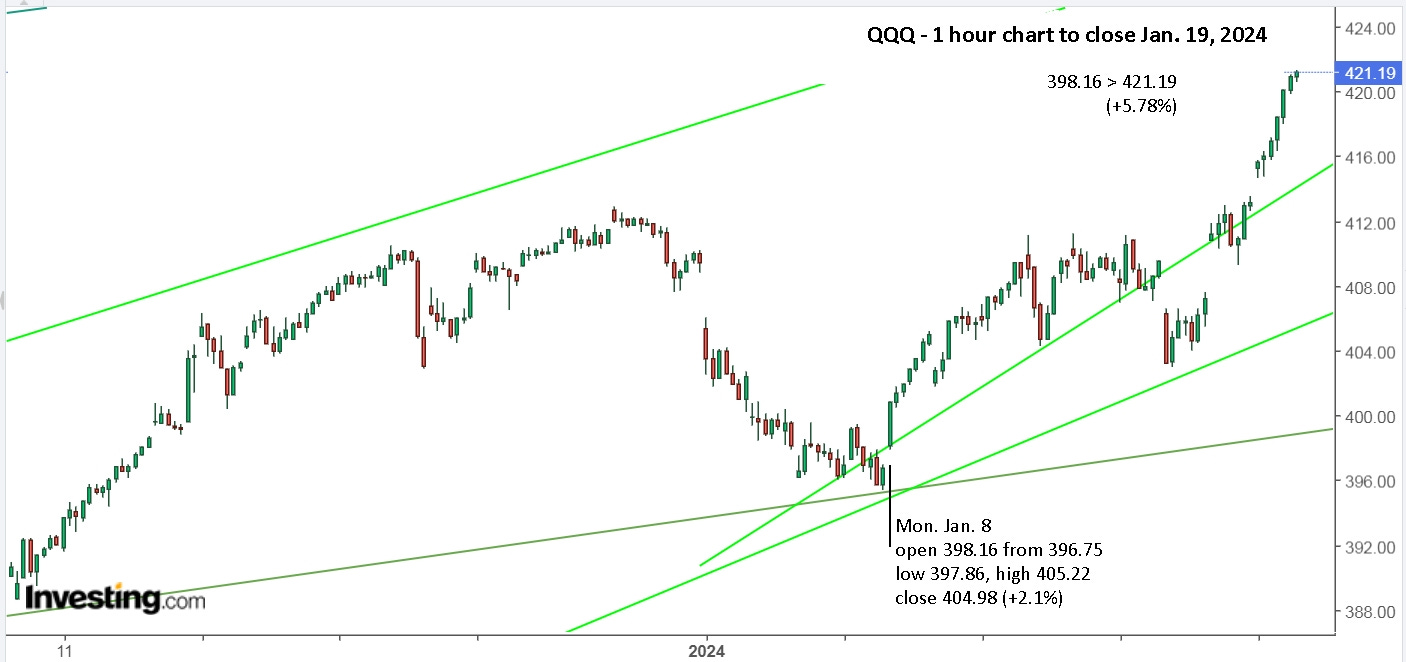
The missing piece to the puzzle was having the trendlines on an active chart extending into the future. That way you could see the daily and hourly chart approach the lines, and wait to see if it held. You can now follow along, week by week, in 2024.
Jan. 8 was a buy and, according to the strategy, you should still be holding, +17.6% with TQQQ or +5.8% with QQQ.
From the above chart and every chart shown, you’ve hopefully learned that what goes up, eventually comes down. So, you need to continue watching and ready to sell, and, if you like, you can put your money to work while the markets are falling. One of the key strengths of following the trendlines is that there’s no attempt to ‘predict’ the future. You simply stay between the lines. That said, knowing what has happened in the past can help prepare you for what might happen in the future. Here’s a look back to 2018.
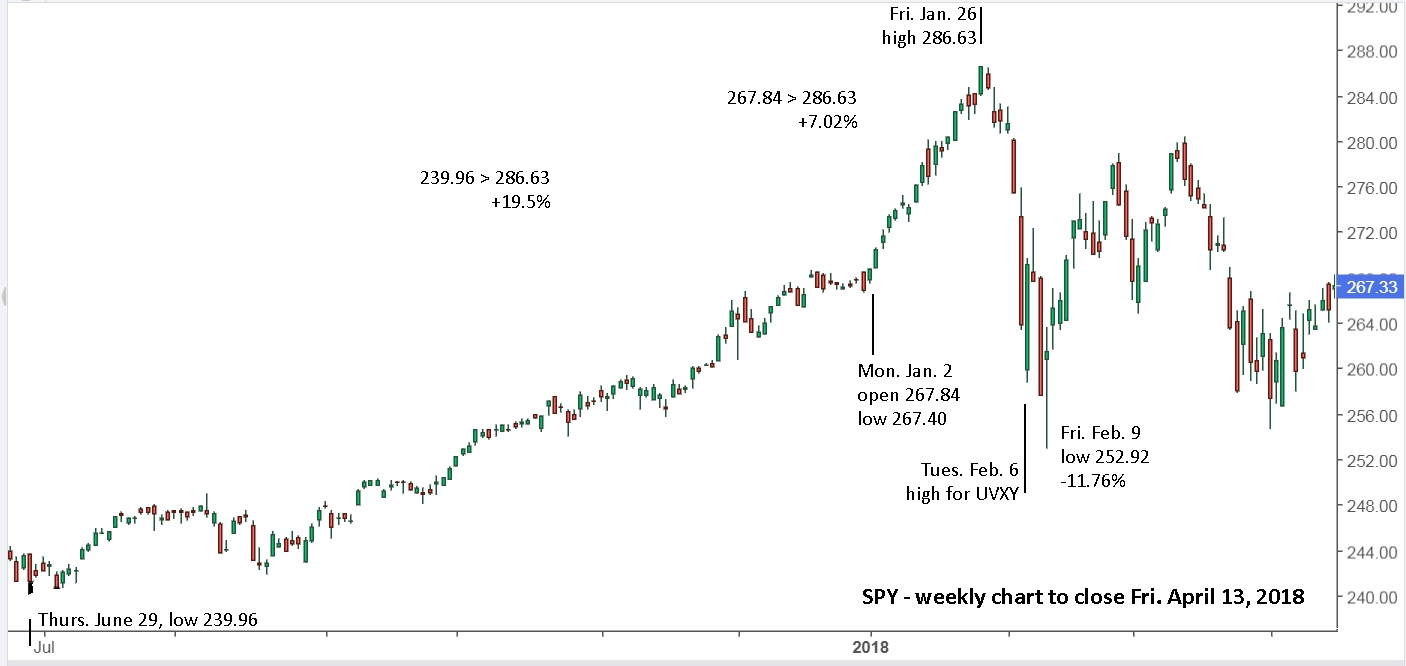
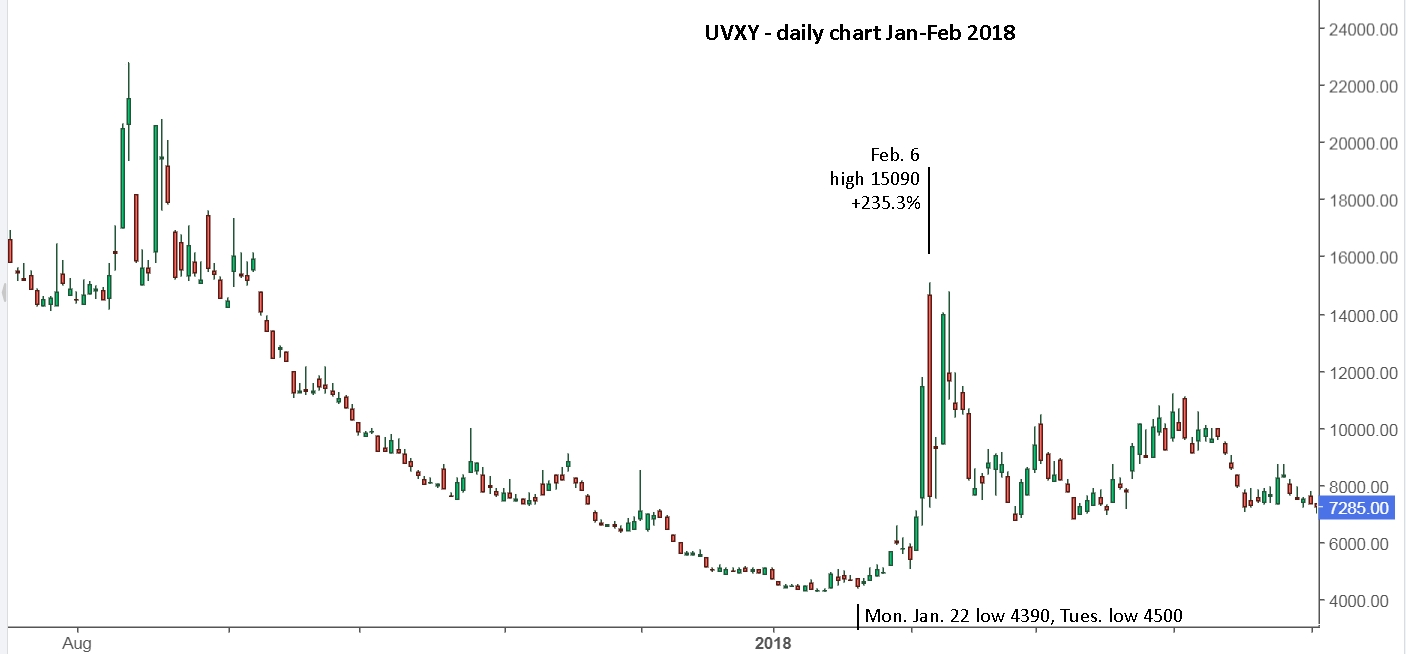
I clearly remember the markets going higher and higher, every day, and they’d already made a big move up since July, +19.5%. It’s now up 17.9% since Oct. 27. That’s a lot.
I have no idea how high it will go, but when it does, UVXY will be a great trade, just like it was in 2018 and 2020.
So, buckle up and enjoy the ride in 2024! (For weekly updates, “TQQQ/HQU - Leverage can be a useful tool.”)
I just went back to 1970 for the S&P 500 and the trendlines were accurate all the way. So cool. And the current trend is up on the monthly, weekly and approaching the upper daily trendline.
Buy and hold is indeed a strange concept. Perhaps people forget how short life is and that markets don't always go up with only 1 year down like 2022. Look at the SP500 historical chart going back 90+ years. From 1929 to 1955, there were zero new all-time highs. That's 26 years of not making any return. How about 1969 to 1992 - 23 years without a new all-time high. 2000 to 2015 - 15 years. So since 1929, there were 26+23+15 = 64 years out of 95 years where the market did NOT go up. The market only goes up 33% of the time. How do you know one of those periods isn't about to happen now? What if the next period is 35 years long and starts in 2 months? Your financial security is too important to just shrug that question off.